Theses, Dissertations, and Student Research from
Electrical & Computer Engineering Electrical & Computer Engineering, Department of
Spring 4-2016
Error Mitigation in RSSI-Based Fingerprinting
Localization Using Multiple Communication
Channels
Francisco Javier Mora-Becerra
University of Nebraska-Lincoln, [email protected]
Follow this and additional works at:http://digitalcommons.unl.edu/elecengtheses
Part of theElectrical and Computer Engineering Commons
This Article is brought to you for free and open access by the Electrical & Computer Engineering, Department of at DigitalCommons@University of Nebraska - Lincoln. It has been accepted for inclusion in Theses, Dissertations, and Student Research from Electrical & Computer Engineering by an authorized administrator of DigitalCommons@University of Nebraska - Lincoln.
Mora-Becerra, Francisco Javier, "Error Mitigation in RSSI-Based Fingerprinting Localization Using Multiple Communication Channels" (2016).Theses, Dissertations, and Student Research from Electrical & Computer Engineering. 70.
by
Francisco Javier Mora-Becerra
A THESIS
Presented to the Faculty of
The Graduate College at the University of Nebraska In Partial Fullment of Requirements
For the Degree of Master of Science
Major: Electrical Engineering
Under the Supervision of Professor Lance C. Pérez
Lincoln, Nebraska April, 2016
USING MULTIPLE COMMUNICATION CHANNELS Francisco Javier Mora-Becerra, M.S.
University of Nebraska, 2016 Adviser: Lance C. Pérez
Location data from radio signal strength indication (RSSI) based wireless networks has been used in various applications such as creating smart home behavioral mon-itoring systems, tracking health care workers for the spread of hospital-associated infections, and providing location-aware tour guide systems. Because RSSI-based systems are inexpensive and can be used with most wireless devices without requir-ing additional hardware, they are a popular choice for localization. Unfortunately, multipath fading dramatically degrades the performance of an RSSI-based system's ability to locate a target indoors. This thesis endeavors to reduce localization error for RSSI-based ngerprinting localization systems in an indoor environment through frequency diversity by using multiple communication channels. By creating a mul-tichannel ngerprint of the environment using ngerprinting calibration techniques, ne-grained, 5 centimeter, 2-dimensional localization accuracy is achieved in an in-door environment under certain restrictions.
DEDICATION
To my father. Gracias por todos los días que me obligaste a ayudarte con las repara-ciones de la casa y trabajos de mecánica. Aunque a veces no me gustaba y odiaba hacerlo, cada día era una oportunidad nueva para enfrentar un reto y poder formar la mente de un ingeniero.
Contents
Contents i
List of Figures iv
List of Tables vi
1 Introduction to Localization Methods 1
1.1 Indoor Localization Methods . . . 2
1.1.1 Active Versus Passive Systems . . . 2
1.1.2 Acoustic Methods . . . 3
1.1.3 Inertial/Mechanical Methods . . . 4
1.1.4 Photonic Methods . . . 5
1.1.5 Radio Frequency Methods . . . 7
1.1.5.1 Radio Frequency Timing Methods . . . 7
1.1.5.2 Radio Frequency Angle-of-Arrival . . . 8
1.1.5.3 Radio Signal Strength Indication . . . 8
1.2 Factors Aecting RSSI-Based Systems . . . 10
1.2.1 Multichannel RSSI-Based Localization for Multipath Eect Mit-igation . . . 12
1.3 Problem Statement . . . 14
2 Review of RSSI-Based Localization Methods 16 2.1 The Multipath Propagation Model . . . 17
2.2 Terminology for RSSI-Based Localization Methods . . . 22
2.3 Single Channel Range-Based Localization Methods . . . 24
2.3.1 Trilateration . . . 24
2.4 Fingerprinting for Single Channel RSSI . . . 27
2.4.1 kNN . . . 28
2.4.2 ANN . . . 29
2.5 Multichannel RSSI Methods . . . 31
2.5.1 Other Multi-Frequency Approaches . . . 32
2.5.2 Fingerprinting with Multichannel Data . . . 35
2.6 Summary . . . 36
3 Fingerprinting Methods for Localization 37 3.1 k-Nearest Neighbors Algorithm . . . 39
3.2 Articial Neural Networks . . . 42
3.2.1 Training with the Back-Propagation Algorithm . . . 45
3.2.2 Training with the Levenberg-Marquardt Algorithm . . . 49
3.3 The Particle Filter . . . 50
3.3.1 The Optimal Bayesian Tracking Solution . . . 52
3.3.2 Sequential Monte Carlo Simulation . . . 53
3.3.3 Sequential Importance Sampling . . . 53
3.3.4 Sequential Importance Resampling . . . 55
3.3.5 The General Particle Filter Algorithm . . . 56
4 Results 58
4.1 Experimental Setup and Data Collection . . . 58
4.1.1 Channel Selection . . . 64
4.1.2 The Dataset used for the Localization Algorithms . . . 67
4.2 Training and Testing Datasets with Localization Algorithms . . . 70
4.2.1 k-Nearest Neighbor Algorithm for RSSI-Based Localization . . 70
4.2.2 Articial Neural Network for RSSI-Based Localization . . . . 72
4.2.3 Particle Filter for RSSI-Based Localization . . . 74
4.2.3.1 Parameter Tuning for the Particle Filter . . . 75
4.2.3.2 The Particle Filter Delay . . . 76
4.3 Comparison of the Three Algorithms . . . 78
5 Conclusion 82
List of Figures
1.2.1 Multipath propagation eect on RSSI . . . 12
2.1.1 Two path RF propagation between a mobile transmitter (TX) and a xed receiver (RX). . . 18
2.1.2 The plot shows RSSI as a function of distance for model in Figure 2.1.1. Two dierent frequencies are used. . . 20
2.2.1 Sub-gure (a) illustrates free localization and (b) illustrates range-based localization. . . 23
2.3.1 Sub-gure (a) has a single point of interception, (b) and (c) do not. . . 25
2.3.2 Outline of current wireless based positioning systems [109] . . . 27
2.5.1 Graph (a) shows RSSI as a function of distance for multiple communica-tion channels. Graph (b) shows the data in graph (a) averaged over all channels. . . 33
2.5.2 A diagram showing how Fink's et al. devices communicate to each other. 34 2.5.3 An illustration of the radio interferometric ranging technique. . . 35
3.1.1 Voronoi diagram . . . 40
3.2.1 Interconnected human neurons [31] . . . 43
3.2.2 The articial neuron . . . 44
3.2.4 A three-layer feed-forward perceptron neural network . . . 46
3.3.1 Particles approximate a non-Gaussian distribution . . . 51
4.1.1 The TI's ez430-Chronos smart watch and Angelos Ambient . . . 60
4.1.2 The smart space was used to conduct the experiment. . . 60
4.1.3 Basic room layout for RSSI data collection . . . 61
4.1.4 RSSI versus distance for line-of-sight between the anchor and watch . . 62
4.1.5 RSSI versus distance for dierent sampling resolutions . . . 63
4.1.6 Visual representation of the channels listed in Table 4.1 . . . 65
4.1.7 Pearson correlation coecient between channels 1, 116, and 251 with all other channels . . . 66
4.1.8 RSSI heat-maps for the rst six channels . . . 68
4.1.9 RSSI heat-maps for the last four channels . . . 69
4.1.10Testing dataset . . . 70
4.2.1kNN performance as a function of the neighbors used . . . 71
4.2.2 ANN performance as a function of the hidden layer size . . . 73
4.2.3 Three dimensional interpolated heat map . . . 74
4.2.4 PF performance as a function of the number of particles used . . . 76
4.2.5 PF performance as a function of the measurement SD . . . 77
4.2.6 PF performance as a function of an output oset . . . 78
List of Tables
1.1 Technologies used for indoor localization [109] . . . 10 4.1 List of channels used during the data collection stage . . . 65 4.2 Accuracy of indoor localization systems. . . 81
Chapter 1
Introduction to Localization Methods
Since the dawn of civilization, humans have been localizing localizing things with hand-drawn maps, localizing each other with smoke signals, and localizing themselves across the sea, guided by the stars in the sky. Localization is the process of nding the position or location of a specic target based on some observable phenomena. People use localization for a glut of applications: localizing soldiers in combat, collecting marketing data, tracking endangered turtles, navigating self-driving cars, and even tracking battery packs on the international space station.
The most popular technology used for outdoor localization is the global position-ing system (GPS). GPS is a space-based navigation system rst implemented in 1973 that uses 31 satellites in orbit to provide location and time information in all weather conditions across the globe. A GPS receiver listens for time-stamped signals trans-mitted from the GPS satellites to compute propagation delay, then solves a set of equations using the computed distances to determine its physical location on earth. This is known as time-of-arrival (TOA) based localization.
GPS is freely available to anyone with a GPS receiver to use anywhere on or near the Earth. Receivers are now commonly found in cars, airplanes, ships, and smart-phones. In addition to its initial military purpose, GPS-enabled devices have been used in many applications including physical activity tracking [49], transportation and logistics [57, 99], and rehabilitating patients with GPS-enabled wearable sensors [89]. Although GPS is a reliable outdoor localization technology, it suers from dramatic performance degradation indoors because the microwave radio signals used by GPS are greatly attenuated by walls and ceilings [101]. Indoor GPS technology exists, but this technology is extremely expensive due to signicant processing requirements [28]. For these reasons, indoor localization remains an active research eld and a reliable low-cost indoor localization solution still eludes the research community.
1.1 Indoor Localization Methods
The ve most common indoor localization methods are acoustic, inertial/mechanical, laser, computer vision, and radio frequency (RF) [74, 109]. RF methods include timing-based, angle-of-arrival, and received signal strength indication (RSSI).
1.1.1 Active Versus Passive Systems
Active and passive systems must rst be dened before delving into further discussion on localization systems. A localization systems typically includes a target, i.e., the object to be localized, anchors which are transceivers placed in the environment with known xed locations, a localization algorithm which makes locations estimate based on data from the target and anchors, and a performance metric to measure the system's prediction error. The terms passive and active refer to system characteristics that are dened with respect to the target. In active systems, the target device
is actively transmitting a signal that allows the system (composed of anchors) to determine the target's location. In passive systems, the target listens for signals and determines its own location.
1.1.2 Acoustic Methods
Acoustic-based localization systems typically use electrical devices that either trans-mit or receive sonic waves, mechanical vibrations transtrans-mitted over a solid, liquid, or gaseous medium [109]. Systems can indirectly determine the distance between com-municating devices by computing the distance traveled by the sonic wave by record-ing the time of transmission and takrecord-ing into account the speed of sound. The most popular acoustic methods are ultrasonic-based localization systems which use waves typically above 20 kHz. Examples of ultrasonic systems include the Massachusetts In-stitute of Technology's (MIT) Cricket system and Cambridge University's Bat system [44]. In a passive conguration, MIT's Cricket system employs anchors distributed throughout a building that periodically transmit ultrasonic pulses. These pulses are received by a mobile target that then computes its own location using trilateration. Cambridge's Bat system is an active system where users wear small badges emit-ting ultrasonic pulses. The network of anchors then computes the 3D position of the badges through multilateration. These ultrasonic-based localization active sys-tems are typically able to achieve sub-meter accuracy in an indoor environment under certain conditions [106].
An ultrasonic-based localization system must have direct line-of-sight between the anchors and mobile targets to avoid erroneous distance estimates due to computing distances for non line-of-sight paths. Furniture can cause such obstructions in an indoor environment. Sometimes anchors are placed on the ceiling of a room to help
eliminate obstructions from furniture or other objects. Also, depending on the sys-tem, the anchor and mobile target orientation is important. In the Cricket syssys-tem, ultrasonic transducers on the mobile targets must point in the general vicinity of the anchor transducers. This becomes an issue when tracking a human because the per-son may not always hold or wear the mobile transmitter/receiver in a position that meets these ideal conditions. Another contributing factor to localization error is the variation in the speed of sound for sonic wave propagation in air due to environmental changes such as temperature, humidity, and atmospheric pressure [48, 58], because the systems are dependent on the speed of sound to calculate the distance. Because of this, sonic wave-based systems cannot localize well in environments with frequent and drastic changes in temperature, humidity, and atmospheric pressure [109] unless the system includes these factors in its prediction model and uses additional sensors to measure them.
1.1.3 Inertial/Mechanical Methods
Inertial/Mechanical technologies can measure the mechanical movement energy that is exerted on to them [109]. Systems can measure the energy of the direct application of force on such technologies. For example, Orr et al. [85] have used metallic plates with load cells in a project called Smart Floor where the plates were laid on the ground and used to identify a person walking over them. Orr et al. performed tracking by recording every instance that a person walked over the plates at dierent locations. In addition to localization, researchers have used pressure sensing oor plates for fall detection of the elderly [6].
Another approach to measuring mechanical movement energy is via inertial sen-sors, typically accelerometers and gyroscopes. Thanks to advancements in
microelec-tromechanical systems technology, small surface-mount sensor packages are commonly found in phones, smartwatches, and other mobile devices. But, because inertial sen-sors only yield relative positioning information and they produce noisy measurements due to inherent drift and measurement quantization, they are usually part of a hy-brid localization system. Hyhy-brid systems combine dierent technologies so that an additional source of position information serves as an absolute reference. Algorithms like the Kalman lters and particle lters [58] then use data fusion to make location estimates by integrating the information from these various sources. For example, activity data captured by accelerometer sensors has rened localization data from an RF-based system in [34, 80].
The primary issue with inertial sensors is the presence of a bias oset added to the measured signal causing a drift in the sensor's relative position information. Even in the absence of any input (including gravitational pull), inertial sensors output a non-zero value. This oset is dependent on time, temperature, and stochastic factors that occurs due to inherent mechanical properties of the sensor. These factors cannot be eliminated due to current limitations in manufacturing processes [39].
1.1.4 Photonic Methods
Photonic methods capture electromagnetic waves at a frequency within or near the human visible spectrum. Photonic energy refers to the energy carried by the elec-tromagnetic radiation within visible light or the nearby ultraviolet and infrared (IR) spectra [109]. Several methods capture photonic energy and use it for localization, including laser range nders and cameras.
Laser range nders emit concentrated beams of light and sense the reection that comes o of a wall or object to infer distance. There exist various techniques to infer
distance from beam reection measurements including phase-shift conversion [92], where laser systems modulate the emitted beam with either a square or sinusoidal waveform to be compared with the reected wave which will have some small phase shift due to the time delay of the light beam propagation. The systems then associate the phase shift with a certain distance by considering the speed of light. High-end laser range nders like the Hokuyo UTM-30LX use this technique to yield up to one centimeter of accuracy indoors [47]. Similar laser systems have been used for simultaneous localization and mapping (SLAM) in robotic navigation [88, 104]. The systems provide ne grain localization and appear to be the best t for active indoor localization, but the hardware involved is bulky, extremely expensive, and requires considerable data processing.
A popular passive photonic indoor localization method uses computer vision through mobile or xed camera systems. High quality digital cameras have become ubiquitous thanks to advancements in camera technology and smart phones. Researchers have used mobile camera systems for SLAM assisted robotic navigation [3], user localiza-tion with the use of a cell phone camera [98], and self localizing smart backpacks for indoor environments [72]. There are typically two stages for localization with a mobile camera: an oine stage where the system collects visual features of the environment, such as structural features of the building or ducial markers, and an online stage where algorithms use these features as a reference to compute location. Fixed camera systems take a dierent approach. They are usually mounted in the environment looking over an area. These camera systems can use feature extraction techniques (such as facial recognition) to provide localization and tracking solutions for security monitoring and surveillance [91].
The primary issues associated with camera based systems are that computer vision algorithms require high processing demands, a large storage capacity is needed to store
images or video, and cameras are often considered an invasion of privacy when used for human tracking or localization.
1.1.5 Radio Frequency Methods
Indoor radio frequency (RF) localization methods estimate the location of a mobile target by measuring one or more properties of RF signals [109]. These methods typically rely on either timing measurements, angle-of-arrival (AOA), or radio signal strength indication (RSSI) [105]. Unlike GPS that uses long range satellites, indoor RF systems typically use short range local anchors that can be deployed indoors. 1.1.5.1 Radio Frequency Timing Methods
RF timing methods use measurements of the propagation delay of RF waves traveling through a medium between two communicating devices. In air, RF waves travel at the speed of light, i.e., three hundred million meters per second. Because of this, tim-ing methods require expensive and complicated hardware for high timtim-ing resolution down to 0.5 nanoseconds to measure the travel time of an RF wave for half a foot of resolution [46]. Localization methods using RF timing use several such measurements to compute 2-D or 3-D positions with techniques like trilateration. In practice, these methods have inherent diculties because precise clock synchronization across multi-ple devices is a major issue [112]. RF timing based systems are mainly distinguishable by their constraints on clock synchronization.
Three popular timing based systems are time-of-arrival (TOA), time-dierence-of-arrival (TDOA), and roundtrip time-of-ight (RTOF) [68]. In active TOA based systems, TOA is a time measurement of the one-way propagation delay between the mobile target and the anchors. This requires precise time synchronization between
the mobile target and all of the anchors, below 1 nanosecond for indoor localization accuracy in the decimeter range. Active TDOA based systems use the TDOA of received signals for localization. Here, TDOA is the dierence in the times at which the signal arrives at multiple anchors, unlike the absolute arrival time of TOA [119]. The benet of this is that only the anchors in the TDOA based systems require syn-chronization amongst each other. Systems can replace the absolute synsyn-chronization constraint with a less precise constraint than that of a RTOF based Systems [112]. Here, the mobile target transmits a signal then waits for the anchors to transmit it back to complete the roundtrip propagation delay measurement. The synchroniza-tion challenge for RTOF based systems is that the mobile target must know the exact delay needed for the anchors to resend the packet. Even a delay oset of 1 millisecond can correspond to measurement deviations of several meters for some systems. 1.1.5.2 Radio Frequency Angle-of-Arrival
Angle-of-arrival refers to the angle between the received signal of an incident wave and some reference direction [62]. The most common approach to identify the angular direction of the signal is through antenna diversity. Typically, antenna arrays on the receiving devices are used to determine the AOA for AOA-based localization systems. Once the AOA is measured, AOA-based localization systems use various localization methods like triangulation to identify the location of the target by solving a system of direct equations for intersecting lines [71].
1.1.5.3 Radio Signal Strength Indication
Radio signal strength indication is the distance dependent measurement of a received signal's power. RSSI presents itself at the front end of a receiver to determine ampli-cation levels needed for demodulation. Typically RSSI is measured in dBm, which
is ten times the base ten logarithm of the ratio between the power at the receiving end and the reference power [87]. Most radios oftentimes provide RSSI because it is directly related to the performance of communication schemes: low RSSI corresponds to poor wireless communication due to high bit-error-rate during the demodulation process.
The availability of RSSI measurements on most o-the-shelf radios helps stimulate the interest in designing RSSI-based ranging techniques [13, 73]. In an active system, local devices deployed in a room or building measure RSSI. Popular wireless network platforms used in RSSI-based systems include WiFi [96, 110], Bluetooth [12, 97, 107], and ZigBee [93].
TOA and AOA based systems typically achieve higher localization accuracy than RSSI-based systems. However, the amount of achievable accuracy also correlates with the hardware complexity and device cost [90]. AOA systems require multiple anten-nas that increases the size of the device [90]. TOA-based systems require high speed signal processing and have high device costs with high energy consumption [77, 119]. In contrast, RSSI-based ranging techniques are low cost because oftentimes they do not require additional hardware and they possess small computational requirements that do not burden the on board circuitry [73]. Additionally, RSSI-based localization systems are especially desirable because they are already available on most o-the-shelf commercial radios. For these reasons, people use RSSI-based systems for many applications including navigation assisted tours, behavioral monitoring, studying the spread of hospital related infections, tracking basketball players, navigation for un-derground mining, and localizing people and equipment for construction job-sites [22, 33, 50, 74, 93, 110].
Table 1.1 displays a summary of advantages and disadvantages for the aforemen-tioned methods.
Technology Advantages Disadvantages
Ultrasonic Sub-meter localization.
External synchronization. Speed of sound variations are dependent on temperature and other environmental conditions. Inertial/Mechanical Self-contained. Resilient to environmental conditions. Inherent sensor drlocalization. Requirement of ift. Relative
initiation and calibration. Laser Location accuracy of about 3 cm. Extremely expensive. High processing requirements
Computer Vision orientaHigh localiztion accuracy.ation and
High processing requirements. Dependent on illumination conditions and environmental noise. Sensitive to obstructions
and reflections. RF Timing Methods Sub-meter localization. Expensive hardware required for precise synchronization.
High processing requirements RF Angle-of-Arrival Meter localization. High processing requirements. Radio Signal Strength
Indication Usage of readily deployed equipment; reduced cost.
Coarse localization. Sensitive to interference, signal propagation
effects, and dynamic environmental change.
Table 1.1: Technologies used for indoor localization [109]
1.2 Factors Aecting RSSI-Based Systems
All radio frequency waves undergo attenuation when they propagate through a medium. Propagation in air results in path-loss, or reduction in power density, for electromag-netic waves that is proportional to the distance traveled. In an active RSSI-based localization system, this decrease also limits the transmission range of the mobile tar-get. RSSI-based systems rely on the distance dependent attenuation nature of RSSI to provide range information. The distance dependent line-of-sight path-loss model
in air, or free space, is given by
RSSI(d) =RSSI0−10nplog d d0
,
where dis the distance between the devices, RSSI0 is the RSSI measured at the
ref-erence distanced0, and np is the path-loss exponent. Using this path-loss model, one
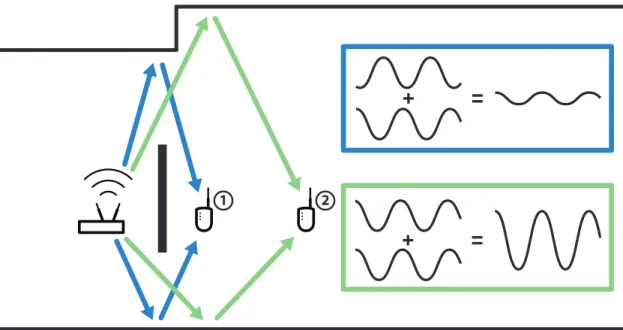
can compute the distance between a transmitter and receiver if the RSSI is known. An active localization system that collects three RSSI measurements from three anchors could theoretically compute the 3-dimensional location coordinates for the mobile tar-get using trilateration. Unfortunately there are various natural phenomena that alter the path-loss model including RF wave reection and scattering. These phenomena result in multiple copies of the signal being received at each anchor, otherwise widely known as multipath propagation [4]. Multipath propagation causes rapid variations in the RSSI when communicating devices move short distances relative to each other due to constructive/destructive signal interference [43]. Multipath propagation is of-ten seen in indoor environments where moving a small distance drastically changes RSSI. Figure 1.2.1 illustrates how moving an anchor from one location, labeled with the number one, to another location, labeled with the number two, changes the sig-nal strength due to summing waves with dierent phases. The varying phases occur from signals traveling through multiple paths of dierent lengths. For the sake of simplication, the illustration shows two paths, one blue and one green, neither of which are non line-of-sight. In some cases where line-of-sight conditions cannot be met, line-of-sight systems will fail at localizing the target. These cases are commonly encountered indoors.
Other factors aecting RSSI and contributing to localization error include antenna orientation and ambient temperature. If the radiation patterns for the antennas used
2 1
Figure 1.2.1: Multipath propagation eect on RSSI
in the system are not omnidirectional, which is often the case, then the orientation of the antenna will aect RSSI measurements [81]. Additionally, it has been observed that ambient temperature inuences hardware performance in WSNs, resulting in altered RSSI measurements [17]. In particular, temperature changes can cause a shift of crystal frequency, increased thermal noise of the transceiver, and saturated ampliers.
1.2.1 Multichannel RSSI-Based Localization for Multipath
Eect Mitigation
One approach to improve localization accuracy for RSSI-based systems is to simulta-neously measure RSSI data for dierent frequencies. The RSSI measured at a single location is aected by destructive or constructive interference from the superposition of RF waves from multipath propagation. When waves travel through multiple paths and meet at a single point, they will sum with varying attenuations and phases. The
phases are frequency dependent, so varying the frequency will vary the observed RSSI for that single point. In complex indoor environments, this phenomenon is virtually unpredictable and too complicated to model. Thus, researchers often modify the path-loss model of RSSI in multipath environments as
RSSI(d) =RSSI0−10nplog d d0
+Xσ,
where Xσ is a random variable representing the erratic behavior of RSSI due to
multipath propagation [13]. The random variable Xσ is assumed to have a Gaussian
distribution with zero mean. In an attempt to eliminate the eect of this random vari-able Xσ, various measurements can be recorded on multiple communication channels
and averaged. In this model, averaging mitigates the eect of multipath propagation on the RSSI. Various groups have shown that multichannel frequency averaging im-proves RSSI-based localization results [5, 13, 18, 66, 93]. Frequency averaging is just one of many frequency diversity methods.
1.2.2 Fingerprinting in RSSI-Based Localization
Fingerprinting is a technique of machine leaning that evolved from the study of pat-tern recognition and computational learning theory in articial intelligence [37]. Ma-chine learning explores the study and construction of algorithms that can learn from and make predictions on data [35]. In RSSI-based localization, ngerprinting algo-rithms infer location information of RF devices based on previously collected RSSI measurements. There are several reasons why people use ngerprinting algorithms in RSSI-based localization systems [11, 54, 86]. First, they can provide a solution to localization problems where traditional methods fail to deal with multipath propa-gation. Second, it is relatively easy to obtain an RSSI dataset that can be used by
the ngerprinting algorithms. Third, low complexity ngerprinting algorithms like
k-nearest neighbor perform well in practice [18].
Fingerprinting can prove advantageous when used with multichannel data. These techniques are able to treat input RSSI data separately, rather than simply averag-ing values. This is the motivation behind usaverag-ing ngerprintaverag-ing is this work. RSSI ngerprinting is well documented in the subsequent chapters.
1.3 Problem Statement
RSSI-based localization systems are good candidates for indoor environments be-cause they are low cost and do not require additional hardware. The disadvantage of using RSSI-based systems are the diculties associated with unpredictable position-dependent RSSI measurements caused by multipath propagation. Traditional ap-proaches [5, 13, 18, 66, 93] attempt to mitigate multipath propagation eects to improve localization accuracy through frequency averaging where RSSI is recorded over multiple communication channels and averaged for each position to approximate the RSSI of an environment without multipath propagation.
Unlike traditional methods that attempt to mitigate multipath propagation ef-fects, here multipath propagation is used to advantage by creating a multichannel ngerprint of the environment. By sampling at a high enough spatial resolution, the system captures variations in the position-dependent RSSI. Since RSSI is fre-quency dependent in the indoor environment, the ngerprints will also be dierent for each frequency. It is hypothesized that capturing ngerprints of multiple frequen-cies will provide more information regarding the mobile target's location, which can be exploited to mitigate localization errors that aect single-frequency ngerprinting methods through frequency diversity.
This work uses three distinct algorithms to show that 2-dimensional localization accuracy is improved when using multiple frequencies for ngerprinting. The three methods are thek-nearest neighbor algorithm due to its low complexity, the
state-of-the-art neural network as it is a method of choice in modern research [35], and the particle lter because it introduces a temporal component and allows for a problem denition using state-space and sampling of hypothesized error distributions. This work tests the algorithms on real RSSI data collected from a custom wireless sensor network using a single target and anchor. The results demonstrate that performance increases for all three algorithms as the number of frequencies is increased. The comparison determines which algorithm works best for indoor localization.
Chapter 2
Review of RSSI-Based Localization
Methods
People have been researching and developing RSSI-based localization methods for two decades. The ability to measure RSSI with o-the-shelf radios and its associated low cost makes the technique desirable. This chapter serves as an introduction to various RSSI-based localization methods; it presents current work in the eld while illustrating the most prominent challenges for this type of system. First, multipath propagation, the most prominent challenge in RSSI-based localization, is explained. Second, terminology for RSSI-based localization, is introduced. This includes a dis-cussion on popular RSSI-based localization methods. Finally, the chapter concludes with a discussion of frequency diversity for error mitigation in RSSI-based localiza-tion.
2.1 The Multipath Propagation Model
Multipath propagation is a natural phenomenon of RF wave propagation that occurs when a transmitted RF signal reects from objects in an environment and arrives at a destination via multiple paths. The reections can originate from furniture, walls, people and other objects in an environment. From a receiver's point of view, the received signal is the superposition of all the signals traveling via the multiple paths [95]. Each signal varies in amplitude and phase depending on the distance traveled and number of reections. The superposition of the multiple signals may result in constructive or destructive interference.
Multipath propagation is especially apparent indoors and dicult to model due to the presence of objects and furniture in the room. Additionally, varying room shape and size creates various unpredictable signal propagation paths. Other factors such as absorption coecients and scattering eects add more complexity to the model. Bardella et al. [13] state that an extremely accurate channel model would require perfect knowledge of the environment, and further mentions that such a model would lack generality and reusability. For this reason, it is not practical to create a complete model of multipath propagation experienced in a RSSI-based localization systems to mitigate the localization error.
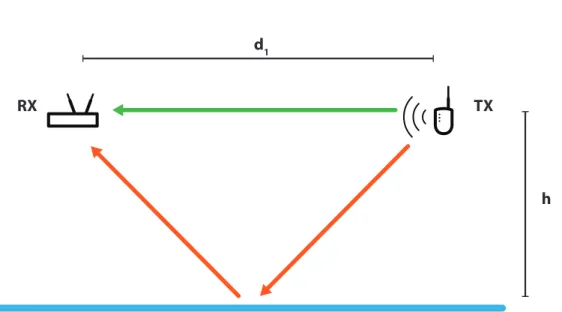
To better understand multipath propagation, consider the case where a receiver (RX) and transmitter (TX) are placed in the same environment at the same height as shown in Figure 2.1.1. In an active system, the mobile target is the transmitter and the anchor is the receiver. The mobile target is continuously sending a signal with a xed frequency and amplitude, while the anchor receives the signal and makes an RSSI measurement. The anchor is set to a xed location but the mobile target moves freely to or from the anchor while maintaining the same height. Now assume
h TX
d1 RX
Figure 2.1.1: Two path RF propagation between a mobile transmitter (TX) and a xed receiver (RX).
there are no walls or objects in the environment, so the ground is the only source of reection.
The RSSI of the signal at the anchor is a function of the distance,d, between the
anchor and mobile target. The average power of a sinusoid is given by
P = 1 T0 T0/2 −T0/2 (Asin(2πf0t))2dt= A2 2 ,
where A is the amplitude of the signal and f0 is the frequency. In the case of Figure
2.1.1, the signal at the anchor is the sum of two signals, one from the direct line-of-sight path and the other from the ground reection path. Thus, the received signal may be written as
r(t) =Aαsin(2πf0t+φα) +Aβsin(2πf0t+φβ),
where Aα and φα are the amplitude and phase delay of the line-of-sight signal, and Aβ and φβ are the amplitude and phase delay of the ground reection. This may be
rewritten as
r(t) =p[Aαcos(φα) +Aβcos(φβ)]2+ [Aαsin(φα) +Aβsin(φβ)]2
×sin2πf0t+ tan−1 hA αsin(φα)+Aβsin(φβ) Aαcos(φα)+Aβcos(φβ) i .
RSSI is only a function of the amplitude,
Ar=
q
[Aαcos(φα) +Aβcos(φβ)]2+ [Aαsin(φα) +Aβsin(φβ)]2. (2.1.1)
To compute this, the values of Aα , Aβ , φα , and φβ are needed, and they can be
derived from Figure 2.1.1. The amplitudes are given by
Aα =d( −n) 1 and Aβ =d (−n) 2 ,
where n is the distance power law exponent, d1 is the line-of-sight distance between
the mobile target and anchor, and d2 is the total distance of the ground reected
signal path. The distance d1 is known, but we must compute d2 from d1 and the
height h of the devices as
d2 = 2× r
h2+ (d1) 2
4 .
The phase delays φα and φβ are given by φα =
2πd1
Distance (meters) 1 2 3 4 5 6 7 RSSI (dBm) -100 -90 -80 -70 -60 -50 -40 no reflections 620 MHz w/ one reflection 1.33 GHz w/ one reflection
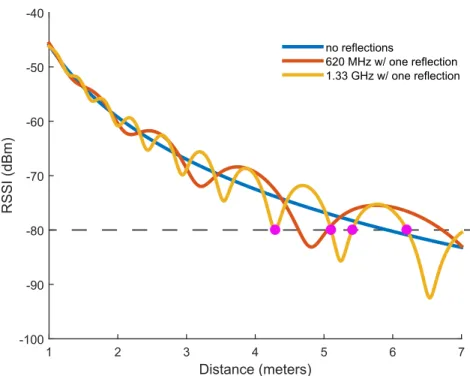
Figure 2.1.2: The plot shows RSSI as a function of distance for model in Figure 2.1.1. Two dierent frequencies are used.
and
φβ =
2πd2
λ0
,
where λ0 is the wavelength of the signal with frequency f0. Equation 2.1.1 can now
be used to compute the RSSI as a function of the distance d1 and height h. Figure
2.1.2 shows the RSSI for three dierent cases. The rst case, shown in blue, is the RSSI without a ground reection. The two other cases shown in orange and yellow show the RSSI for f0 equal to 620 MHz and 1.33 GHz, respectively.
Figure 2.1.2 shows that constructive and destructive interference creates local extrema at certain distances. Furthermore, it is important to observe that the occur-rence of local extrema correlates with the operating frequency of the mobile target and its distance. As the frequency increases, so does the occurrence of extrema. At higher frequencies, the occurrence of the extrema is considerably higher, such that moving a
small distance rapidly changes the measured RSSI. This is the fast fading eect. This is why fast fading is more prevalent in Wi-Fi enabled devices operating at 2.4 GHz than in devices operating in the 918MHz ISM band. If one samples RSSI as a function of distance with a high enough spatial resolution, one could capture the occurrence of most extrema. This captures necessary information of RSSI as a function of distance to make the process of interpolating measurements easier for any given position. It should be noted that, regardless of frequency, RSSI generally decreases with increas-ing distance due to the path-loss model with no reections. In a real environment, walls and objects create multiple reected signals contributing to the signal seen at the receiver. Researchers usually add a random component to the path-loss model to take into account the unpredictability of reections [13, 73, 90, 108, 111, 117].
Multipath propagation introduces error in an RSSI-based localization method's location estimate by adding an element of unpredictability. For example, let us assume from Figure 2.1.2 that the RF energy exponential decay model without reections (show by the blue line) is used to determine the location of the mobile transmitter. If the receiver determines an RSSI of -80 dBm for a received signal, then the transmitter is at a distance of six meters assuming both devices are present in a reection free environment. However, if the environment produced a ground reection and the signal was being transmitted at 1.33 GHz (as shown by the yellow line), the transmitter could be at four dierent distances: 4.3 m, 5.05 m, 5.45 m, and 6.25 m as indicated by the pink dots. The algorithm chooses one of them with a chance that it is the wrong location.
It must be noted that this example illustrates a simplied model of multipath propagation in the sense that there are only two paths. In a real indoor environ-ment, countless number of paths exist along side countless propagation factors that aect the observed RSSI at a receiver. Researchers commonly approach these
complicated problems with statistical methods, primarily using Rayleigh and Rician multipath propagation models [43] to represent a complicated channel envelope with Rayleigh and Rician distributions. Of the two, the Rayleigh model is the most pop-ular because it assumes that all paths are relatively equal. That is, that there is no dominant path. This diers from the Rician model where more weight is given to the line-of-sight path.
2.2 Terminology for RSSI-Based Localization
Methods
People have proposed a large variety of RSSI-based localization methods over the years. Bor et al. [18] note that, based on the dierent proposed taxonomies of localization techniques, there is a clear division between range-free and range-based localization. The dierence between the two categories lies in the initial steps of the methods. Range-based techniques use RSSI to estimate the distance between a device with known location and a device with unknown location. On the other hand, range-free techniques exploit connectivity information between anchors to determine constraints on the location of mobile target [4].
Range-free techniques gain a great deal of information when an anchor with known location receives a signal from a target device with unknown location. This indicates that the target, of which we wish to know the location, is within the connectivity region of the anchor. The connectivity region of the anchors is the entire area where they can establish communication with another device. It is not important for range-free techniques to determine the exact location of the target because some application may not need absolute localization, but rather to have a general estimate. Because of
d1 conectivity region true estimate d2 d3 (a) (b) A A T T A A A A
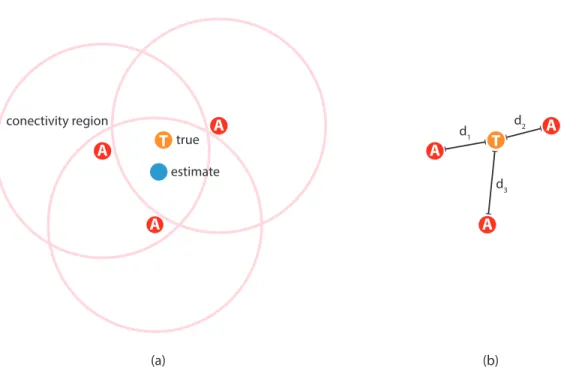
Figure 2.2.1: Sub-gure (a) illustrates free localization and (b) illustrates range-based localization.
this, people often choose to have low computational requirements and hardware cost at the expense of increased localization error. A simple range-free method is nearest neighbor location assignment, where the system chooses the location of the anchor that connects with the mobile target as the location estimate. This method benets from low computational power requirements and power consumption. In the case where multiple anchors are able to hear the target, the algorithm takes additional steps to improve localization. This includes averaging the location of all the anchors receiving the signal or averaging the overlapping connectivity regions [61] as shown in Figure 2.2.1(a). The anchors are labeled with the letter A and the target is labeled with the letter T.
Range-based localization takes a dierent approach. Rather than simply relying on whether a target was heard or not, range-based techniques begin by using RSSI to infer the distance between the target and each of the anchors as shown in Figure
2.2.1(b). Common range-based methods include trilateration, triangulation and ring localization [23, 107, 111].
2.3 Single Channel Range-Based Localization
Methods
2.3.1 Trilateration
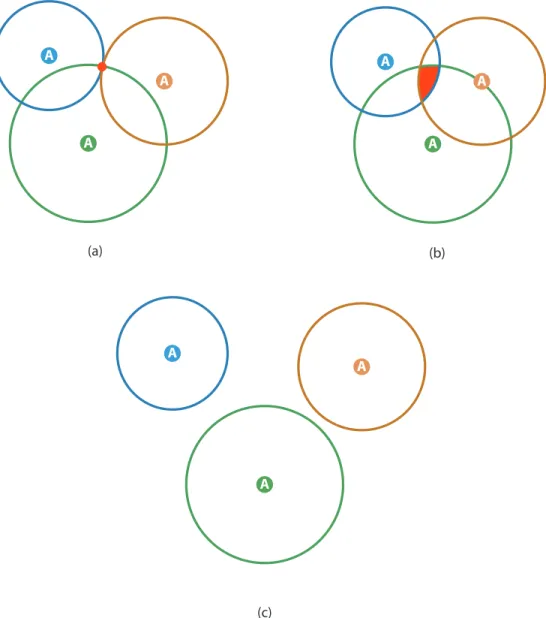
The most popular method in RSSI-based localization is trilateration. Trilateration is a classic method for determining the location of a point using the geometry of circles or spheres. RSSI-based trilateration localization methods use RSSI to compute the distance between three or more anchors with known locations and a single mobile target with unknown location. Trilateration draws circles that have radii equal to the computed distances around the three anchors. Ideally, the three circles all in-tersect at one point as shown in Figure 2.3.1(a). Calculating the inin-tersection of the circles provides the location of the target. Trilateration uses circles for 2-dimensional localization and spheres for 3-dimensional localization.
For indoor localization, there will almost never be a single point where all the circles intersect due to the seemingly noisy nature of RSSI caused by multipath prop-agation [118]. In some cases, as illustrated in Figure 2.3.1(b), multiple circles overlap causing uncertainty of the transmitter's location. In other instances, it may be that none of the circles intersect, as shown in Figure 2.3.1(c). The lack of a single point of intersection is the largest issue with trilateration for indoor environments. People spend much eort devising methods to solve this problem, including making articial intersections [111].
(a) (b) (c) A A A A A A A A A
How can acceptable location estimates be achieved with noisy input data? Priwgharm et al. [94] use the Max-min approach, which draws squares around the circles to cre-ate smaller overlapping boxes, even if the circles do not overlap. It then chooses the center of the overlapping area as the estimated location [67]. Thaljaoui et al. [107] use a method called iRingLA. iRingLA draws rings around all circles and deter-mines the ring thickness based on the RSSI noise in a particular environment. The algorithm then averages all points within the overlapping ring area to compute an es-timated location. The method by Wang et al. [113] uses intersecting areas of circles to form points of a polygon and averages the polygon point location coordinates to pro-vided an estimate. Researchers later improved this method into the popular weighted centroid localization (WCL) algorithm. The WCL algorithm improves accuracy by performing a weighted average on the polygon points where each polygon point is weighted by the RSSI measurements from the receivers. Liang et al. [70] use this approach for large scale WSN applications and Vari et al. [111] use WCL to investi-gate RSSI-based localization at the 60 GHz frequency range (IEEE 802.11ad). Others minimize and deal with noisy input data through least squares optimization which typically has higher computational requirements. The Gauss-Newton algorithm and the Lederberg-Marquette algorithm [16, 76] are examples of algorithms used for least squares optimization.
Overall, these single channel RSSI-based localization methods will have relatively large localization error. Liu et al. [71] composed a survey of wireless indoor position-ing methods which is simplied in Figure 2.3.2. They concluded that sposition-ingle channel RSSI methods can not achieve sub-meter accuracy. Because of this relatively large localization error, the research community continues to work towards nding other alternatives.
RSSI
RSSI
Figure 2.3.2: Outline of current wireless based positioning systems [109]
2.4 Fingerprinting for Single Channel RSSI
Pattern learning ngerprinting is a subcategory of range-based localization used for indoor environments [5]. People commonly use ngerprinting methods for RSSI-based localization [11, 54, 86]. It is relatively easy to distinguish ngerprinting from other methods because ngerprinting requires a calibration stage that creates a dataset by sampling RSSI from known locations, and stores them for later use. The idea is to capture a signature for every recorded position. In doing so, ngerprinting methods generally provide better localization results than other methods [19] at the expense of a separate calibration stage. Fingerprinting can require a great deal of time and eort to build the initial dataset, but by providing improved performance, they have captured the attention of researchers. The next section briey covers k-nearest
neighbor (kNN) and articial neural networks (ANN) in the context of RSSI-based
2.4.1
k
NN
The most popular ngerprinting algorithm is the nearest neighbor approach. In near-est neighbor, the algorithm compares RSSI measurements from the mobile target to measurements captured during calibration. The algorithm computes a distance metric between all the measurements in the calibration dataset and the RSSI measurements of the mobile target. It then chooses the location associated with the closest match-ing measurement in the dataset as the location estimate. Bahl et al. [11] have used this approach to develop service architectures of location-aware systems to locate and track mobile users.
Algorithm developers later improved the nearest neighbor algorithm into what is known as the kNN algorithm. The kNN algorithm nds the k closest matching
mea-surements in a dataset, where k is a specied integer, and averages the coordinates
to provide a location estimate [94]. Researchers further improved the algorithm by introducing weighted averaging during the location estimation stage [41]. Fang et al. [32] performs weighted averaging with weights that are dependent on kNN distance
criteria. In addition to weighted averaging, other methods have been combined with
kNN. Chi et al. [24] applies the WCL algorithm after kNN to improve indoor
local-ization for RSSI-based tracking of healthcare patients. Kasantikul et al. [56] use a particle lter after the kNN predictions which exploits a time dependent property of
the measurements to improve on localization accuracy.
The distance metric is the driving mechanism ofkNN; it directly determines which
measurements inuence the location estimate. The most common metric is Euclidean distance, but researchers use thekNN algorithm with various distance criteria
includ-ing city block, Mahalanobis, and Minkowski distances [45, 103]. Guowei et al. [41] use the Jerey-Matusita distance formula for indoor tracking in their version of thekNN.
Some variations of the kNN algorithm assume a particular data distribution to be
used as a distance metric based on the Gaussian isotropic distribution [7]. Yang et al. [116] assume a non-Gaussian distribution over their data to remove 3% of their least probable RSSI measurements. They then use weighted averaging that is dependent on the distance from the data distribution.
Fingerprinting with a kNN is a method to improve the localization error of
tradi-tional single channel localization methods. Additradi-tionally, there are other more intricate methods available to further improve localization, i.e., ngerprinting with an articial neural network.
2.4.2 ANN
Articial neural networks are algorithms whose inspiration comes from the biology of the human brain, neurons to be precise. Machine learning algorithm designers con-struct mathematical models that resemble the neural connections of a human brain working as an interconnected network [108]. Researchers have used these models in various ANN structures with dierent training algorithms for RSSI-based localization since the early 2000's [83] which they exploit for a variety of applications. For in-stance, ANN's have localized people within museums to assist in location-aware tour guide systems [110]. Battiti et al. [15] localized people within a university through a WLAN system that used a three layer feed-forward ANN trained with the one-step secant algorithm. They obtained an average localization error of 2 meters in their results. Others [10] obtained ne-grained localization (50 centimeter average localization error) to aid in indoor robotic navigation. They perform all tests in an indoor oce environment and trained their three layer feed-forward ANN with the Levenberg-Marquardt algorithm. Mehmood et al. [78] cascaded several ANNs using
the output of some ANNs as the inputs of other ANNs and trained all networks with genetic algorithms in order to localize a laptop within their university. Chuang et al. [25] improved localization results by providing hop count information as additional inputs and observed a 5 meter average location error during simulations. More re-cently, researchers used a feed-forward ANN trained with their own feature selection backpropagation articial immune system (FSBP-AIS) algorithm to track workers in a warehouse [60]. Their training algorithm performed better than traditional back-propagation algorithms due to that fact that their FSBP-AIS model does not tend to converge towards local minima.
More recently, the radial basis function neural network (RBFNN) structure has become more popular for indoor RSSI-based localization with ANNs; especially after 2012. RBFNNs are a special class of ANN where some layers consist of Gaussian kernels. A dierent class of training algorithms are used for these networks. Typically, training is divided into two stages: rst, the center and widths of the Gaussian kernels are determined and then the network learns all other parameters [108]. Carlson et al. [22] used a (RBFNN) on localization data to monitor the health of the elderly. Their model was trained using linear optimization and later their localization estimates were rened by using a Viterbi algorithm. Goa et al. [40] used the dierence of RSSI as additional inputs to their RBFNN which they trained with a fuzzy clustering algorithm. Others combined the RBFNN and Particle lter to improve localization results [82]. Their RBFNN provided a real-time location estimate and the particle lter was used to predict the next location.
In summary, single channel RSSI-based localization is going to be problematic due to localization error coming from multipath propagation. Fingerprinting with the ANN and kNN can help address this issue, but even though using these methods
a relatively large localization error.
2.5 Multichannel RSSI Methods
As discussed in section 1.2.1, a commonly used indoor line-of-sight path-loss model is
RSSI(d) =RSSI0−10nplog d d0
+Xσ, (2.5.1)
where the random variable Xσ represents the erratic behavior of RSSI due to
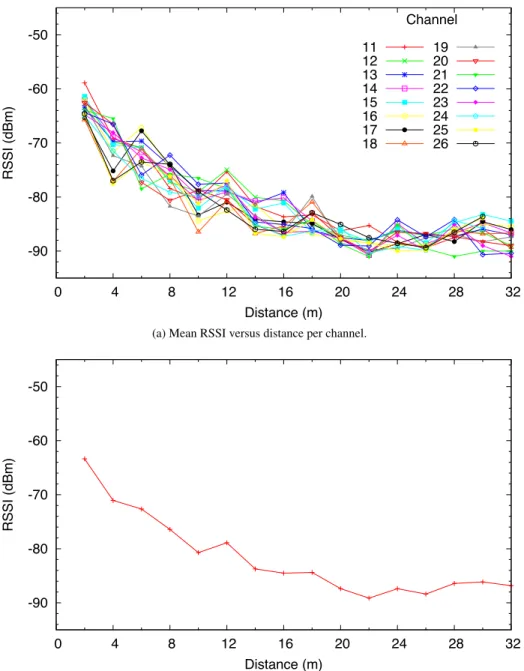
multi-path propagation. Bor et al. [18] recorded RSSI on 16 dierent channels for IEEE 802.11 compliant devices transmitting at various distances and their data is consis-tent with the path-loss model of equation 2.5.1. Their data, shown in Figure 2.5.1(a), shows that the RSSI drastically changes over increments as small as two feet. This graph also shows that RSSI is dierent for the same location when measured on dierent channels.
The RSSI for a single channel varies rapidly over small distances, but if all the measurements for a given location are averaged over all the channels, the results approximate the path-loss model without the random component. Figure 2.5.1(b) shows the results when the measurements in Figure 2.5.1(a) are averaged over all channels for each location. Doing this mitigates multipath propagation eects [115]. Because of this, many researchers apply channel averaging to improve localization accuracy in RSSI-based systems. Many other frequency diversity methods do exist, but frequency averaging is the most popular. Bardella et al. [13] use IEEE 802.15.4 compliant devices operating at 2.4 GHz to measure RSSI from the 16 dened channels. They show that localization accuracy is improved by averaging measurements that are collected on dierent channels. Using the same standard, Ladha et al. [66] were
able to signicantly reduce the average root mean squared error for estimating a device's location within an oce environment. Pricone et al. [93] used a system that averaged RSSI over four channels to locate basketball players in a gym. They used Memsic IRIS anchors operating in the 2.4 GHz ISM band with their own TDMA communication protocol designed for channel hopping.
2.5.1 Other Multi-Frequency Approaches
Although RSSI averaging is the most popular method for improving localization re-sults when using multi-frequency data, other methods exist. Fink et al. [33] use the weighted centroid localization (WCL) algorithm without averaging data from mul-tiple channels with stationary nodes transmitting at two frequencies. The dynamic sensors, or target sensors to be located which are referred to as BN, have two antennas placed in dierent locations of the board, one for each frequency. They use a total of four antennas for each target sensor. By doing so they achieve frequency diversity and spatial diversity at the same time. Figure 2.5.2 shows the transmitting (BN) and receiving (RN) devices communicating to each other. They are able to obtain four dierent RSSI measurements, each with a dierent frequency and spatial oset for the same sensor location. Their algorithm starts by converting received RSSI mea-surements into weights for each RN. Then, an adaptive WCL algorithm estimates the sensor location by using a modied weighted average approach. To improve accuracy, Fink et al. also uses a plausibility lter where movement restriction is enforced. This limits the maximum distance that a BN may travel during the prediction stage and thus lowers error from predicting unrealistic movement by imposing a maximum ve-locity that a BN can travel. Fink et al. improves upon his method in later work by rening localization results through data fusion [34]. A six axis inertial measurement
5.4. Proximity 19 -90 -80 -70 -60 -50 0 4 8 12 16 20 24 28 32 RSSI (dBm) Distance (m) Channel 11 12 13 14 15 16 17 18 19 20 21 22 23 24 25 26
(a) Mean RSSI versus distance per channel.
-90 -80 -70 -60 -50 0 4 8 12 16 20 24 28 32 RSSI (dBm) Distance (m)
(b) Mean RSSI versus distance over all channels.
Figure 5.1: Multiple frequencies experimental results.
in a one-dimensional setup, where all nodes lie on one line. As a test case we use proximity localization. The idea of proximity localization is quite simple: the position of the node is the position of the strongest anchor.
5.4.1 Experimental Setup
For this experiment we used the 8 Tmote Sky nodes of the testbed as anchors. There is one mobile node that transmitted beacons with maximum power at a regular inter-val on increasing frequency. The mobile node is placed, preferably on a desk, in 6
Figure 2.5.1: Graph (a) shows RSSI as a function of distance for multiple communi-cation channels. Graph (b) shows the data in graph (a) averaged over all channels.
BN BN RN C2 f1 f2 f1 f2 f1 f2 C4 C1 C3 RN f1 f1
Figure 2.5.2: A diagram showing how Fink's et al. devices communicate to each other.
unit (IMU) provides an additional location prediction method through the use of a Kalman lter. A nal lter combines the prediction from the two methods, one from WCL and another from the Kalman method, to provide an updated estimate. These methods may oer an alternative to channel averaging based localization, but their systems add additional hardware to the system which increases the complexity and drives up cost.
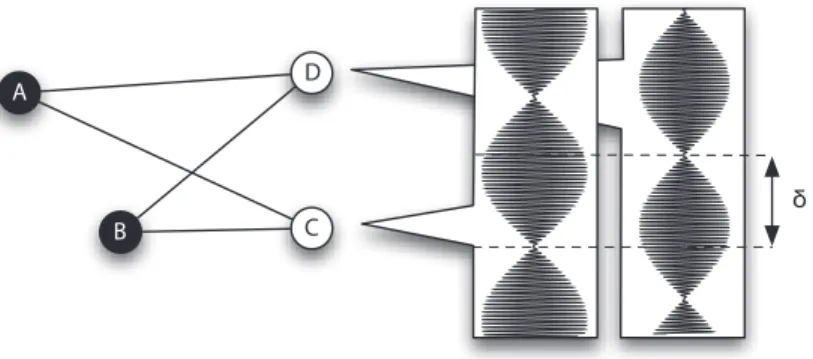
Another method of localizing a target while operating on multiple frequencies is radio interferometric positioning system (RIPS). Localization by RIPS is achieved by transmitting two RF signals with slightly dierent frequencies. The composite signal at the receiver's side will have a low frequency envelope such that neighboring devices can measure its power with less expensive hardware than that of measuring time-of-arrival. Figure 2.5.3 displays the computation of the phase osetδbetween C
and D used to compute an AOA measurement. The method then infers location from AOA measurements with a variety o-the-shelf algorithms. Maroti et al. [75] rst introduced RIPS for 3D positioning of wireless sensor networks. They later improved their method through various developments [63, 64, 65]. It is worth noting that RIPS is not indoor localization method and was only presented because it uses multiple
D
C B
A
Figure 2.5.3: An illustration of the radio interferometric ranging technique. frequencies in it's localization scheme. Neither does it use RSSI. This work looks to use RSSI for localization because it relatively easy to have access too. Even if RIPS was deployable indoors, the complexity of the system would drive up the cost.
2.5.2 Fingerprinting with Multichannel Data
In one instance, found in the work of Bor et al. [18], a machine learning algorithm uses multiple frequencies for indoor localization where a nearest neighbor algorithm was used along side RSSI ngerprinting. During a training stage, Bor et al. collected RSSI data in an oce environment for dierent locations to create a dataset that would later be used as a look-up table. The nearest neighbor algorithm searches the dataset to nd the closest matching data point with a new and unknown RSSI measurement during the prediction stage. The location of the closest matching data point is then the predicted location. Additionally, the simple algorithm's prediction accuracy increases when averaging measurements over multiple channels. This method does not allow for ne grain localization but it works well for room level localization. What Bor et al. learned with these results is that ngerprinting with a nearest neighbor algorithm can improve localization error. If this simple method can improve results, then it would be expected that more complicated algorithms like the kNN can surpass its
performance.
2.6 Summary
The presented literature shows that multichannel RSSI can help mitigate localization error. This is benecial because it is relatively easy to measure RSSI from multiple channels. Currently, most work on multichannel localization averages multichannel RSSI. Instead of using channel averaging, this work focuses on treating multichan-nel RSSI separately and combining multichanmultichan-nel ngerprinting with algorithms that includek-nearest neighbor and articial neural networks.
Chapter 3
Fingerprinting Methods for
Localization
This chapter introduces ngerprinting methods that use frequency diversity to miti-gate localization error. As stated in Chapter 1, the hypothesis is that a multichannel RSSI ngerprint of the environment is capable of providing more information re-garding a mobile target's location than a single RSSI measurement. To test this hypothesis, the performance of various ngerprinting algorithms are evaluated based on their ability to estimate the mobile target's location.
This chapter introduces three methods for RSSI ngerprinting. The rst is a k
-nearest neighbor (kNN) implementation that stores calibration data and later uses
it as a look-up table to interpolate an active tag's position using weighted averaging. The second uses a data driven Neural Network model. The third method uses sta-tistical modeling and particle ltering to maximize the a posteriori probability of a current location estimate.
lo-cation of a mobile target be
sm = [ sm,x, sm,y ],
wheresm,xdenotes the rst spatial coordinate andsm,y denotes the second coordinate.
The associated RSSI measurement recorded for multiple communication channels at location sm is
zm = [ zm,1, zm,2, · · ·, zm,C ],
where C denotes the total number of channels used.
The goal of the localization methods is to calculate the true location sm from the
measurement zm. In order to do so, the ngerprinting algorithms must establish a
relationship between sm and zm from a calibration dataset prior to operation. The
locations in the calibration dataset, or training dataset, are
s1:M = s1 s2 ... sM ,
whereM is the total number of positions in the training dataset. The corresponding
RSSI at each set of positions s1:M is
z1:M = z1,1, z1,2, · · · , z1,C z2,1, z2,2, · · · , z2,C ..., zM,1, zM,2, · · · , zM,C .
In order to evaluate an algorithm's performance and to account for the possibility of overtting, a separate dataset is required for testing that provides unseen data measurements to evaluate the robustness and accuracy of localization. The testing dataset also consists of 2-dimensional location and RSSI measurement data given by
s1:N and z1:N, respectively, where N denotes the total number of measurements in
the testing dataset. For this work, both the testing and training dataset come from a single dataset collected through the same experimental procedure. The entire dataset is then split into an 80:20 ratio: 80% of the data is used for the training dataset while the remaining 20% is used for testing dataset which is a common ratio among the machine learning community. This ensures that both datasets are sampled from the same environment with the same sampling probability distribution, while still being independent of each other in order to avoid the problem of overtting. More details on the data collection process are provided in Chapter 4.
To be clear, the index mand constant M will be used exclusively for the training
dataset while the index n and N will be used exclusively for the testing dataset.
3.1
k
-Nearest Neighbors Algorithm
The k-nearest neighbor (kNN) algorithm, one of the simplest ngerprinting
algo-rithms, was proposed in the 1960's and is still commonly used today [27]. The intu-ition behind the algorithm is simple: when an application requires a prediction for an unseen data sample, the kNN algorithm searches through the training dataset for
the k-most similar samples [20]. The algorithm then uses the prediction attributes
of the most similar samples to compute the estimate for the unseen sample. Many researchers have demonstrated that kNN is computationally ecient for many
Figure 3.1.1: Voronoi diagram
regression. It can be used for interpolation, as illustrated by the Voronoi diagram shown in Figure 3.1.1. Here, sub-spaces are divided on a 2-dimensional plane based on distances, where the dierent subareas are shaded in assorted colors corresponding to the closest samples on the plane. This gure provides a visual example of piece-wise constant interpolation using a single nearest neighbor algorithm.
In the context of RSSI-based localization, kNN provides a location estimate ˆsn
using only the RSSI measurement zn and a database of known location RSSI pairs
(s1:M,z1:M). The indexn denotes the unseen measurement of interest. The algorithm
works as follows:
• Compute the distancedbetween each new measurementznand all known
mea-surements in the training dataset z1:M.
dis-tances.
• Compute ˆsn as a weighted average of all known measurements in s1:M
corre-sponding to thek-nearest neighbors of zn withinz1:M using
ˆ sn = Pk i=1disi Pk i=1di .
• Repeat the previous three steps for all unseen measurements. • Stop whenˆsN is computed.
Various distance criteria have been used for the kNN algorithm including the
Man-hattan and Minkowski distances [102]. The majority of researchers use the Euclidean distance because this metric is also often considered as the standard choice when no prior knowledge is available about the data's distribution [114]. For this reason, this work used the Euclidean distance given by
d(zn,zm) = ||zn−zm||,
whereznandzm are RSSI measurements in dBm for the testing and training dataset,
respectively, and
||zn−zm||=
q
(zn,1 −zm,1)2+ (zn,2−zm,2)2+· · ·+ (zn,C −zm,C)2,
where zn,c and zm,c are RSSI measurements for channel c. The algorithm
calcu-lates the Euclidean distances between every new measurement and all of the current measurements in the training datasets during the rst step. The distances are then compared to each other to select the measurements with the smallest distance. That
determines which measurements will be used to compute a weighted average for the location estimate.
3.2 Articial Neural Networks
Articial neural networks (ANN) are used for state-of-the-art machine learning frame-works [1, 26, 53] and were inspired by the biological structure of neural netframe-works in the human brain. Human neurons interconnect in large intricate networks to trans-fer information amongst each other with electrochemical signals to produce thoughts and actions. A neuron can be simplied into dendrites, axons, and a nucleus. The dendrites and axons analogize as the inputs and outputs of each neuron. Figure 3.2.1 displays a simplied image of two interconnected neurons. The axons (outputs) of the rst neuron transfer electrochemical signals to the second neuron's dendrites (inputs). The receiving neuron processes these signals within its nucleus to either produce a response (or not) and then transmit its own output signal, through its axons, to other neurons.
Early neural network developers conceived the articial neuron with the concept of a biological neural network architecture. The crude analogy between articial neurons and the biological neuron is that the connections between nodes represents the axons and dendrites, the connection weights represent the synapses, and the activation function approximates the activity in the soma [52]. Figure 3.2.2 illustrates an articial neuron and shows multiple inputs, an output, and an activation function analogous to a biological neuron's soma. The activation function is what produces a neuron's output which is dependent on its input and the selected activation function. In the context of multichannel RSSI ngerprinting, the input A to the activation
Figure 3.2.1: Interconnected human neurons [31] function is
A =w1z1+w1z2 +· · ·+wCzC,
wherez1:C are the input data and w1:C are the corresponding weights. The output of
the activation function is called the activationa. Both the biological network and the
ANN learn by incrementally adjusting the magnitudes of their weights or synapses [120].
Certain activation functions can introduce nonlinearity in the network. Without these functions, the network can only learn functions that are linear combinations of the inputs. Gaussian, step, threshold, sigmoid, and rectied linear units are examples of such functions. This work uses the sigmoid function because it possesses the distinctive properties of continuity and dierentiability on the interval (−∞, ∞),
Output Activation Function Input Weights f (A) w1 a z1 w2 z2 wC zC
Figure 3.2.2: The articial neuron
0 0.5 1
Figure 3.2.3: The sigmoid activation function function is
f(A) = 1
1 +e−βA,
where β is a constant that determines the width of the sigmoidal shape. Low input
values (far into the negatives) produce an output close to zero; high input values result in an output close to one. The sigmoid function's response is shown in Figure 3.2.3.
![Figure 2.3.2: Outline of current wireless based positioning systems [109]](https://thumb-us.123doks.com/thumbv2/123dok_us/9953019.2487927/37.918.267.712.162.470/figure-outline-current-wireless-based-positioning-systems.webp)