NEW �OR� STATE ENERG� RESEARC�AND DE�ELOP�ENT AUT�ORIT�
A
TL
OADP
OWERF
ACTORC
ORRECTIONF
INALR
EPORTA
UGUST2010
�
The New York State Energy Research and Development Authority (NYSERDA) is a public beneft corporation created in 1975 by the New York State Legislature.
NYSERDA derives its revenues from an annual assessment levied against sales by New York's electric and gas utilities, from public beneft charges paid by New York rate payers, from voluntary annual contributions by the New York Power Authority and the Long Island Power Authority, and from limited corporate funds.
NYSERDA works with businesses, schools, and municipalities to identify existing technologies and equipment to reduce their energy costs. Its responsibilities include:
Conducting a multifaceted energy and environmental research and development program to meet New York State's diverse economic needs.
The New York Energy $martSM program provides energy effciency services, including those directed at the low-income sector, research and development, and environmental protection activities.
Making energy more affordable for residential and low-income households.
Helping industries, schools, hospitals, municipalities, not-for-profts, and the residential sector, implement energy-effciency measures. NYSERDA research projects help the State's businesses and municipalities with their energy and environmental problems.
Providing objective, credible, and useful energy analysis and planning to guide decisions made by major energy stakeholders in the private and public sectors.
Since 1990, NYSERDA has developed and brought into use successful innovative, energy-effcient, and environmentally benefcial products, processes, and services.
Managing the Western New York Nuclear Service Center at West Valley, including: overseeing the State's interests and share of costs at the West Valley Demonstration Project, a federal/State radioactive waste clean-up effort, and managing wastes and maintaining facilities at the shut-down State-Licensed Disposal Area.
Coordinating the State's activities on energy emergencies and nuclear regulatory matters, and monitoring low-level radioactive waste generation and management in the State.
Financing energy-related projects, reducing costs for ratepayers.
For more information, contact the Communications unit, NYSERDA, 17 Columbia Circle, Albany, New York 12203-6399; toll-free 1-866-NYSERDA, locally (518) 862-1090, ext. 3250; or on the web at www.nyserda.org
STATEOF NEW OR� ENERG� RESEARC�AND DE�ELOP�ENT AUT�ORIT�
�
A
TL
OADP
OWERF
ACTORC
ORRECTION Final ReportPrepared for the
N
EW OR�S
TATEE
NERG�R
ESEARC�ANDD
E�ELOP�ENTA
UT�ORIT� Albany, NY www.nyserda.org Michael P. Razanousky Project Manager Prepared by:POWER FACTOR CORRECTION, LLC
Richard Ellenbogen, MEE Project Manager
NYSERDA NYSERDA 11059 August 2010
CONTENTS
Section Topic Page
1 Project Objectives and Background Information 4 1.0 Project Introduction, Objectives and Overview 4
1.1 Background 5
2 Industrial and Commercial Application 13 2.0 Background and Conclusions – Industrial 13
2.1 Implementation 14
2.2 Results and Analysis 16
2.2.1 500 KW Manufacturing Facility 16 2.2.2 150 KW Peak Load Supermarket 20 2.3 Cost/Benefit Analysis – Industrial/Commercial 23 2.3.1 500 KW Manufacturing Facility 23 2.3.2 150 KW Peak Load Supermarket 23
2.3.3 Additional Observation 24
2.4 Conclusions – Industrial/Commercial 24
3 Refrigerated Vending Machines 26
3.0 Background and Conclusions – Refrigerated Vending Machines 26
3.1 Implementation 28
3.2 Important Facts about Vending Machines that will affect an
Efficiency Program 30
3.3 Data Analysis 32
3.4 Cost/Benefit Analysis - Refrigerated Vending Machines 37
3.5 Conclusions 38
4 Multi Family Residential 40
4.0 Background and Conclusions – Multi Family Residential 40
4.1 Implementation 42
4.2 Observations about customer behavior and the service area
that will affect an Efficiency Program 46
4.3 Data Analysis 47
4.4 Cost/Benefit Analysis - Multi Family Residential 51 4.5 Conclusions – Multi Family Residential 53
5 Single Family Residential 55
5.0 Background Information and Implementation 55
5.1 Results 58
5.2 Other Issues Encountered in the Single Family Residential
Residential Environment that affect Energy Efficiency 61 5.2.1 Larger Single Family Homes 61 5.2.2 Load Balancing Between Phases 62 5.2.3 Charlatans Selling Power Factor Correction 64
Section Topic Page
6 Harmonic Analysis 68
7 “At Load” Reactive Power Correction versus “Service Entrance”
Power Factor Correction 75
8 Economic Analysis Comparing “At Load” Correction Costs
For Various Sized Services 76
9 Summary of Conclusions – Overall Project 80
1 - PROJECT OBJECTIVES AND BACKGROUND INFORMATION 1.0 Project Introduction, Objectives, and Overview
Power Factor is the ratio of the power needed to do the work within customer premises to the power delivered by the utility. A power factor of 1.0 is ideal. Equipment located in customer premises emits reactive power that lowers the power factor. There are devices that can be attached to the loads to raise the power factor and reduce the amount of energy lost as heat on the wires in buildings and on the electrical distribution system.
This paper presents the background information, method, and results from an eighteen month long pilot project designed to determine the economic feasibility of “At Load” power factor correction in various scenarios as a method for improving efficiency and reducing losses on the electric utility system. “At Load” power factor correction will be analyzed in multi-family dwellings (apartments), single family residences, commercial buildings and industrial buildings. As power factor correction is not a new concept, the project had four objectives. For all phases of the project, our first objective was to measure the power factor in the different environments. This involved creating data bases to simplify handling of the data being collected. Second, we wanted to gain a better understanding of the reactive loads in the different environments. That understanding includes the age of the appliances or equipment discharging the reactive power and the types of installations involved. Our third objective was to correct the power factor in the most cost effective manner possible. Our final objective was to measure the effect of our installation and determine the cost versus benefit of the installations. Benefit is measured in Kilowatt Hours (KWH) saved.
While the results presented for all of the test environments will be similar, the magnitudes of improvement and the related costs vary from environment to environment. Also, the volume of data being collected and the timeframe of the data collection at the different sites mandated that we divide the project into four phases. This is a summation of the results from all phases of the project. There are individual papers for the Industrial/Commercial analysis, the Vending Machine analysis, and the Multi Family Dwelling analysis phases of the project. The Single Family Residential Data is documented in Part 5.
Many of the references in the paper are to the Transmission and Distribution system in New York, as the work was done there. Nevertheless, the results are valid for nearly all AC distribution systems.
1.1 Background
Power Factor is the ratio of the power needed to do the work within customer premises to the power delivered by the utility. The power needed by customer premise equipment to operate is measured in Kilowatts (KW). The amount of power delivered by the utility is measured in Kilovolt Amperes (KVA). KW divided by KVA is the power factor. A power factor of 1.0 is ideal. Appliances and machinery within customer premises discharge reactive power, measured in Kilovolt Amperes Reactive (KVAR). More KVAR present on the utility system results in a lower power factor, and higher currents (I) present on the wires. Because thermal losses on the wires are proportional to the square of the current, a 12 % increase in current will result in a 25% increase in thermal losses related to the increased current. (1.12 x 1.12=1.25). Similarly, a 10% current reduction will result in a 19% drop in thermal losses and provide the corresponding energy savings (0.9 x 0.9 = 0.81). Additional information explaining power factor and the associated energy losses can be found on-line at www.wikipedia.org or on ourweb-site, www.powerfactorcorrectionllc.com .
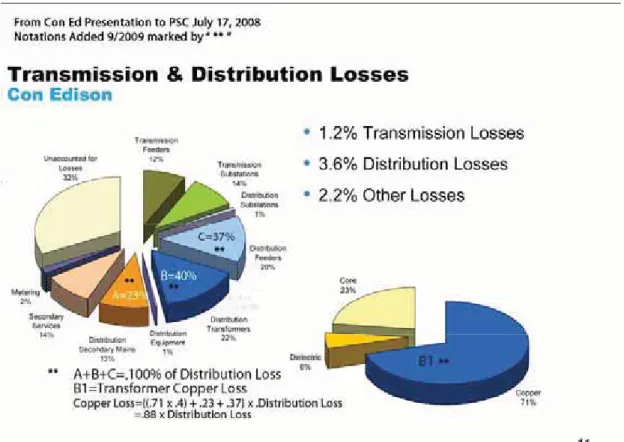
Historically, utilities have implemented power factor correction at their substations by installing banks of capacitors. The substations are where the utilities reduce the voltage (usually greater than 110,000 volts) from the transmission wires to lower voltages (4,100 volts or 13,000 volts) for distribution throughout the service area. The voltages are further reduced to the range of 208 volts to 480 volts at the transformers on the utility poles or in underground vaults located near the customer premises. The problem with implementing power factor correction at the substations is that the reactive power present on the distribution system, not serviced by those capacitors, is inducing thermal losses. Furthermore, the distribution system, with its lower voltages and higher currents, already accounts for the majority of the losses on the system. In addition, more thermal losses occur on the customer side of electric meter, within the customer premises. On the Transmission and Distribution System, 50% of the energy lost and almost 75% of the “Accounted For” energy losses occur on the lower voltage Distribution Portion of the system (See Figure 1). Those figures do not include losses from reactive load that occur after the customer meters. While the utility does not bill for reactive power in most cases, excess thermal losses after the meter caused by reactive load would be measured in watts and would be billed. The losses, while relatively small for any single location, when aggregated throughout New York State, are very significant.
The inadequate capacity on the distribution system is becoming an issue of great concern with the pending introduction of inexpensive electric vehicles in late 2010 and the first quarter of 2011. On March 30, 2010, Nissan announced that itsLeaf Electric vehicle would go on sale in April, with delivery starting in the fourth quarter of 2010 at a net price of less than $26,000. An article in IEEE Spectrum from January, 2010 indicates that only two or three vehicle chargers on one local distribution transformer could cause a
failure 1. Effectively increasing the capacity of the distribution system by 7% to 10%, by removing the reactive load, would greatly help to alleviate part of that problem.
Traditional thinking, as evidenced in articles written as recently as May 2007 2, assumes that the losses only occur in the wires. Calculations have been done on the losses based on the ohms per foot of a length of copper wire. Still, in many buildings, especially older buildings, the majority of the losses occur at the junctions. These include screw connections on switches, receptacles, and breaker panels, the metal-metal interface of a switch or of a plug in a receptacle, circuit breakers, and wires in junction boxes connected by wire nuts. As these copper and copper alloy connections age, they oxidize. This oxidation increases resistance and the associated losses.
The result is that any excess current will increase thermal losses within customer premises.
Figure 1: Excerpted from Transmission and distribution Losses. Consolidated Edison. Originally presented July 17, 2008 Percentage Notations added September, 2009.
����������������������������������������������������������������������������������������������������������������������������������
1 "Speed Bumps Ahead for Electric Vehicle Charging”, Peter Fairley, IEEE Spectrum, January, 2010
2 "Is Power Factor Correction Justified for the Home”, William Rynone, President, Rynone Engineering, Power Electronics Technology, May 2007 http://www.powerelectronics.com
---
As many of the buildings in New York are older and have older electrical services, the connections will have more oxidation and higher resistances (R). That will result in higher I2R (thermal) losses at those connections. Any system that can reduce currents in the aging wires and connections will result in energy savings. As higher operating temperatures in system components cause more rapid aging of those parts, reducing currents and the associated heat will also add longevity to the system and devices attached to it. By reducing the currents at the load, the savings accrue from the load all of the way back to the first substation where power factor correction is traditionally employed. In addition, by increasing the power factor on the distribution system, existing capacitance is freed at the substation to be used to further raise the power factor on the transmission system on hot days when there are increased loads. That would yield additional energy savings on the transmission system.
According to Figure 1, 7 % of the energy that enters the transmission and distribution system is lost before it reaches the customer. The national average is 7.2%. Of that 7.0 %, 3.6% is lost on the distribution system that is not serviced by the utility’s capacitors. We are primarily concerned with those losses and the losses after the customer’s utility meter. In Figure 1, transformer losses are shown in the pie chart at the lower right. Twenty-nine percentof the losses in the transformer are “no load” losses and are related to eddy currents in the iron core of the transformer and dielectric losses. Those losses are fixed for a given transformer and will not vary with current. The segment marked “B1” represents the copper losses. Those losses occur in the wires of the transformer and will increase with increasing current.
In Figure 1, according to the pie chart on the upper left, on the distribution system 23% of the losses occur in the secondary mains, 37% of the losses occur in the distribution feeders, and 40% of the losses occur in the
transformers. Seventy-one percent of that 40% occurs in the transformer copper, resulting in 28.4% of distribution lo occurring in the transformer windings. The result is that 88% of distribution (thermal) losses, amounting to
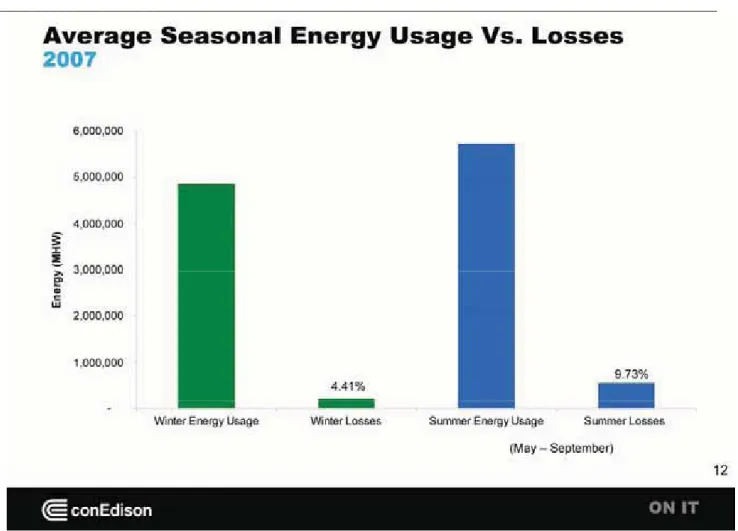
3.17% of all energy generated, occurs in the wires of the distribution system that is not serviced by power factor correction. That is a yearly average. It is lower than that during the winter, and higher than that during the summer. Figure 2 indicates that the losses during the warmer, summer months are more than double those during the cooler, winter months. Based on those values, the summer losses can be over 4%. On the 13 Gigawatt Con Ed system, that 4% translates to over 520 megawatts on a day with peak load. To put that into perspective, the new NYPA (New York Power Authority) combined cycle gas turbine power plant in Queens, N.Y. generates 500 megawatts at peak output. Depending on the type of fossil fuel generation being considered, power plant efficiencies can be as low as 25% to 30% for the older coal power plants to 55% for the new combined cycle gas fueled generating plants3.
3 Electric Generation Efficiency, Working Document of the NPC Global Oil & Gas Study, Made Available July 18, 2007, NATIONAL PETROLEUM COUNCIL , POWER GENERATION EFFICIENCY SUBGROUP OF THE DEMAND TASK GROUP OF THE NPC COMMITTEE ON GLOBAL OIL AND GAS
____________________________________________________________________________________
__________________________________________________________________________________________
The average efficiency of delivered energy to the customer, after factoring in generating losses and
transmission and distribution losses, is approximately 33%. Of every three watts of energy consumed at the generating plant, only one watt reaches the customer’s meter. More energy is lost through inefficiencies after the meter, within the customer premises. Any system that can reduce load, including load caused by distribution losses, will save approximately three times that amount of energy at the generating plant. Associated greenhouse gas production and emission of other pollutants will also be reduced proportionally.
Figure 2 shows the average losses in summer versus winter and the seasonal net energy usage. It can be seen that losses during the summer months are 2.2 times higher than during the winter months. The higher summertime electric load results in heating of all components of the transmission and distribution system. In addition, there is less convective cooling of components as a result of the higher ambient air temperatures. More direct sunlight and more hours of daylight result in a far greater solar load. When all of these factors are combined, the result is that the entire system operates at an elevated temperature. As the temperature of
Figure 2: Excerpted from Transmission and distribution Losses. Consolidated Edison. Originally presented July 17, 2008
electrical conductors increases, their resistance increases proportionally. The equation below explains the effect of temperature on the resistance of electrical conductors.4
For copper a= 0.004041 per degree-C. The result is that a 10 degree-C (18 deg-F) temperature rise will yield a 4% increase in the resistance of a copper conductor. As thermal losses in wires are proportional to the resistance (R), the line losses increase proportionally. Additionally, as the thermal losses increase, the conductor’s temperature rises still further and the resistance continues to increase. This process continues until the conductor temperature reaches equilibrium (heat gain from all sources=heat loss to air or surrounding environment) or in the extreme case, the conductor or transformer will overheat and suffer catastrophic failure.
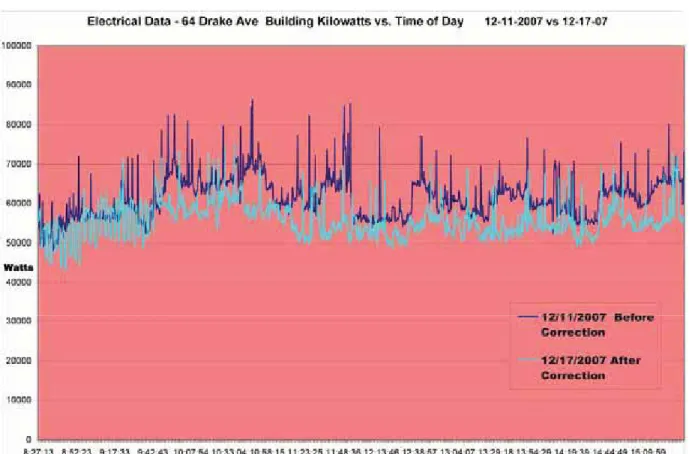
By reducing currents only 7%, the associated thermal losses will be reduced by 14%. That reduction will be augmented as less thermal loss results in lower conductor temperatures, resulting in a lower conductor resistance. Figure 3 shows the before and after KW usage of a facility that was corrected during 2007. It can be seen that the “before” usage was continuously higher than the “after” usage.
When comparing the two sets of data, we were careful to ensure that the loads were the same. The visible difference is from the reduction of line losses in the facility, resulting from the reduction of reactive load. Even during the lunch hour, which appears as the dip on the graph between 11:50 and 12:30, the KW consumption is reduced. All of the machines would have been idling during that period, except the air compressors. This reduction was achieved in a building that had an electrical service that was only five years old and installed to the latest codes. Oxidation at the wire terminations is minimal, as a result of that. In an older building, the results will be more dramatic.
Figure 3 – Customer premise power (KW) usage, before and after reactive power correction. The same equipment was operating on both days, as can be seen from the nearly parallel usage characteristics. The offset is a result of the decrease in consumption caused by raising the power factor from 0.7 to 0.95.
At peak load during the summertime, thermal losses caused by reactive power can consume between 250-MW and 300-MW of generation in the Con Ed service area, including losses within customer premises and on the utility’s distribution system. That does not include reactive losses on the transmission system.
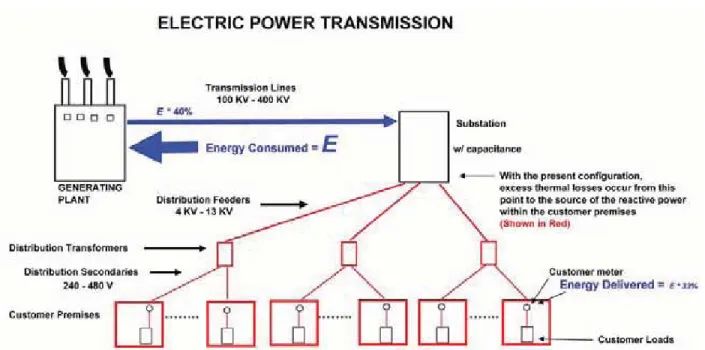
The present day cost of that generating capacity is approximately $2000/kilowatt in the New York area, or between $5 billion and $6 billion. There is also a cost to upgrade and maintain substation capacitance to correct the reactive load at that level. Transmission and distribution capability also has to be maintained or upgraded to transfer the additional power to the customer. In addition, substation capacitance does not prevent the associated energy losses on the distribution system. It only reduces the losses on the transmission system. (See Figure 4). As mentioned earlier, those
thermal losses, and the associated elevated temperatures, degrade components on the system. The excess load also reduces the amount of usable energy that can be delivered to the customer.
While reducing load will certainly reduce maintenance costs on the distribution system, we did not figure those savings into our economic calculations for two reasons. The primary reason is that there are so many variables involved in the associated costs of maintaining the distribution system, it would be extremely difficult to design a model that would accurately determine reactive power’s effect on the maintenance costs. The second reason was that, after calculating the other economic benefits of the process, the additional savings on distribution system maintenance were “icing on the cake”.
The primary goal of this project was to determine the amount of loss reduction achievable through adjusting the power factor of various types of building loads and the associated economics of the process.
Figure 4 – Block diagram of the electric power transmission system. At present, the utilities correct reactive power at the substations. The distribution system, shown in red, operates with a less than optimal power factor. “At Load” power factor correction will reduce the losses on that entire part of the system.
One possible side effect of performing power factor correction can be increased levels of harmonics. Harmonics are waveforms present on the utility system that have a frequency that is a multiple of the system frequency of 60 hertz (hz). (e.g.: 120 hz-2nd harmonic, 180 hz-3rd harmonic, 240 hz-4th harmonic, etc.). The odd numbered harmonics (180 hz, 300 hz, etc.), cannot be used by equipment on the system. They are absorbed into the components on the system and dissipated as heat. Harmonics can also damage electrical equipment in certain circumstances. For example, harmonics that enter a transformer cause eddy currents in the magnetic core, which are released as heat. In capacitors, harmonics can cause destructive resonances. Sources of harmonics on the utility system include ballasts on some fluorescent lighting and switching power supplies on TV’s and computers, among others. One goal of the project was to determine if there would be an increase in harmonics and the associated undesirable effects resulting from them, after installing power factor correction at the various locations. Harmonics are discussed in detail in section 6.0 starting on page 67.
2 - INDUSTRIAL AND COMMERCIAL APPLICATIONS
2.0 Background and Conclusions � Industrial
Accurate data is not available on the number of services in each kilowatt range in the New York metropolitan area, however,Con Ed recently initiated a new tariff that will go into effect over the next three years for services above 500 kilowatts of peak demand. Approximately 7000 meters are affected by this new tariff.
While much of this documentation will reference the New York Metropolitan Area as the work was done here, it is applicable to other areas of the country as well. Conclusions that we have drawn from the work completed to date are the following:
• The power factor is sufficiently low in commercial and industrial buildings that improving it will result in a substantial energy savings throughout the entire utility system, when measured in KWH.
• We can cost effectively improve the power factor for commercial and industrial buildings using the “At Load” technique.
• Standards need to be modified so that new commercial and industrial buildings, and their associated process equipment, are designed with a high power factor as part of the design criteria.
• “At Load” Power Factor Correction in this environment does not greatly increase the amount of harmonics.
• “At Load” Power Factor Correction in this environment will reduce CO2
emissions by approximately 30 tons annually for each corrected facility of greater than 500-KW, and by approximately 11 tons annually for each corrected facility of greater than 150-KW.
• Power Factor Correction must be load based and must only operate when needed. Excess capacitance connected to the utility system can be as detrimental as excess inductance. Furthermore, in the event of a blackout, the excess capacitance
would add extra impedance that would have to be energized, applying extra load to the system during a restart.
• In most applications, “At Load” correction has significant advantages over “Service Entrance” correction with respect to energy savings, cost, return on investment, and reduced levels of equipment damaging harmonics.
2.1 Implementation
Implementation of the “At Load” Power Factor Correction for the industrial locations was relatively simple and involved the following steps:
1 Acquiring Funding: This was provided through a NYSERDA grant to offset the cost of equipment that would be installed within the customer premises.
2 Acquiring Test Sites: Upon confirming that we had project funding, we proceeded to look for building owners that would be willing to participate in the project.
3 Initial Measurements : The first step of the process is a walk through of the facility to look at the equipment located on site. Certain types of equipment are likely sources of reactive power. Those include screw compressors, air conditioning equipment, machinery with fly wheels, and large blowers, among others. The second step is to take measurements at the service entrance of the facility over an extended period of several hours during the building’s prime operating period to determine the reactive load and power factor of the facility. The third step in the process is to take measurements at the interconnection point of obvious sources of the reactive load to determine each machines load characteristics and how much reactive power they are discharging onto the system. Step four involves calculating the size of the devices that need to be attached to each piece of equipment to correct the problem.
4 Preparation of an Equi pment Order and Acquisition of Correction De vices: The total size of the facility’s KW load, its reactive load, and the facility power factor will determine which locations receive correction. To raise the power factor to 0.97 does not require correcting every piece of equipment in a building. After a certain point, there is a diminishing return to adding correction. The additional cost of the device and installation will not be justified by the return on investment. Smaller loads, in relation to other loads within the facility, will likely not need to be corrected in order to achieve a final power factor of 0.97.
5 Equipment Installation:During installation, we attached a data logging meter at the facilities service entrance to record the effect of each device as it was installed. Correction devices were wired to the starting contactors of the equipment so that they would only engage when the associated motor turned on. If possible, it is better to connect the correction devices on the utility side of the thermal overload, but after the contactor. If that is not possible, the overload values of the contactor will have to be adjusted.
6 Final Testing: If the devices are properly sized, the power factor will have risen to the desired levels after installation. This will be confirmed by the data logger attached at the service entrance.
2.2 Results and Analysis
Results for two typical facilities will be documented in the following section. The first is a manufacturing facility with a peak demand of over 500-KW. The second is a supermarket with a peak demand of 150-KW. 2.2.1 500�KW Manufacturing Facility:
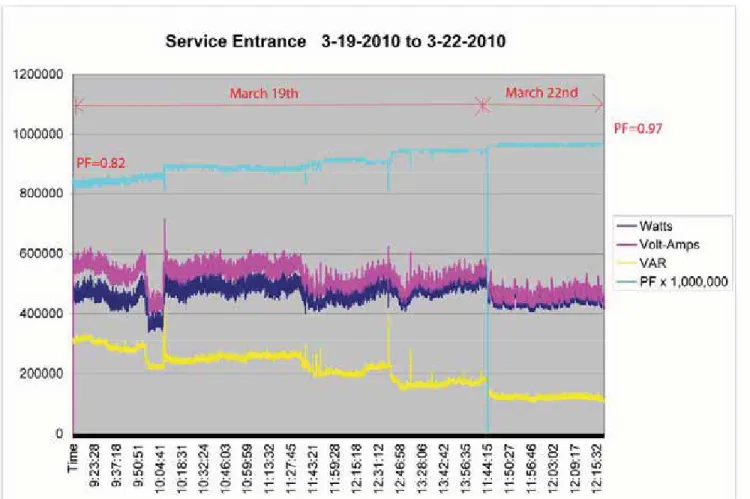
The facility had a peak load that varied between 500-KVA and 660-KVA with a peak KW load that varied between 425-KW and 550-KW. The VAR (Reactive) load was fairly consistent and varied between 300-Kvar and 330-Kvar, while the power factor varied between 0.82 and 0.86. Figure 5 lists the different equipment and their reactive loads.
Based on the 506-KW building load, the 310-Kvar reactive load, and the power factor of approximately 0.83, it would require 145-Kvar of added correction to achieve a final power factor of 0.95, 180-Kvar of added correction to achieve a final power factor of 0.97, and 235 Kvar of added correction to achieve a final power factor of 0.99. While it would require an additional 35-Kvar to achieve an additional 2% efficiency
improvement from 0.95 to 0.97, it would require 55-Kvar (57% more) to get a further 2% improvement from a power factor of 0.97 to a power factor of 0.99. This is an example of the diminishing return and greatly increased cost of correction beyond 0.97 that was mentioned earlier.
The cost of an “At Load” correction system to achieve a power factor of 0.95 would be approximately $18,000, including engineering and installation. That is approximately $3,000 more than the equivalent service entrance correction system. The relative benefits of each type of system will be discussed later. As we were already on site implementing a correction system, an additional $2,000 would be required for the equipment and installation to achieve a power factor of 0.97, for a total cost of approximately $20,000. The advantage of the “At Load” system is that the line loss (KW) reduction in the building’s wires will help to pay for the system. With the service entrance system, there is no such savings as the line losses after the meter remain the same as before the system was added. There would only be savings if there is a reactive power charged assessed by the utility.
Using the “At Load” correction system, at the basement compressor we measured a fourvolt rise across all three phases with a 144 ampere load after correction. As the voltage at the service entrance remained nearly constant (+/- 1 volt) throughout our measurement period, it was apparent that the entire voltage drop was occurring on the wires within the building. Fourvolts at 144 amperes on a three phase service corresponds to a nearly 1000 watt reduction in losses in the wires leading to that compressor from the service entrance. Thesavings will accrue for the entire time that the compressor is operating. At a 50% duty cycle for the screw compressor, operating twenty hours per day, that yields 10 KWH savings every day for theone machine, or approximately $2.00 per day in usage ($500/year). That does not include the reduction in demand charges related to that 1-KW reduction in load every month, which will save an additional $150 to $200 per year. Extrapolating those savings across the entire installed system, the load reduction will be in the range of 7-KW to 10-KW and the annual savings will be approximately $6,400 per year, excluding depreciation. With depreciation (35% tax bracket), the savings will rise to approximately $8,600 annually, resulting in a 2.3 year return on investment for the system. With a service entrance system, the energy savings will only be realized on the utility’s distribution system, and energy savings will not help to offset the cost of the installed equipment. The energy savings of the “At Load” system will be approximately 30,000-KWH annually, or approximately equivalent to the output of a 27.5-KW solar array. The cost for that array at current
prices would be approximately $206,000, or over 10 times the cost of the power factor correction system. Tax credits on the solar array would be over $ 60,000, or more than three times the cost of the entire power factor system. The 2.3 year return on investment for the power factor correction system includes no public subsidies or tax credits of any kind. Figure 6 shows the KW, KVA, Kvar, and Power Factor at the service entrance of the 500-KW facility. The Power factor has been multiplied by one one million so that it would display on the same scale. Before we started activating the correction devices on Friday, March 19, the power factor was 0.82. When we finished on Monday, March 22, the power factor was 0.97. No work was done over the weekend. The entire system was installed by two electricians in approximately three days. Figure 8, shows the waveform for one of the compressors before it was corrected. Note the power factor of 0.79.
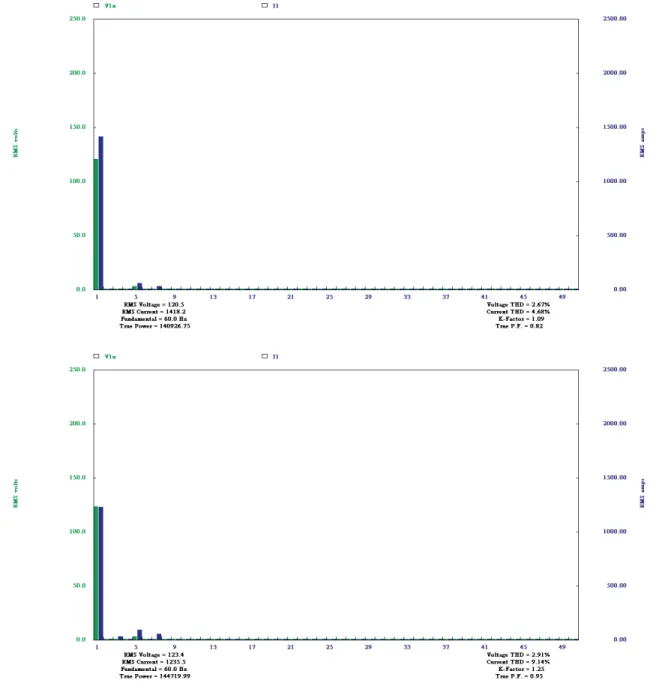
Prior to the installation of the equipment, the harmonic voltage distortion was measured at 2.67%. This rose to 2.91% after the installation was completed, an increase of less than a 0.25%, despite the addition of 180-Kvar of capacitance. This is documented in figure 7.
Figure 6 -KW, KVA, Kvar, and Power Factor during turn on of the correction system 180-Kvar of correction was added to raise the power factor from 0.82 to 0.97. Building loads will be reduced by 7-KW to 10-KW as a result of lower currents and the associated reduction in line losses.
Figure 7 – Harmonics at the service entrance (500-KW facility), before and after correction. Increase in voltage %THD is less than 0.25% after the installation of 180-Kvar of Capacitance. Increase occurs primarily in the 5th and 7th harmonics, with a small increase in the 3rd harmonic.
Figure 8 -Waveform of an uncorrected compressor with a power factor of 0.79. After correction, the
power factor was raised to 0.96.
2.2.2 150 KW Peak Load Supermarket
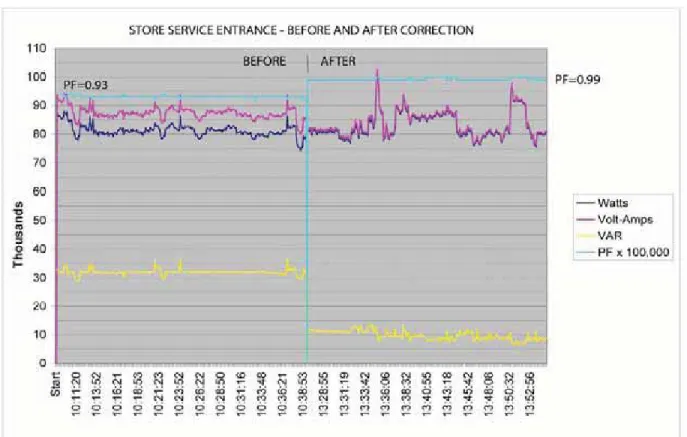
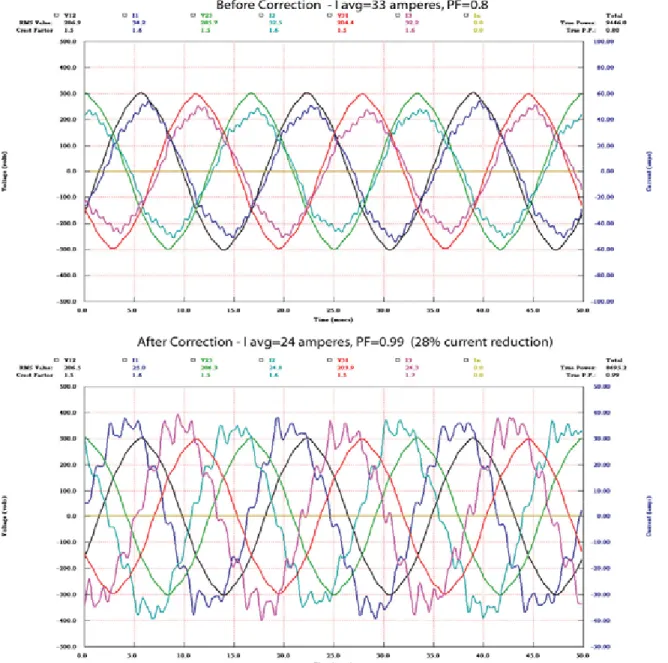
The second commercial facility to be analyzed is a supermarket with a peak load of approximately 150 -KW. Correction was added to all of the refrigeration compressors that were mounted in a central rack type arrangement. Correction was also added to the rooftop air conditioning. As the refrigeration operates with a nearly 100% duty cycle, the savings will be substantial, when measured over an entire year. Measurements were taken during the summer. Figure 9 documents the service entrance in October. As in the earlier graph, the power factor has been scaled to be visible on the graph. The scaling factor for this graph was 100,000. The initial power factor measured 0.93 before correction and was between 0.99 and 1.00 after correction. The refrigeration operates with an average 80% duty cycle. Figure 10 documents the before and after waveforms for one of the seven compressors that was corrected. The reduced currents resulting from the Power Factor correction will result in approximately a 1.25-KW reduction in line losses within the building during the winter months and a 2.5-KW reduction in losses during the summer cooling season. The result is that there will be a savings of nearly 11,400-KWH annually plus a minimum of a 1-KW reduction in demand. The total annual savings on energy costs will be approximately $2,400 per year. The entire system cost $12,000, including installation and engineering, resulting in a five year return on investment, before depreciation. If depreciation is considered (35% tax bracket), the return on investment is reduced to less than four years. The annual energy saved is equivalent to the output of a 10,400 watt solar array.
That array would cost approximately $77,000 at today’s prices, or 6.5 times more than the reactive power correction system. The solar array would be eligible for over $25,000 in tax credits and $30,000 in rebates. Together, that is more than four and a half times the entire cost of the reactive power system. The harmonics distortion at the service entrance was lower after correction (1.74%) than before correction (1.93%), indicating that there were other devices present that caused more voltage distortion than the correction system.
Figure 9 -KW, KVA, Kvar, and Power Factor during turn on of the correction system 35-Kvar of correction was added to raise the power factor from 0.93 to 0.99. Building loads will be reduced by 1.25-KW during the winter and by approximately 2.5-KW during the cooling season as a result of lower currents and the associated reduction in line losses.
Figure 10 – Before and after waveforms for one of the seven compressors at the supermarket. IAVG was
reduced by 28% from 33 amperes to 24 amperes, while the power factor was raised from 0.8 to 0.99. That results in a 48% reduction in associated line losses.
--- 2.3 Cost Benefit Analysis - Industrial and Commercial
We will be making the following assumptions in performing the financial analysis based on figures for the Con Ed service area :
� $2000 per KW to construct generation
� 13$-KVAR to install capacitance at the substation5
� $ .05-KWH wholesale electricity price, $ .20-KWH retail electricity price 2.3.1 500�KW Facility
In addition to the "after the meter savings"documented earlier for the 500-KW facility, that resulted in a return on investment for the customer of less than three years, there are also utility system savings. The low end, seven KW, load reduction will save approximately $14,000 in generation and the 180-Kvar of capacitance will alleviate the need for $2,350 worth of capacitance at the substation, for a system-wide savings of $16,350. That does not consider the additional savings of having a more lightly loaded distribution system and the ability to defer adding capacity. There are additional energy savings on the distribution system resulting from the reduction of thermal losses on the utility’s conductors. As stated earlier, reactive copper losses on the distribution system account for approximately 0.32% of all power distributed, averaged over the year. The percentage is higher in the summer when the conductors are hotter. On a 600-KVA facility, that amounts to approximately 1-KW for the entire time that the facility is operating, or about 100 hours per week. That calculates to 5200-KWH annually, or an additional $260 worth of electricity at wholesale prices, for a total system wide, before the meter, savings of over $16,300 in the first year. When viewed from a societal perspective, the total additional cost of the system is less than $3,700, after subtracting generation costs, substation costs, and energy costs. That results in a return on investment of approximately six months, when considering the customer premise savings of $6,000 annually.
2.3.2 150�KW Facility
The utility system savings for the 150-KW facility are the 2.5-KW generation offset of $5,000, the 35-Kvar offset of substation capacitance of $450, and the energy reduction of 0.3%, or approximately 300 watts continuously (2628-KWH annually), which is $130 at wholesale prices. That totals to $5,580 resulting in the net cost of the system being reduced to $6,420. With a $2,400 after meter annual savings, the return on investment is less than 2.7 years, excluding depreciation.
5 New York Independent System Operator (NYISO), Benefits of Adding Capacitors to the Electric System, February 27, 2008, PP.14
2.3.3 Additional Observations
The required period for the return on investment rises as the systems decrease in size. As can be seen from the earlier analysis, they are very cost effective in facilities above 100-KW. Still, when this technology is compared to other “Green” technologies, the return on investment is much shorter. This is also true for the smaller systems at locations using less than 100-KW of peak demand, even without government tax credits and rebates. The earlier cost analysis is based on aftermarket correction of customer premise equipment. It is very unfortunate that the government is not mandating the needed efficiency standards in the new equipment, where it would be far less expensive to implement. The additional cost of the equipment would be offset by energy savings in a matter of months. The full analysis of this and a more detailed comparison of the various costs appear in section 7.0.
Our analysis has not addressed the additional environmental benefits of reduced energy usage, nor the geo-political aspects of reduced energy usage. Nevertheless, simply on an economic basis, the cost effectiveness of this technology justifies its implementation.
2.4 Conclusions
Based on our measurements and results obtained measuring the electrical characteristics of industrial and commercial locations, we have come to the following conclusions:
• The power factor is sufficiently low in industrial and commercial equipment that improving it will result in a substantial energy savings throughout the entire utility system, when measured in KWH.
• We can cost effectively improve the power factor for existing equipment. The return on investment is between two and four years at present, including depreciation, and not including Kvar charges. The return on investment will be shorter if the utility charges for reactive power.
• “At Load” Power Factor Correction in this environment does not significantly increase the amount of harmonics present on the utility system.
• Power Factor Correction must be load based and must only operate when needed. Excess capacitance connected to the utility system can be as detrimental as excess inductance. Furthermore, in the event of a blackout, the excess capacitance would add extra impedance that would have to be energized, applying extra load to the system during a restart.
• In most applications, “At Load” correction has significant advantages over “Service Entrance” correction with respect to energy savings, cost, return on
investment, and reduced levels of harmful harmonics.
• Standards need to be modified so that new commercial and industrial machines are designed with a high power factor as part of the design criteria.
While the last item on the list will increase the price of the equipment, as can be seen in figure 19, the accrued savings on energy will more than offset the additional cost.
PART 3 - REFRIGERATED VENDING MACHINES
3.0 Background and Conclusions - Refrigerated Vending Machines
This section addresses “At Load” power factor correction in refrigerated vending machines. Initially, this was not included in the scope of the work. We were out in the field with the
equipment and decided to analyze a refrigerated vending machine. It had the worst power factor of any piece of equipment that we found. Upon further investigation, we determined that the machine we first tested was not an aberration but was in fact, the norm.
A report issued by Pacific Gas and Electric of California (PG&E) indicated that in 2002 there were three million refrigerated vending machines in the United States6. As of 2005, New York State represented 6.4% of the total US population. It would be fair to assume that approximately 6% of the refrigerated vending machines in the United States, or 180,000 machines, are located in New York. That provides a large “market” on which to implement this process. In addition, according to the PG&E document, the design life of the vending machines is ten years, so many that are currently in service will be there for many years.
While much of this documentation will reference the New York Metropolitan Area as the work was done here, it is applicable to other areas of the country as well. Conclusions that we have drawn from the work completed to date are the following:
• The power factor is sufficiently low in refrigerated vending machines that improving it will result in substantial energy savings throughout the entire utility system, when measured in KWH.
• We can cost effectively improve the power factor for existing refrigerated vending machines, using aftermarket devices.
• Standards need to be modified so that new refrigerated vending machines are designed with a high power factor as part of the design criteria.
6 Codes and Standards Enhancement Initiative For PY2004: Title 20 Standards Development, Analysis of Standards Options For Refrigerated Beverage Vending Machines, Prepared for: Gary B. Fernstrom, PG&E, Prepared by: Davis Energy Group - Energy Solutions, May 5, 2004, PP. 2
• Power Factor Correction in this environment does not measurably increase the amount of harmonics.
• Power Factor Correction in this environment will reduce CO2 emissions by 21,000 tons annually for New York State.
• Power Factor Correction must be load based and must only operate when needed. Excess capacitance connected to the utility system can be as detrimental as excess inductance. Furthermore, in the event of a blackout, the excess capacitance would add extra impedance that would have to be energized, applying extra load to the system during a restart.
3.1 Implementation
Implementation of the Power Factor Correction for the vending machines was relatively simple and involved the following steps:
1 Acquiring Funding: This was provided through a NYSERDA grant to offset the cost of equipment that would be installed within customer premises.
2 Equipment Measurement: Upon confirming that we had project funding, we tested various devices to try tofind equipment that would lend itself to cost effective Power Factor correction. After measuring the power factor of several refrigerated vending machines, we determined that they were a prime candidate for the project.
3 Device Design : While devices for power factor correction are readily available for large facilities, that is not the case for the smaller scale application that we are considering here. Labor and other installation costs have to be kept to a minimum in order to make this process viable. In the past, one of the reasons that small scale power factor correction has not been applied is installation cost. The bulk of that cost is in labor. After applying for the grant and prior to being approved for the grant, we designed and fabricated devices that could be installed by a non-technical person. No electrician is needed. A patent was filed on these devices, called PLIP’s®, in November, 2008. PLIP® is an acronym for “Plug In Power Factor Correction”. Figure 11 is a photo of a PLIP®. A specialized version of the PLIP® was developed to work with the vending machines. Its physical package is identical to the other versions.
4 Implementation and Testing : After receiving approval on the PLIP’s® from Underwriters Laboratories, we started installing PLIP’s® on various refrigerated vending machines. There are three major manufacturers of these types of machines in the United States and they supply 85% of the machines in use . 7 None of the machines that we tested had a power factor above 0.75 .
7 Codes and Standards Enhancement Initiative For PY2004: Title 20 Standards Development, Analysis of Standards Options For Refrigerated Beverage Vending Machines, Prepared for: Gary B. Fernstrom, PG&E, Prepared by: Davis Energy Group - Energy Solutions, May 5, 2004, PP. 2
Figure 11: The PLIP® Plug In Power factor correction. Power Factor Correction Installation costs are greatly reduced. An unskilled person can install these.
3.2 Important Facts about Vending Machines that will affect an efficiency program
The head of the equipment division that manufactures vending machines for a major North American bottler told me that the Department of Energy only gives them credit for efficiency improvements that occur within the machine envelope. Power Factor improvement will reduce losses caused by the machine outside of the machine envelope. It would cost the bottler approximately ten dollars more per machine to implement the improvement, increasing the cost of the machine by approximately one-half of one percent. That would be a significant cost with the volume of machines that they manufacture,and the Department of Energy would not recognize the improvement and give them credit for it. To put the cost in perspective, if the correction were installed by the bottler, the customer that had the machine in its facility would realize the ten dollar savings in about one year. The utility would save that much, as well.
While learning about the electrical characteristics of vending machines, we also learned a great deal about the market for new and used refrigerated vending machines. This was accomplished by reading the available literature and doing web searches, but also by making phone calls to several vending machine companies and visiting Superior Vending Machine in Mt. Vernon, NY. Among things that were learned are:
1 - The service life for a new refrigerated vending machine is approximately ten years. It can be longer, depending on where it is located and how many times it is refurbished..
2 - A new refrigerated vending machine will cost between $3, 400 and $4,500, including shipping. As they are expensive, a program to retrofit existing machines will improve efficiency more quickly than a program to replace the machines.
3 - A used, refurbished, refrigerated vending machine will cost between $1,000 and $2,300 depending on the bottle capacity, including freight. When the machines are refurbished, they are sold with approximately a four month warranty. The compressors are usually “reworked” but are not usually replaced when the machines are refurbished. That results in vending machines having the compressors with the existing efficiencies remaining in use for an extended period.
4 - Refrigerated Vending machines use a 1/4-Horsepower compressor. Frozen food (Ice Cream) dispensing machines use a 1/3-Horsepower compressor. None of the machines that we tested had a power factor above 0.75. The larger vending machines that have more lamps in their display operate with a higher power factor because the compressor
is a smaller percentage of the total consumption. Still, the compressor discharges the same amount of reactive power (Vars) as the compressors on the machines with the lower power factor and a lower peak consumption. Similar results were seen from all brands of refrigerated vending machines. While Dixie-Narco and Pepsi vending machines are documented in the power consumption graphs, machines from Royal Venders Incorporated and the Vendor Company operated with a similar power factor.
3.3 Data Analysis
Figures 13, 14, and 15 show the before and after graphs from three vending machines that are representative of the various machines that were tested. On all of the machines, it can be seen that at least a two ampere reduction was achieved through the implementation of power factor correction. On average, a 2.2 ampere reduction and a 0.26-KVA reduction was achieved per machine. Extrapolated over 180,000 machines in New York State, that corresponds to a 46,800-KVA reduction in coincident peak demand and a 40,600-KVA reduction in continuous load on the distribution system based on an 87% duty cycle for the equipment. Still 3.6% of energy is lost annually as distribution losses,and 88% of that is copper loss, resulting in 3.2% of all losses being distribution copper losses. Applying that to the 40,600-KVA reduction in average demand results in a 1300-KW average reduction in required generation and a 1500-KW reduction in peak generation related to the reduced currents resulting from power factor correction. Using the figure of a 1300 KW average power reduction yields a net annual savings of 11,388,000-KWH annually in reduced losses on the distribution system. In addition to savings on the utility’s distribution system there will also be significant
savings on the customer’s side of the meter within the customer premises. This will occur because of reduced heating within the premise’s wiring that is manifested as KWH on the utility bill. Measurements that we have taken at industrial locations indicated that raising the power factor from .7 to .96 can reduce KWH loss by as much as 5% to 7% within customer premises. A lower initial power factor will yield more dramatic KW savings resulting from power factor correction. The power factor of refrigerated vending machines is sufficiently bad that large KW reductions can be achieved through correction.
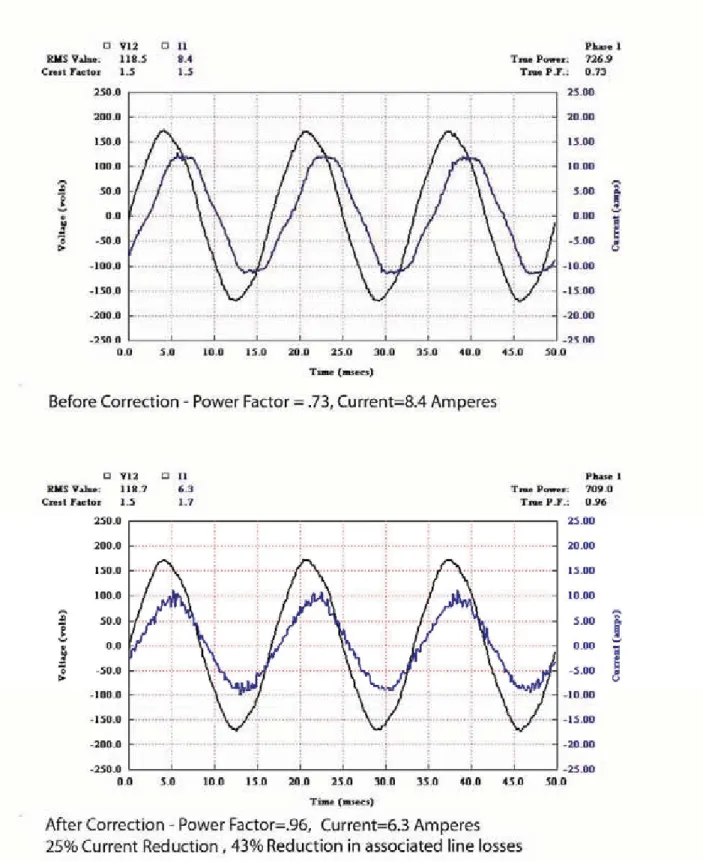
To test this concept we used a 120 Volt motor that operated at 4.65 amperes, within the current range of a refrigerated vending machine. We plugged it in to several receptacles throughout a five year old building, wired during 2004 to the electrical code being used at that time. As the building is relatively new, oxidation levels on the electrical components will be at a minimum. The building has approximately a 5000 square foot footprint and a 400 amp service that was only delivering approximately 18 amps per phase at the time of the tests. The receptacles were connected by approximately fifty feet of #12 wire to 15 amp circuit breakers in a sub panel. (50 feet of #12 copper wire will have a resistance of approximately 0.1 ohms.) That was in turn wired to a 200 amp circuit breaker in a main panel near the building service entrance. Because of the low building current at the time of the tests and the large size of the service relative to the 4.65 amp motor current, nearly all of the voltage drop would have occurred at the circuit breakers, within the 12 gauge wire, and the receptacle-plug interface. A 1.4 volt drop at a 4.68 amp current indicates a circuit resistance of approximately 0.3 ohms. For the Dixie-Narco machine, the waveform for which is shown in figure 14, the I2R line losses within the building before correction, with an 8.4 amp current and a 0.3 ohm circuit resistance, would be 21.17 watts (8.4 x 8.4 x 0.3). After correction, with the current at 6.3 amperes, the line
losses would be 11.9 watts (6.3 x 6.3 x 0.3) . The correction would yield a reduction of 9.27 watts on a circuit with a resistance of .3 ohms. In an older building, with increased levels of oxidation on the wire interfaces, the resistance and associated thermal losses could be considerably higher. Furthermore, refrigerated vending machines are primarily located in commercial buildings that could have much larger footprints than 5000 square feet. That would make the circuit lengths longer than fifty feet and increase the circuit resistance. While the after meter line loss savings for some machines may be less than 9-watts, the average age of the building stock in New York is also considerably older than five years. That would result in higher circuit resistances than the 0.3 ohms that we measured. Considering the variables of circuit length, circuit age, and the different machine capacities, the 9.27-watts is a reasonable average for after meter line losses, as they relate to refrigerated vending machines.
Based on the 425-watt average power consumption of the vending machines listed in the PG&E paper, 180,000 machines would consume 76,500-KW. A 2.2% reduction in customer premise losses, less than half of what we have previously measured at industrial locations, would yield a reduction of 1669-KW in required generation for losses incurred within customer premises. A 9.27-watt savings per machine on 180,000 machines would yield the same 1669-KW savings. The annual energy savings would be 14,620,440-KWH annually.
Based on efficiency improvements achieved on both the distribution system and within the customer premises as a result of “At Load” Power Factor Correction, the total savings for New York State are:
� 3,170-KW Reduction in required generation
� Minimally, a 26,008,440 annual reduction in KWH that includes 11,388,000-KWH on the utility’s distribution system and 14,620,440-KWH within the customer premises
In addition, our measurements indicated that the Power Factor Correction may raise the Total Harmonic Distortion of the current waveform by approximately 1%. At such a low level, the minimal increase in harmonics does not contribute a negative effect on the system.
Figure 13: Before and after waveforms from a Dixie-Narco vending machine. A 2.3 ampere (31%) current reduction was achieved through the use of power factor correction.
Figure 14: Before and after waveforms from a Dixie-Narco vending machine. A 2.1 ampere (25%) current reduction was achieved through the use of power factor correction.
Figure 15: Before and after waveforms from a Pepsi® High Visibility vending machine. A 2.3 ampere
--- 3.4 Cost Benefit Analysis
We will be making the following assumptions in performing the financial analysis based on figures for the Con Ed service area :
� $2,000 per KW to construct generation
� 13$-KVAR to install capacitance at the substation8
� $ 70 cost for a PLIP®. This is higher than what the cost will be if it is mass produced.
� 180,000 PLIP® ‘s will contain approximately 100,000-KVAR of capacitance.
� 26,008,440 annual reduction in KWH that includes 11,388,000-KWH on the utility’s distribution system and 14,620,440-KWH within the customer premises
� 3,170-KW reduction in necessary generation
� $ .05-KWH wholesale electricity price, $ .20-KWH retail electricity price
Using the figures above, the cost for 180,000 PLIP®‘s would be $ 12,600,000 and the savings are as follows: One time cost offsets
• Reduced generation (3170-KW @ $ 2000-KW) $6,340,000
• Reduced cost of capacitance at the substatio $1,300,000 $7,640,000 Annual cost offsets
• Reduced annual consumption (wholesale price) $1,300,422
Based on a $12,600,000 project cost, the Return on Investment (ROI) would be 3.8 years if the utility implemented the program. The figures above do not factor in reduced costs for reduced maintenance of the system because of reduced load, both within customer premises and on the utility’s portion of the system. While the reduction at each location is fairly small, these machines are very prevalent and reducing their combined effect on certain areas of the system could be the difference in portions of the system surviving a day of very high load.
8 New York Independent System Operator (NYISO), Benefits of Adding Capacitors to the Electric System , February 27, 2008, PP.14
In addition to savings on the utility system, the savings to the customer would be as follows:
(14,620,440-KWH x $.20)/180,000 machines = $ 15.84 per machine/yea.
If the utility customers purchased the devices, the Return on Investment (ROI) to improve the power factor on a vending machine would be approximately four years on a machine with a lifespan of ten years or more.
In addition to the short ROI for the equipment there are environmental benefits, as well. On average, every KWH of electric generation in the United States results in 1.5 pounds of CO2 emissions. The 26,008,440 annual reduction in KWH in New York State would result in a minimum reduction of over 19,500 tons of CO2 emissions annually. Those reductions cannot be achieved with capacitance installed at the substation.
If the standards for these machines were tightened to mandate a high power factor, the cost of a $4,000 machine would increase by approximately $20. Nevertheless, as the numbers above indicate, that amount would be recouped by the customer in approximately one year.
3.5 Conclusions
Based on our measurements, and results obtained measuring the electrical characteristics of refrigerated vending machines, we have come to the following conclusions:
• The power factor is sufficiently low in refrigerated vending machines that improving it will result in substantial energy savings throughout the entire utility system, when measured in KWH.
• We can cost effectively improve the power factor for existing refrigerated vending machines.
• Power Factor Correction in this environment does not measurably increase the amount of harmonics.
• Power Factor Correction in this environment will reduce CO2 emissions by a minimum of 19,500 tons annually for New York State.
• Power Factor Correction must be load based and must only operate when needed. Excess capacitance connected to the utility system can be as detrimental as excess inductance. Furthermore, in the event of a blackout, the excess capacitance would add extra impedance that would have to be energized, applying extra load to the system during a restart.
• Standards need to be modified so that new refrigerated vending machines are designed with a high power factor as part of the design criteria.
While the last item on the list will increase the price of the equipment, the accrued savings on energy will more than offset the additional cost.
PART 4 - MULTI�FAMIL RESIDENTIAL
4.0 Background and Conclusions � Multi�Family Residential
This section presents the results of applying “At Load” power factor correction to multi-family dwellings.
A 1991 census stated that there were between 17,000 and 20,000 buildings of 50 or more units within New York State. That provides a large “market” on which to implement this process. While much of this documentation will reference the New York Metropolitan Area as the work was done here, it is applicable to other areas of the country as well.
Conclusions that we have drawn from the work completed to date are the following:
• The power factor is sufficiently low in the multi-family environment that improving it will result in substantial energy savings throughout the entire utility system, when measured in KWH.
• We can cost effectively improve the power factor for existing apartment buildings in the near term.
• Standards need to be modified so that new multi-family buildings are designed with a high power factor and a balanced load as part of the design criteria. Compliance should be verified prior to a Certificate of Occupancy being issued.
• Standards need to be modified so that new appliances are required to have a high power factor as part of the design criteria. This includes refrigeration and, especially, air conditioners. Some of the newer 220 volt air conditioners operated with a power factor near 0.99. None of the 120 volt air conditioners operated with a power factor above 0.92, including the newest units that were less than a year old. Most of the measurements were taken on hot days, so the units would have been operating as efficiently as possible.
• Standards need to be modified so that new appliances and other electrical devices to be attached to the utility have more strict limits on the amount of electrical harmonics that they generate per watt of consumption. In particular, this will apply to computers, televisions,and fluorescent lighting. Harmonics, oscillations induced in the electrical power system, adversely affect electrical efficiency. Furthermore, harmonic mitigation can be very costly to implement.
• Power Factor Correction in this environment does not measurably increase the amount of harmonics measured at the utility transformer.
• Power Factor Correction must be load based and must only operate when needed. Excess capacitance connected to the utility system can be as detrimental as excess inductance. Furthermore, in the event of a blackout, the excess capacitance would add extra impedance that would have to be energized, applying extra load to the system during a restart.
4.1 Implementation
Implementation of the Power Factor Correction Project involved several steps.
1 Acquiring Funding: This was provided through a NYSERDA grant to offset the cost of equipment that would be installed on utility poles or within customer premises
2 Coordination with the utility: As we were attempting to determine the aggregate effect of “At Load” power factor correction, it was essential to perform measurements at the secondary (low voltage side) of the utility distribution transformer. Consolidated Edison was extremely cooperative in this regard. Itprovided the funding and the personnel to install the power monitors on the utility poles. After consulting with Con Ed about the requirements, we designed and built power monitors that were mounted by Con Edison personnel on the poles. After we chose a neighborhood, they also assisted with choosing transformers that would be optimal in achieving our goal.
3 Test Sites: We needed utility customers whowould be willing to participate in a trial of this type. We were fortunate because the residents of Hilltop Terrace were very willing participants. It is a true leap of faith for homeowners with a non-technical background to let a stranger into their home to correct a reactive power “problem” that they didn’t even know existed. In addition to having cooperative residents, Hilltop Terrace was ideal in that it was fairly typical of much of the housing stock in the New York area. It is a garden apartment complex that was built circa 1965. As there are 80 units in five buildings, serviced by one transformer, the data will also be fairly representative of a 40 to 200 unit dwelling without central air conditioning, scaled for the number of units. There is a mix of one, two, and three bedroom units. Air Conditioning consisted of 120 volt and 220 volt air conditioners mounted in “through-the-wall” sleeves. The first complex that we sought to use for the trial did not want to participate. It was a complex of rental units. The landlord had little incentive to participate, as they did not pay the utility bills for the apartments. In contrast, Hilltop Terrace is a cooperative where the tenants own the apartments.
4 Power Monitors: The essential part of any project of this type is having accurate data. We designed and built a monitor with more capability than we thought we would need. Our reasoning was that it would be far easier to ignore unneeded data than to collect extra data from a meter that didn’t have the capability. As such, each monitor collects several hundred