Introduction to the Global Trade Analysis Project and the
GTAP Data Base
By
Terrie L. Walmsley*
Angel H. Aguiar*
Badri Narayanan*
GTAP Working Paper No. 67
2012
I
NTRODUCTION TOT
HEG
LOBALT
RADEA
NALYSISP
ROJECT AND THEGTAP
D
ATAB
ASE1. Introduction
The Global Trade Analysis Project (GTAP) is a global network of researchers and policy makers conducting quantitative analysis of international policy issues. The motivation and ultimate success of the Project stems from the fact that collaboration is essential for detailed analysis of the global economy. The importance of collaboration to improve the quality of policy analysis world-wide is most clearly seen in the development of the GTAP Data Base. The GTAP Data Base is the centerpiece of the Global Trade Analysis Project. It records the annual flows of goods and services for the entire world economy in the benchmark year(s). It consists of bilateral trade, transport, and protection matrices that link individual country/regional economic data bases.
The production of the GTAP Data Base relies on the valuable contributions of many individuals and organizations throughout the world. Individuals contribute the best available input-output table for their country, while other experts contribute the macro, trade, protection and other data required. The Center for Global Trade Analysis, the home of GTAP, then brings these contributions together into one useable, globally consistent, database. The result is a fully documented publicly available and regularly updated global database (Narayanan, Aguiar and McDougall, 2012). This year (2012), the eighth version of the GTAP Data Base was released, covering 129 countries, 57 sectors, 5 factors and two base years (2004 and 2007).
The GTAP Data Base is utilized in a suite of comparative static and dynamic computable general equilibrium models and underlies most contemporary economic analysis of global policy issues related to trade, energy and the environment. Collaboration in the development of the global database has allowed researchers to concentrate on the economics, and has dramatically improved the quality of global economic analysis.
The purpose of this paper is to introduce you to the GTAP Data Base, and in doing so, to the Global Trade Analysis Project.
2. The GTAP Data Base and Satellite Datasets
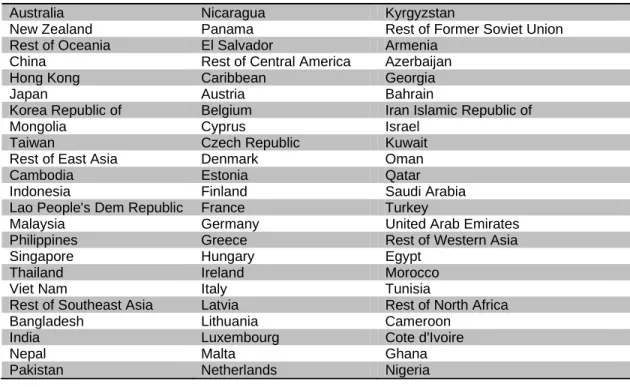
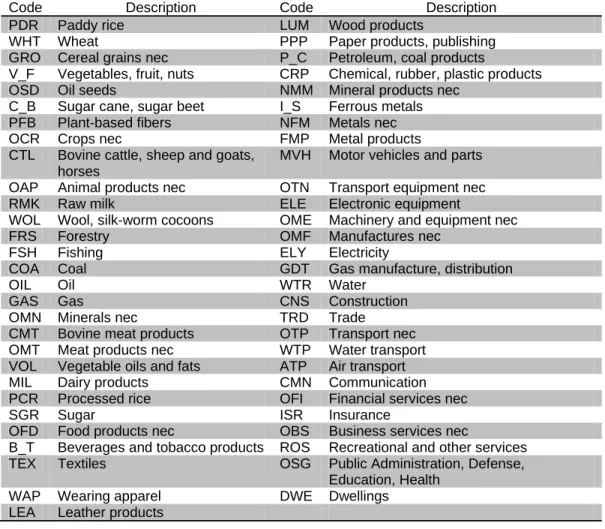
The latest version of the GTAP Data Base, version 8, contains data on 129 countries (Table 1), 57 sectors (Table 2) and 5 factors (land, skilled labor, unskilled labor, natural resources, and capital). For the first time in the history of the GTAP Data Base, version 8 consists of two base years: 2004 and 2007. The GTAP Data Base has also expanded to include a number of satellite datasets in new areas, such as energy volumes, land use, CO2 emissions and international migration. This expansion into
new areas has been the result of research projects between the Center, advisory board members, and other network members.
In the following sections we first illustrate the structure of the standard GTAP Data Base, followed by a discussion of the individual components and the current set of satellite datasets which accompany the GTAP Data Base.
3. What does the GTAP Data Base include?
Figure 1 illustrates the basic structure of the GTAP Data Base, ignoring taxes. The arrays shown in this figure exist for each region, where additional regional arrays are signified by the dashed arrays. Each region’s economy is summarized by sales or uses of the 57 domestic and imported commodities (rows I and II respectively) and of the 5 factors of production (Row III) across the rows; while inputs into production of the 57 commodities are shown in column I. The notation used matches the nomenclature used in the GTAP Data Base and model, and follow the format “V” for value; “D” or “I” for domestic or imports; “P”, “G”, “F” or “X” for private, government, firm/intermediate or export demand respectively; and “M” for market prices. In Figure 1 all values are at market prices, which are exclusive of taxes but inclusive of domestic margins. Domestic sales of domestic and imported goods and factors are also valued inclusive of commodity and factor use taxes in the Data Base, as signified by “A” for agent prices (e.g., VDFA). As is customary in I-O tables, total sales, exclusive of taxes, shown in the first row of Figure 1, should equal total costs, given by the sum of the first column, plus or inclusive of taxes.
Table 1. 129 Regions in the GTAP 8 Data Base1
Australia Nicaragua Kyrgyzstan
New Zealand Panama Rest of Former Soviet Union Rest of Oceania El Salvador Armenia
China Rest of Central America Azerbaijan
Hong Kong Caribbean Georgia
Japan Austria Bahrain
Korea Republic of Belgium Iran Islamic Republic of Mongolia Cyprus Israel
Taiwan Czech Republic Kuwait
Rest of East Asia Denmark Oman
Cambodia Estonia Qatar
Indonesia Finland Saudi Arabia
Lao People's Dem Republic France Turkey
Malaysia Germany United Arab Emirates
Philippines Greece Rest of Western Asia Singapore Hungary Egypt
Thailand Ireland Morocco
Viet Nam Italy Tunisia
Rest of Southeast Asia Latvia Rest of North Africa
Bangladesh Lithuania Cameroon
India Luxembourg Cote d'Ivoire
Nepal Malta Ghana
Pakistan Netherlands Nigeria
1
A list of the country I-O tables, their contributors and documentation for each country is provided on the GTAP website: https://www.gtap.agecon.purdue.edu/databases/regions.asp?Version=8.211 .
Sri Lanka Poland Senegal
Rest of South Asia Portugal Rest of Western Africa
Canada Slovakia Central Africa
United States of America Slovenia South Central Africa
Mexico Spain Ethiopia Rest of North America Sweden Kenya
Argentina United Kingdom Madagascar
Bolivia Switzerland Malawi
Brazil Norway Mauritius
Chile Rest of EFTA Mozambique
Colombia Albania Tanzania United Republic of
Ecuador Bulgaria Uganda
Paraguay Belarus Zambia
Peru Croatia Zimbabwe
Uruguay Romania Rest of Eastern Africa Venezuela Russian Federation Botswana
Rest of South America Ukraine Namibia Costa Rica Rest of Eastern Europe South Africa
Guatemala Rest of Europe Rest of South African Customs Union Honduras Kazakhstan Rest of the World
Table 2. 57 Sectors2 in the GTAP Data 8 Base
Code Description Code Description
PDR Paddy rice LUM Wood products
WHT Wheat PPP Paper products, publishing GRO Cereal grains nec P_C Petroleum, coal products
V_F Vegetables, fruit, nuts CRP Chemical, rubber, plastic products OSD Oil seeds NMM Mineral products nec
C_B Sugar cane, sugar beet I_S Ferrous metals PFB Plant-based fibers NFM Metals nec OCR Crops nec FMP Metal products CTL Bovine cattle, sheep and goats,
horses
MVH Motor vehicles and parts
OAP Animal products nec OTN Transport equipment nec RMK Raw milk ELE Electronic equipment
WOL Wool, silk-worm cocoons OME Machinery and equipment nec FRS Forestry OMF Manufactures nec
FSH Fishing ELY Electricity
COA Coal GDT Gas manufacture, distribution
OIL Oil WTR Water
GAS Gas CNS Construction
OMN Minerals nec TRD Trade CMT Bovine meat products OTP Transport nec OMT Meat products nec WTP Water transport VOL Vegetable oils and fats ATP Air transport MIL Dairy products CMN Communication PCR Processed rice OFI Financial services nec
SGR Sugar ISR Insurance
OFD Food products nec OBS Business services nec
B_T Beverages and tobacco products ROS Recreational and other services TEX Textiles OSG Public Administration, Defense,
Education, Health WAP Wearing apparel DWE Dwellings LEA Leather products
Sales/Uses also include sales of transport or margin commodities to the global transportation pool (VST), which are used to supply international transportations services for exporting goods from one country to another (VTWR in Figure 2). Three of the 57 GTAP commodities are also modes of transport or margin commodities in the GTAP Data Base (air (atp), water (wtp) and other (otp) transport) corresponding to the three margins in Figure 2. Figure 2 illustrates how the value of exports at market prices by destination (VXMD where “D” signifies destination) are linked to the value of imports at market prices by source country (VIMS where “S” signifies source) by export taxes/subsidies (XTAXD, shown in the header XTRV of the data file), transportation margins (VTWR) and import duties (MTAXD, shown in the header TFRV of the data file). Since GTAP was initially introduced as a trade model each of these wedges is separately identified in the GTAP Data Base by commodity (57), source (129) and destination (129), along with trade at f.o.b and c.i.f prices.
2
Mappings between these sectors and standard classification codes such as ISIC and CPC are available: https://www.gtap.agecon.purdue.edu/databases/contribute/concordinfo.asp .
6
Figure 1. Simplified view of the GTAP Data Base Structure (excluding commodity taxes)
Domestic activities (57) Other countries (129) Global Transport (1) Investment (cgds) (1) Private Consumption (1) Government (1) Domestic Commodities (57) Imported Commodities (57) Factors (5)
N.B Commodity taxes are applied to all values except exports (VXMD and VST). Values inclusive of taxes end in “A” for agent prices instead of “M” for market prices.
VIFM V I F M V D F M V D P M V I P M V D G M V I G M VXMD VDFM VFM V S T
7
Figure 2. Link between Exports and Imports
VXMD XTAXD VXWD VTWR (air/atp) VTWR (other/otp) VTWR
(water/wtp) VIWS MTAXS VIMS
+ = + = + = + + Export Taxes Transportation margins Import Tariffs f.o.b Prices c.i.f Prices Exports Imports
The value of imports by commodity, source and destination at market prices by source (VIMS) are equal to the value of imports by commodity purchased by firms (VIFM), government (VIGM), investment (VIFM) and private consumption (VIPM), also at market prices. However, the standard GTAP Data Base does not separate imports by source and purchaser/agent, although versions of GTAP in this MRIO structure are available (more details below).
In addition to I-O, trade margins, trade taxes and commodity taxes data, the GTAP Data Base also includes income taxes, savings (SAVE), capital stocks (VKB), depreciation (VDEP), and population (POP) data for each country/region. There are also a number of satellite data sets which are discussed below.
4. Where does the Data in the GTAP Data Base come from?
As mentioned in the introduction all of the datasets used in constructing the GTAP Data Base are contributed by various individuals in the network.
Contributors must provide the IO data in a particular format: Tables must balance and should include at least 30 sectors, with certain mandatory split (Huff, McDougall and Walmsley, 2000). On the other hand, IO tables do not have to match the base year of the GTAP Data Base or contain detailed data on land usage or commodity taxes.
The quality of IO tables can vary considerably across countries. While contributors are expected to provide as much data as possible, over the years the Center has had to collect a number of additional data to reinforce the quality of the IO tables. For instance, many IO tables do not have the level of agricultural detail required for the GTAP Data Base and hence additional agricultural IO data are collected from the FAO and processed by Everett Peterson (2008) to assist with the disaggregation of the agricultural commodities in some IO tables. Other issues include splitting labor returns by skill (Liu, van Leeuwen, Vo, Tyers and Hertel, 1998), and the inclusion of land and natural resources. Agricultural and Energy have also been identified by the network as areas where additional processing of the IO tables is required to ensure consistency with global data sources (e.g., IEA, OECD and Eurostat). Additional data on income taxes (based on IMF data) are also collected and incorporated into the GTAP Data Base. Agricultural domestic support data is contributed by Hsin Huang for the OECD-member countries (other than EU members) and Hans Jensen for the EU-27 countries.
Macroeconomic data is obtained from the World Bank and are used to ensure that the country IO data match the macro data for the base year.3Trade Data is taken from the COMTRADE database, reconciled by Mark Gehlhar (Gehlhar, 1996) with some adjustments for re-exports with the assistance of Zhi Wang, USITC and Nico
3
In particular the GDP implied by the IO table must also match the GDP supplied in the macro data. A common question is what exchange rates are used. The answer is those implied by the GDP data provided by the World Bank.
van Leeuwen from the CPB. Services trade data are also compiled by Nico van Leeuwen and Arjan Lejour from the CPB using data collected from the OECD and IMF. Protection data is contributed by CEPII and the ITC-Geneva and export subsidies by David Laborde (IFPRI).
5. Ensuring consistency amongst the Data
The GTAP Data Base is a globally consistent database. This means that all the data are internally consistent, despite coming from different sources. Moreover the GTAP Data Base must satisfy certain adding up constraints that one would expect to see within an economy and across the world as a whole.
When the data are first collected they are not globally consistent. Global exports do not match global imports. Even on a bilateral basis, exports to Tanzania reported by the USA are unlikely to match imports from the USA reported by Tanzania. Even after transportation costs and taxes are taken into account the differences between the values are still evident due to data collection issues. Moreover these trade data should also match the imports reported in the each individual country’s I-O table, which are generally collected in an entirely different way from the trade data.
While such problems with data are considered normal, general equilibrium models require that the data match and that there are no leakages. In order to reconcile these different data sources, decisions need to be made about which data to believe and which data should adjust to ensure consistency. These decisions are based on our beliefs about the relative reliability of the data sources, expert advice and the experiences of the Center staff in reviewing and developing the GTAP Data Base.
In general we require that each contributor of a dataset ensure that the dataset is internally consistent before it is sent to us: for example, in the contributed trade dataset, exports must equal imports once differences in valuation are taken into account. This reflects the fact that the contributors know their datasets better than we do and hence are in a better position to make decisions about the quality of inconsistent data. For instance, Mark Gehlhar produces a globally consistent goods trade database using reliability indexes (Gehlhar, 1996).
Our task is then to ensure consistency amongst the different datasets contributed. To do this we rank the reliability of the datasets: the goods trade data is assumed to be the most reliable dataset, followed by the macro data, energy data etc, with the IO tables being listed as the least reliable dataset. The FIT process is used to fit the data using entropy theoretic methods (James and McDougall, 1993). The IO tables therefore undergo the largest changes during this FIT process to reflect the additional macroeconomic data collected. The extent of the changes depends on the age and quality of the underlying IO table – good tables generally match the macro data and therefore change only minimally.
6. What are the GTAP Satellite Data sets?
The GTAP satellite datasets have often been developed as a result of research projects designed to extend the GTAP Data Base, model and policy analysis into new areas. Some of these datasets are now being updated on a regular basis and made available as part of the main GTAP Data Base or as alternative programs.
1. Time series trade shows the bilateral goods trade (for 42 GTAP sectors) valued at f.o.b (VXWD) between 1992 and 2009.
2. Energy volumes (e.g., EDG) and CO2 emissions (e.g., MIF) by use (see Figure 3) are also provided for all energy commodities (Coal, Oil, gas, Petroleum and coal products, electricity and gas distribution). Energy volumes are in million tons of equivalents. These data are useful for the GTAP-E model, an extension of the GTAP model.
3. The Dynamic GTAP (GDyn) Data Base contains additional data on foreign income flows, normal growth rates, rates of return, as well as additional convergence parameters all required for running the Dynamic GTAP model (Ianchovichina and Walmsley, 2012).
4. The Migration (GMig2) Data Base contains additional data on labor force by country of origin, wages and remittances, as well as additional parameters required by the GMig2 model (Walmsley, Winters and Ahmed, 2007).
11
Figure 3. Structure of Energy Volumes (E) and CO2 Emissions (M)
Domestic activities (57) Other countries (128) Global Transport (1) Investment (cgds) (1) Private Consumption (1) Government (1) Domestic Energy Commodities (6) Imported Energy Commodities (6) EIF MIF EIF MIF EDF MDF EDP MDP EIP MIP EDG MDG EIG MIG EXI EDF MDF
5. Land Use Data Base contains disaggregated land data by use. Land is disaggregated into 26 AEZs and work is taking place to disaggregate land even further (Baldos and Hertel, 2012).
6. Non-CO2 emissions contains data on other green house gases by use, similar to the CO2 emissions arrays (Figure 3).
7. GTAP MRIO datasets: The standard GTAP Data Base is not in the MRIO format, because it does not separate imports of each commodity by agent, source and destination. Instead we account for imports of each commodity purchased by agent in each destination (VIFM, VIGM, VIPM); and for total imports of each commodity by source and destination (VIMS). A number of people in the GTAP network have taken the GTAP Data Base and used shares from the commodity, destination, and source specific import data (VIMS in Figure 2) to further split imports by agent (VIPM, VIGM, VIFM in Figure 1) across sources: thereby producing a basic MRIO (Peters, Andrew and Lennox, 2010). For example, this work splits USA imports of Coal from China into imports by firms, government and private households using the average share of US coal imports coming from China. Recently, Marinos Tsigas, and Zhi Wang (US International Trade Commission), and Mark Gehlhar (US Department of Interior) utilized additional information from the trade data to construct a GTAP MRIO that more accurately depicts the differences between agents’ sourcing of imports (Tsigas, Wang and Gehlhar, 2012).
7. What does the GTAP Data Base look like?
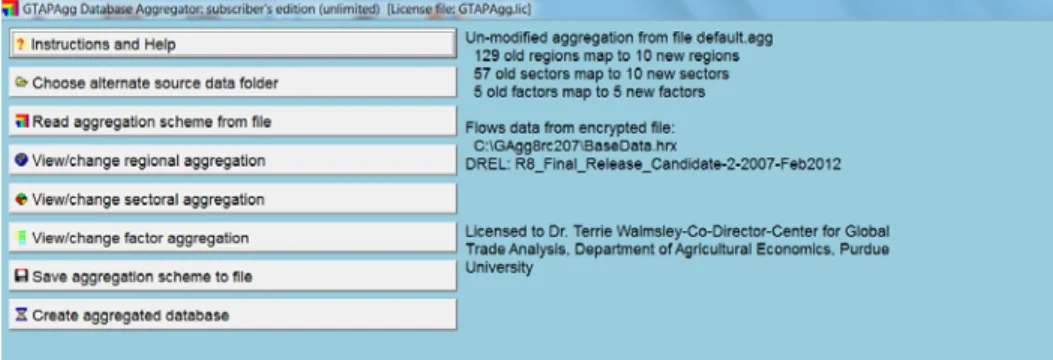
When you download the GTAP Data Base you generally obtain two programs. The first is GTAPAgg, a user friendly aggregation program (Figure 4); the second, FlexAgg contains a DOS based aggregation program.
Both aggregation programs can be used to create your own aggregation of the GTAP Data Base, including the fully disaggregated database.4 Files received include:
sets.har contains all the sets you will need to read the data and/or run the model (e.g., REG: regions, TRAD_COMM: commodities, ENDW_COMM: factors)
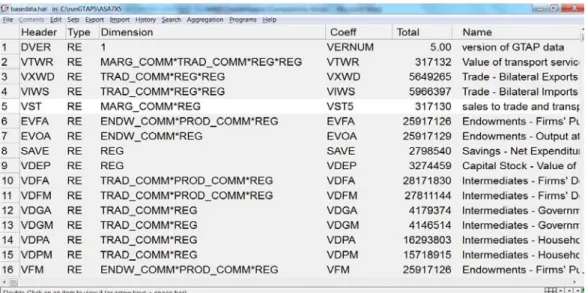
basedata.har contains the main GTAP Data Base outlined above in Millions of US dollars. When opened the basedata.har file looks like Figure 5, where each data array is stored in a header. The headers correspond to the names provided in Figures 1 and 2 for the data arrays.
Figure 5. Basedata.har file
default.prm contains the elasticities used in the GTAP model. The elasticities are obtained from the literature and include armington elasticities, income and substitution parameters, elasticities of substitution between value added etc.
baseview.har and baserate.har contains useful summary tables and tax rates.
GTAPSam.har contains the data in a useful SAM structure (McDonald and Theirfelder, 2004).
TSTRADE.har contains time series trade data.
gsdvole.har contains energy volumes data.
CO2.har contains CO2 emissions.
Note that the Dynamic GTAP, migration, land use, Non-CO2 emissions and inter-regional flows datasets are not included in the GTAPAgg program at this stage. They are included in their own FlexAgg (or other DOS based programs) which are available separately.
4
In fact we recommend that if you wish to look at the full GTAP Data Base that you create a 1:1 aggregation and view the data that way. The reason for this is that the HRX file in GTAPAgg is encrypted and therefore cannot be viewed properly.
Most of the data are contained in header array format (file extension har). These files are part of the GEMPACK software suite, developed at the Centre of Policy Studies (CoPS), Monash University, under the direction of Ken Pearson and more recently Mark Horridge (Harrison and Pearson, 2007). Programs for viewing these files come with the accompanying aggregation programs.5
8. Tools for manipulating the GTAP Data Base
Over the years a number of tools have been developed to manipulate the GTAP Data Base and new programs are being developed all the time by the GTAP network members to expand and manipulate the data and model. Below is a list of some of the tools available to users:
- First, the parameters or elasticities can be altered by changing the parameters file directly using the advanced editing menu in ViewHAR (see help file for instructions).
- Second, network members interested in adding additional commodity details can use SplitCom (Horridge, 2008).
- Third, Altertax is a special simulation that allows you to alter a tax in the database with minimal changes to the rest of the database. This is useful if you disagree with a particular tax rate in the database or if a tax was not included (Malcolm, 1998).
- MyGTAP is a program that allows you to disaggregate endowments or include multiple households for one or more regions/countries, as well as include other transfers between those households or between households and government (Minor and Walmsley, 2012). It also includes data on foreign remittances and aid payments.
- Finally, users are often interested in updating the GTAP Data Base to a more recent year. This can be done through a model simulation. Baseline data or forecasts are available on the GTAP website to assist users with this task.
- TASTE is a program which can be used to access detailed trade and tariff data (Horridge and Laborde, 2008).
9. Uses
In order to operationalize this large database, a standard modelling framework has been developed (Hertel, 1997). This multi-region, applied general equilibrium, model is relatively standard and easy to modify and extend. A number of extensions have been developed and are available on the GTAP website6, including features such as
5
Those interested in converting the files to GAMs for use with GAMs based models are referred to http://www.mpsge.org/GTAP8inGAMS.zip or McDonald S. and K. Theirfelder, “Deriving a Global Social Accounting Matrix from GTAP Data Base”, GTAP Technical Paper No. 22, Global Trade Analysis Project, 2004. https://www.gtap.agecon.purdue.edu/resources/res_display.asp?RecordID=1645 . 6
imperfect competition, technology spillovers, detailed treatment of energy demands and CO2 emissions, agricultural commodity markets, as well as multiple household
for poverty analysis, migration and dynamics.
There are currently more than 2,000 documented applications on the GTAP website, which represents just a small fraction of the total number of applications undertaken. These applications are aimed at addressing a great variety of issues including trade policy reform, regional integration, energy policy, global climate change, technological progress, and links between economic growth and trade, among other topics.
10. A short history of development
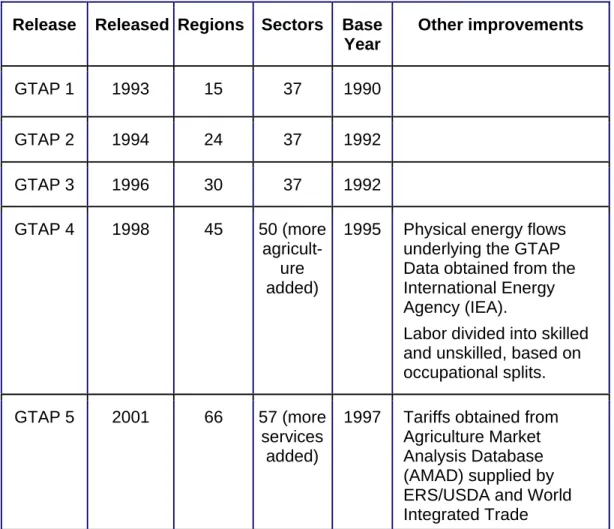
The GTAP 8 Data Base builds heavily on earlier work at Purdue, as well as research and data base development efforts at a number of national and international agencies. Indeed, the earliest versions of the GTAP Data Base built very heavily on the SALTER Project which was undertaken at the Australian Industry Commission during the 1980s and early 90s. Table 3 below shows the gradual expansion of regional and sectoral coverage since 1990 when the first version was released, along with some of the other major improvements in the database.
Table 3. Timeline of GTAP Data Base Releases
Release Released Regions Sectors Base Year Other improvements GTAP 1 1993 15 37 1990 GTAP 2 1994 24 37 1992 GTAP 3 1996 30 37 1992 GTAP 4 1998 45 50 (more agricult-ure added)
1995 Physical energy flows underlying the GTAP Data obtained from the International Energy Agency (IEA).
Labor divided into skilled and unskilled, based on occupational splits.
GTAP 5 2001 66 57 (more
services added)
1997 Tariffs obtained from Agriculture Market Analysis Database (AMAD) supplied by ERS/USDA and World Integrated Trade
Software (WITS) provided by World Bank and
UNCTAD.
GTAP 6 2005 87 57 2001 MAcMap data base for
tariffs and import protection provided by CEPII and ITC-Geneva.
GTAP 7 2008 113 57 2004 Bilateral Services trade
data contributed by the CPB.
Agricultural export subsidy data contributed by Aziz Elbehri,
ERS/USDA
More comprehensive domestic support data from OECD, contributed by Hsin Huang and Hans Jensen.
GTAP 8 2012 129 57 2004
2007
More comprehensive export subsidies data contributed by David Laborde, IFPRI. Inclusion of CO2 emissions and other satellite datasets.
Improvements and revisions to the GTAP Data Base are taking place all the time as underlying data are improved and users, needing additional data themselves, contribute to expanding the GTAP Data Base. We strongly encourage those with expert knowledge in particular datasets to get involved so that better data and tools for economic analysis can be made publicly available. We rely heavily on the contributions of our network and board members, without whom the GTAP Data Base would not exist.
Resources
Resources for IO table contributors are available at:
Other free datasets and utilities are available at
https://www.gtap.agecon.purdue.edu/resources/free_resources.asp. RunGTAP and GTAP Model are available at:
https://www.gtap.agecon.purdue.edu/products/rungtap/default.asp Technical Paper Series is available at:
https://www.gtap.agecon.purdue.edu/resources/tech_papers.asp
Acknowledgements
References
Baldos, U. and T. Hertel, "Development of a GTAP 8 Land Use and Land Cover Data Base for Years 2004 and 2007." GTAP Research Memorandum No. 23, Global Trade Analysis Project, 2012.
Gehlhar, M., “Reconciling Bilateral Trade Data for Use in GTAP.” GTAP Technical Paper No. 10, Global Trade Analysis Project, 1996.
Harrison, J. and K. R. Pearson. 2007. GEMPACK User Documentation Release 8.0. Centre of Policy Studies and Impact Project Monash University, Melbourne, Australia.
Hertel, T.W., ed., “Global Trade Analysis: Modeling and Applications.” Cambridge University Press, 1997.
Horridge, M., “SplitCom: Programs to disaggregate a GTAP sector Centre of Policy Studies.” Monash University, 2008.
Horridge, M. and D. Laborde, "TASTE: a program to adapt detailed trade and tariff data to GTAP-related purposes." Presented at the 11th Annual Conference on Global Economic Analysis, Helsinki, Finland, 2008.
Huff, K., R. McDougall and T. Walmsley, “Contributing Input-Output Tables to the GTAP Data Base.” GTAP Technical Paper No. 1, Global Trade Analysis Project, 2000.
Ianchovichina, E.; and Walmsley, T. L., Editors: “Dynamic Modeling and
Applications in Global Economic Analysis.” Cambridge University Press, 2012.
James, M. and R. McDougall, “FIT: An input-output data update facility for SALTER.” SALTER working paper 17, Industry Commission, Canberra, 1993.
Liu, J., N. van Leeuwen, T. Vo, R. Tyers and T. W. Hertel, "Disaggregating Labor Payments by Skill Level in GTAP." GTAP Technical Paper No. 11, Global Trade Analysis Project, 1998.
Malcom, G., “Adjusting Tax Rates in the GTAP Data Base.” GTAP Technical Paper No. 12, 1998.
McDonald, S. and K. Theirfelder, “Deriving a Global Social Accounting Matrix from GTAP Data Base.” GTAP Technical Paper No. 22, Global Trade Analysis Project, 2004.
Minor, P. and T. L. Walmsley, "MyGTAP Model and Data Program - A New Regional Accounting System and Demand Function (LES)." paper presented at the 2012 Conference in Global Trade Analysis, Geneva, Switzerland, 2012.
Narayanan B.G., A. Aguiar and R. McDougall, Editors: “Global Trade, Assistance, and Production: The GTAP 8 Data Base.” Center for Global Trade Analysis, 2012.
Peters, G., R. Andrew, and J. Lennox. “Constructing an Environmentally extended Multi-Regional Input–Output Table Using the GTAP Data Base.” Economic Systems Research, 2011, Vol. 23(2), June, pp. 131–152, 2011; Rutherford, T., J. Carbone, and C. Böhringer. “Using Embodied Carbon To Control Carbon Leakage.” Presented at the 14th Annual Conference on Global Economic Analysis, Venice, Italy, 2011; and Reimer, Jeff. “The Domestic Content of Imports and the Foreign Content of Exports.” International Review of Economics and Finance, 2010.
Tsigas, M., Z. Wang and M. Gehlhar, “How a Global Inter-Country Input-Output Table with Processing Trade Account can be constructed from GTAP Database”, presented at 2012 Conference on Global Economic Analysis, Geneva, 2012.
Walmsley, T. L., L. A. Winters and S. A. Ahmed, "Measuring the Impact of the Movement of Labor Using a Model of Bilateral Migration Flows." GTAP Technical Paper No. 28, 2007.