Optimization Online Analytical Processing (OLAP)
Data Sales Door Case Study CV Adilia Lestari
Setiawansyah
1, Ayi Bayyinah
2, Nuroji
31
(Faculty of Engineering and Computer Science , University Teknokrat Indonesia, and Lampung)
2
(Computer Science, Budi Luhur University, and Jakarta)
3
(Computer Science, Muhammadiyah Prof. Dr. Hamka University, and Jakarta)
--- ***********************
---Abstract:
Sales transaction data in the sales division related to sales data goods so large and many that require large storage media and difficult to process these data for the preparation of reports used by management for decision making. Online Analitycal Processing (OLAP) is a method of approach to present the answers to the demand for a rapidly dimensional analysis process, ie the design of applications and technologies that can collect, store, manipulate a multidimensional data for analyst purposes. OLAP is part of a more global category of business thinking, which also summarizes the relationship between reporting and data mining. Use of this prototype helps executive informations system in generating monthly goods sales report that is 0,022259399998 sec, sales report top 10 that is 0,0223899998998 second, sales report down 10 that is 0,0210279999301 second, report sales by province that is 0,0399869999535 second, report Sales by district are 0.0133039000143 seconds. So it can help generate reports faster sales data and compliance report generated from the resulting prototype has in common with the existing report format so that the prototype is right in generating the report. OLAP technology can facilitate stakeholders in making decisions based on existing transactional data because OLAP will display data from various sides or multidimens.
Keywords— Data Warehouse, Online Analitycal Processing, Extraction, Transformation, Loading.
---
*********************
---1. INTRODUCING
Business needs are increasingly affect the business competition in many
companies that utilize information
technology. Competition aims to obtain
benefits that utilize information
technology in simplify the business process. One of the convenience offered is the use of information technology to support decision making in running
business processes that exist in medium-scale companies and above that have large amounts of data. A company's progress factor is its ability to analyze the market well. Behavior of consumers can be able to be captured properly by the company in this case of course the managerial to be evaluated, analyzed so as to produce a strategic policy.
Evaluation, planning, and
making activities can be done better if an organization or company has complete, fast, accurate, and accurate information (Syamsi, 2000) [1].
Sales transaction data in the sales division related sales data items so large and many that require large storage media and difficult to process the data for the making of reports used by management for decision making. Processing sales data to produce reports takes quite a long time because it is still processed with the help of microsoft excel application. The number of sales transactional data stored can not be used as the basis of analysis before further processing of data to be used as a basis by the level of top level
management in taking a decision
(Atmosudirjo, 2000) [2].
Online Analitycal Processing (OLAP) is a method of approach to present the answers to the demand for a rapidly dimensional analysis process, ie the design of applications and technologies that can collect, store, manipulate a
multidimensional data for analyst
purposes. OLAP is part of a more global category of business thinking, which also summarizes the relationship between reporting and data mining. The OLAP database has its own schema structure and is usually a data warehouse. Data warehouse is a collection of data from various sources stored in a data repository (repository) in large capacity and used for decision making process. But it is not possible OLAP to take from this operational database with the record this database has a design structure that OLAP friendly (Prabhu, Jaideep, Rajesh, Mark, 2005) [3].
2. LITERATURE REVIEW
2.1. Online Analytical Processing (OLAP)
According to Turban, Sharda, Delen, and King (2011) [4] the main operational structure in OLAP is based on a concept called a cube. Cube in OLAP is a multidimensional data structure (actual or virtual) that allows fast data analysis. The arrangement of data into the cube aims to overcome the limitations of relational databases. Relational databases are not suitable for rapid and close analysis of large amounts of data. Instead, they are more suitable for manipulating records (adding, deleting, and updating
data) that represent a series of
transactions. According to Scheps (2008) [5] Online Analytical Processing is a concept of multidimensional data with the
concept of data acquisition of
transactional corporate. Not only
aggregating data, OLAP provides the ability of the BI system to view data in new ways.
2.2. Methodology Agile
Agile software engineering is an iterative process model that provides a
viable alternative to conventional
methods for building different types of software and various types of software development projects (Pressman, 2012) [6]. Agile software development is the Method of some set of principles for
software development where the
requirements and solutions through the collaborative efforts of the functional and client team These supportive adaptive
planning, evolutionary development,
improvement, and it encourages rapid response and flexible to change. These principles support the definition and evolution of many software development methods (Larman, 2004) [7].
Agile software development
interactions and personnel are more important than processes and tools, software that functions more important
than complete documentation,
collaboration with clients is more important than contract negotiations, and responsiveness to change is more
important than following a plan.
However, just like any other process model, agile software development has advantages and is not suitable for all types of projects, products, people and situations. Agile software development allows a process model that is tolerant to changing needs so that changes can be quickly addressed.
According to agile alliance there are 12 (twelve) principles are for those who want to succeed in the application of agile software development:
1. Customer satisfaction with initial delivery and delivery. software that is worth continuously.
2. Accept changes in demand, even in
final development.
3. Software developments are
delivered frequently every week. 4. Always close coordination between
clients and software developers.
5. Projects built around motivated
individuals, who can be trusted. 6. Face to face conversation is the best
form of communication.
7. Software work is the main measure
of progress.
8. Continuous development, able to
maintain stable workmanship
speed.
9. pay attention to technical excellence and good sustainable design
10. The simplicity of maximizing the number of jobs is not done-very important.
11. The best architecture, requirements, and designs come from self-regulating teams
12. The team reflects on how to be
more effective, and adjusts
regularly.
3. METHODOLOGY
Data warehouse design used in this
study is Nine Step Methodology
(Kimball, 2010) [8] with the following steps
1. Choosing The Process
The election stage of this process is done by selecting the
subject matter of the data
warehouse to be created, then the business process related to the subject matter is identified. The process required in the analysis is the sale of goods on CV Adilia Lestari Bandarlampung.
2. Choosing The Grain
Stages of selection of sources of goods selling process on CV Adilia Lestari is to choose the data source to be analyzed for data warehouse:
a. The customer is the customer data that make the purchase transaction on the company.
c. The district is the district data location / where the customer is located.
d. Province ie provincial data location / where the customer is located.
e. The driver is a driver data that will deliver the goods to the customer.
f. Sales ie sales data that became the company's main goal in the process of selling goods.
3. Identifying and Conforming The Dimensions
Stages of identification and adjustment of dimensions of the process of selling goods on CV
Adilia Lestari is to identify
dimension tables for each fact table that exists.
4. Choosing The Fact
Stages of the fact table of the process of selling goods on CV Adilia Lestari is to select the fact table to be the main table in the data warehouse sales sales facts.
5. Storing Pre-Calculation in The Fact Table
This stage selects the table of facts of sales that can be calculated the total price and total pay with the aim of doing calculations if the table of facts lose statement.
6. Choosing The Duration of Database
This stage selects the duration of the database to be used in the data warehouse sales with a duration of 7 years starting from 2010 to 2017.
7. Tracking Slowly Changing Dimension
This step observes changes to the dimension table.
8. Deciding The Query Priorities and The Query Models
This stage is focused on the physical design for the data warehouse. This stage performs a query priority for the sales data warehouse that will execute the query command to generate the output sales graph that will be the goal in the design of the data warehouse sales on CV Adilia Lestari Bandarlampung.
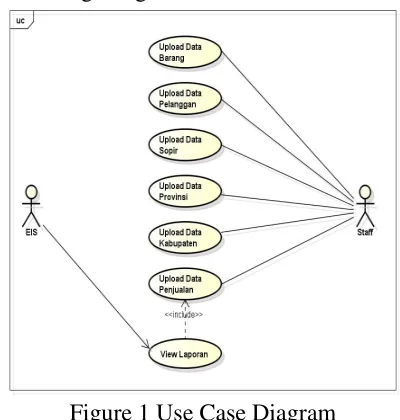
4. RESULTS AND DISCUSSION 4.1. Use Case Diagram
Use case diagonal in OLAP development of sales data is an overview of the interaction between the actors and the system being created. Use case diagram has 2 actors, staff, and EIS. Use case diagrams can be seen in the following image
Figure 1 Use Case Diagram
upload data items, perform case upload customer data, do case upload data driver, do case upload data district, do case upload province data, and do case upload data sales. The EIS actor does a case view report
4.2. Star Schema
Star schema created from this prototype is using dimension data store which consists of 5 (five) dimension that is dimbarang, dimpelanggan, dimsopir, dimkabupaten, and dimprovinsi. Star schema has 1 (one) fact that is fact sales. Design star schema data warehouse can be seen in figure below:
Figure 2 Star Schema Data Warehouse Penjualan
4.3. Time Respons ChartReportSales This stage is tested against the prototype that has been made, with the purpose of this test is to test the hypothesis items that have been made in the previous chapter to see whether the prototype test results can solve the problem response time in displaying sales charts. The results of this test by looking at how long it takes to display sales graph of goods on CV Adilia Lestari so help executive informations system in decision making.
Here is a prototype display in displaying goods sales charts.
Figure 3Result Testing Time Respons Report SAles
Based on the above picture visible time response to display reports data on
goods sales prototype OLAP
Development Data Sales at CV Adilia
Lestari has a time response of
0,000996999908239 seconds. The test results show that the hypothesis of this research is correct that with the development of OLAP prototype it will
provide convenience for executive
information system to generate sales data chart faster with less than 10 seconds response time to display sales charts for decision-making based on graphical reports resulting from faster prototype.
The result of prototype time response test that has been made that is
Table 1Result Time Respon Prototype
Laporan Time Respons
Monthly Goods Second
Top 10 Sales Report
0,0223899998998 Second
Sales Report Down 10
0,0210279999301 Second
Sales Report by Province
0,0399869999535 Second
Sales Report by Regency
0,0133039000143 Second
5. Conclusions
Based on the results of the description that has been described in the previous chapters of eating can be taken the following conclusions:
1. Use of this prototype helps
executive informations
system in generating monthly goods sales report that is 0,022259399998 sec, sales
report top 10 that is
0,0223899998998 second,
sales report down 10 that is
0,0210279999301 second,
report sales by province that is 0,0399869999535 second , Sales report by district is
0.0133039000143 seconds.
So it can help generate reports
faster data sales and
compliance reports generated from the resulting prototype have in common with the existing report format so that the prototype is right in generating reports.
2. The use of prototype in
displaying sales charts of
executive informations
system in decision making
because the process of
displaying the graph does not require a long time just less than 10 seconds to generate sales graph of goods.
3. Based on the prototype test results made using UAT testing, DeLone and McLeon and TRITAM models show good criteria results. UAT test
results Testing user
acceptance test (UAT) shows the result that is 95.51% with criteria Very Good, the test model of the success of information systems using the DeLone and McLeon Model shows the results of 84.41% with criteria Very Good, and acceptance testing technology using Model TRITAM shows the result that is 82,56% with good criterion. From the test results showed good results for users of the prototype
REFERENCES
[1] Syamsi, I. 2000. Pengambilan Keputusan dan Sistem Informasi. Bumi Aksara. Jakarta.
[2] Atmosudirjo, S.P., Dr., Mr. 2000. Administrasi Manajemen Umum, Jakarta. CV Mas Haji.
[3] Prabhu, J. C., Rajesh K. C., and Mark E. E. 2005, “The Impact of Acquisitions on Innovation: Poison Pill,Placebo, or Tonic?” Journal of Marketing, 68 (January), 114–30. [4] Turban, E., Sharda, Ramesh., Delen,
Intelligence: A Managerial Perspective on Analytics, 3rd Edition. Pearson Education Limited. USA. [5] Scheps, S. 2008. Business Intelligence
for Dummies. Hoboken NJ. Wiley. [6] Pressman, R. S. 2012. Software
Engineering : A Practicioner’s
Approach, 7th Edition. McGraw-Hill Inc., New York.
[7] Larman, C. 2004. Agile and Iterative
Development: A Manager's Guide. Addison-Wesley. p. 27. ISBN 978-0-13-111155-4.
[8] Kimball, R., and Margy, R. 2010. Industrial Engineering The Kimball Group Reader, Relentlessly Practical Tools for Data Warehousing and