INTRODUCTION
There are attempts to create advanced, com-petitive and safe aircraft, and their production and use should be economical, too. The aspects of their ecological operation, especially toxic emis-sions and noise cannot be ignored. All of these assumptions require aircraft designers’ extraordi-nary effort, a wide range of calculations and broad investigation. Many aircraft designers regard gy-roplanes as future and innovative solutions. Al-though their design assumptions and principle of operation do not make them modern and in-novative aircraft, it is a dynamic development of this type of aviation that creates opportunities for constructing an unmatched and widely appli -cable aircraft with excellent performance. There -fore, the basic gyroplane construction should be completed with some extra systems, equipment, installations, aggregates, and especially design components to make it distinguishable among the standard aircraft.
First of all, the gyrocopter should be able to take-off vertically and even hover. Another im -portant criterion is achieving high cruise speed without breaching main rotor noise standards. Following the above objectives, we are able to design a gyroplane of parameters better than the helicopter and that is unrivaled for aircraft.
Logically and practically, the advantages of gyroplanes and increasingly popular multicopters should be combined to design a fast and quiet type of aircraft capable of vertical take-off and landing. Such an aircraft may turn out to be eco-nomical, safe and able to perform tasks typical for standard aircraft.
The demand for power in multicopters ad -versely increases when they change from hover to horizontal flight, or when their speed increases. It is possible to reduce their energy consumption by unloading the drive unit during flight by unpow -ered rotor in autorotation. Autogyros show lower energy consumption during flight than helicopters and even more than multirotors [6] (Fig. 1).
INVESTIGATION OF AERODYNAMIC INTERFERENCE IN A MULTIROTOR
BY PIV METHOD
Zbigniew Czyż1, Wit Stryczniewicz2
1 Department of Thermodynamics, Fluid Mechanics and Aviation Propulsion Systems, Faculty of Mechanical Engineering, Lublin University of Technology, Nadbystrzycka 36, 20-618 Lublin, Poland
2 Institute of Aviation, Aerodynamics Department, Krakowska 110/114, 02-256 Warsaw, Poland
* Corresponding author’s e-mail: [email protected] Research Journal
Volume 12, Issue 1, March 2018, pages 106–114
DOI: 10.12913/22998624/86475 Research Article
ABSTRACT:
This paper presents part of the investigation into aerodynamics of the vertical take-off and landing multirotor. There are described the technology to design a research object and the Particle Image Velocimetry (PIV) setup to measure airflow around the aircraft. The around-the-aircraft speed distribution was investigated for an angle of attack of
0o and for four different configurations. The results are presented in form of vector ve
-locity field of airflow on the plane of symmetry of the test object. The results enabled the characteristics of speed vs. the distance from the fuselage. It was observed that the push propeller and the main rotor impact the speed field around the fuselage.
Keywords: aerodynamics, wind tunnel, wind tunnel research, Particle Image Velocimetry (PIV).
Fig. 1. Demand for power in autogyros and helicopters, based on [6] relies on many techniques of measurement and
calculation of volatile properties and phenomena that occur in the airflow around the aircraft. One of the most important trends is combining experi-mental wind tunnel research and numerical com -putation. For example, incorporation of numerical computation techniques like Computational Fluid Dynamics (CFD) in the experimental wind tunnel investigation already at the design stage enable us to evaluate design objectives and avoid an expen -sive creation of test bench models or prototypes [1] [3]. Advanced CFD tools enable us, e.g. to create aerodynamic characteristics or to visualize parameters like fields of speed, pressure, temper -ature around the test object. Since the aerospace research began, flow visualization has been used to explain phenomena that occur in all phases of flight. At present, one of the most common meth -ods is Particle Image Velocimetry (PIV). This op -tical method enables qualitative visualization and quantitative measurement of speed of flow, e.g. airflow around the test object. So a vector field of
be applied to define aerodynamic interference of flows generated by rotors in an innovative multi -rotor. Our research results enable a new construc -tion to be optimized.
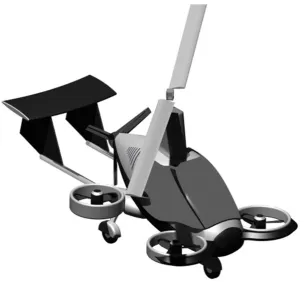
RESEARCH OBJECT
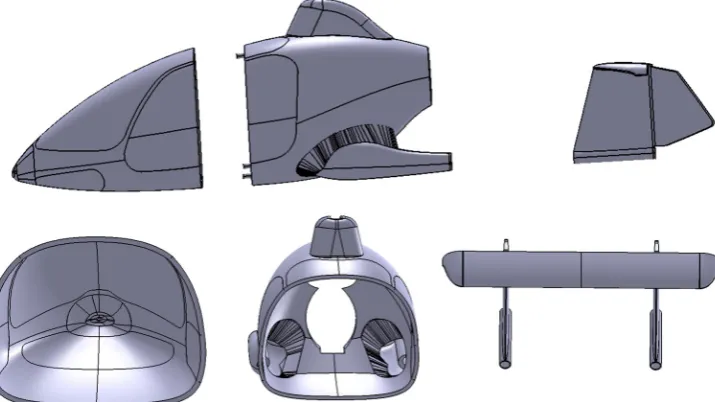
There are many researches into unpowered rotor in autorotation but few only into interfer -ence of extra power sources on main rotor opera -tion. Aerodynamic interference is all more com-plex in the construction shown in Figure 2. To be wind tunnel investigated, the research object is based on a real autogyro, i.e. the Taifun by Avia-tion Artur Trendak. Received from the manufac-turer, a 2D model was converted to a 3D model. Before this conversion, a scale was defined as 1:8 to enable measurements in wind tunnel T-1 at the Aviation Institute in Warsaw. The so scaled real aircraft has a main rotor of 1.1 m. Later, this 3D model was separated into its components, which is necessary due to a physical capability of a 3D printer and the later installation of the autogyro on a strain gauge scales. The aircraft is separated into three sections, i.e. the fuselage front, the fu-selage rear and the tail, see Fig. 3. The tail was also separated into two sections, right and left, to laminate them easily.
Inside the the fuselage, there are mounting and fixing elements for installing there a tensiomet -ric balance and profiles for extra drive units. The mounting elements are designed so that they oc-cupy the least area inside the fuselage but still are able to release the largest loads due to resistance or propeller drag forces. The fixing elements are accompanied by the special holes for aluminum profiles to be installed inside the aircraft and to install extra drive units. The holes for the alumi-num profiles are 5 mm by 20 mm. Figure 4 shows the interior of the fuselage with the mounting and fixing elements.
printing was monitored all the time. A single printing layer was 0.0875 mm thick.
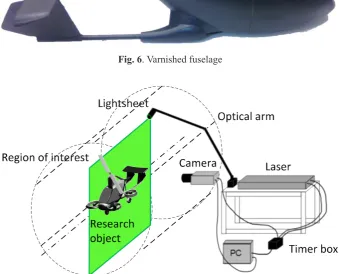
The joined fuselage and the tail were matte acrylic varnished, see Figures 5 and 6.
TEST STAND
Figure 7 shows the test bench to investigate the visualized airflow around the multirotor. The measurement system is described in detail in [11].
The airflow was visualized in two planes, i.e. a plane of symmetry and a plane parallel to the plane of symmetry and intersecting the axes of the extra horizontal propellers. This paper dis-cusses the results for a plane of symmetry only. This research was performed at a T-1 wind tun -nel at the Aviation Institute in Warsaw. This is a
closed-circuit wind tunnel with an open test sec -tion of 1.5 m in diameter and 2.2 m long. The wind tunnel is driven with a 55 kW electric mo -tor with a 4-bladed constant-speed fan. The drive gives a speed range of ~ 12 m/s – 40 m/s, regu-lated by varied the fan blade pitch angle (roughly) and the adjusted releasing flap (precisely) [9].
Figure 8 shows the research object in the wind tunnel measuring chamber and the ori -entation of the defined planes during our PIV-based visualization.
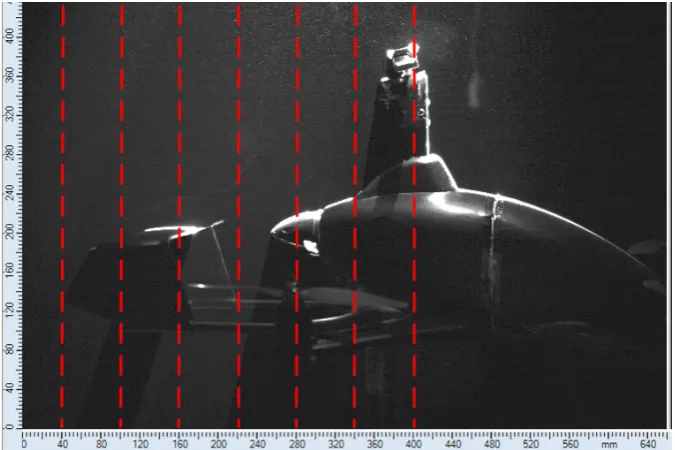
The measurement area of 660 mm by 660 mm (Fig. 9) did not cover the entire frame due to a too small angle of a light angle.
The flow field was investigated for four con -figurations, i.e. the first one (I) is the fuselage and the tail with the extra propellers of 10” in diam -eter (propellers are not driven), the second one Fig. 4. Fuselage with the mounting and fixing elements
(II) is the fuselage, the tail with propellers of 7” in diameter and an extra push propeller, driven during the measurement. Propeller engines with a vertical vector of thrust were switched off in this configuration. The third configuration (III) has an unpowered rotor in autorotation. While the push propeller operated, the 7” propellers were started. The fourth configuration (IV) is the fuselage and
the tail without the push propeller but with the operating main rotor and 10” propellers (Fig. 10).
RESULTS
Figures 11–14 show the correlation of airflow speed as a function of the y-coordinate for the fixed x-coordinates (Fig. 9).
Fig. 5. Fuselage with the interior frame and the mounted tail
Fig. 6. Varnished fuselage
Fig. 7. Schematic diagram of the test bench to visualize the airflow around the research object, self-elaboration,
CONCLUSIONS
The paper investigates the speed distribution around the multirotor at the angle of attack of 0° and four different configurations. Our investiga -tion covers the visualiza-tion of airflow by vector velocity field in the plane of symmetry of the re -search object. The results enabled speed charac -teristics depending on the distance from the fu-selage. We also observed the impact of the push propeller and main rotor on the speed field around the aircraft. There was investigated the impact of the operating elements of the drive unit on the speed field around the research object. In the first
configuration with no operating propelling ele -ments, the airflow speed in the plane of symme -try directly behind the pylon reduces from 12.5 m/s to about 3 m/s in the x-coordinate = 340 mm. If the distance from the pylon increases, pres -sure tends to level out and the same happens to speed in the coordinates of the horizontal axis, i.e. 40 mm, 100 mm, 160 mm, 220 mm, 280 mm so speed average values range from 6 m/s to 8 m/s. When the push propeller started in configuration II, the airflow speed increased to about 12.5 m/s in the wake (x = 340 mm), whereas it increased up to about 21 m/s behind the propeller. The au-torotative main rotor and propellers in configura -Fig. 8. Research object in the wind tunnel measurement area (left) and the orientation of the defined planes dur
-ing our PIV-based visualization – a schematic (right)
a) b)
c) d)
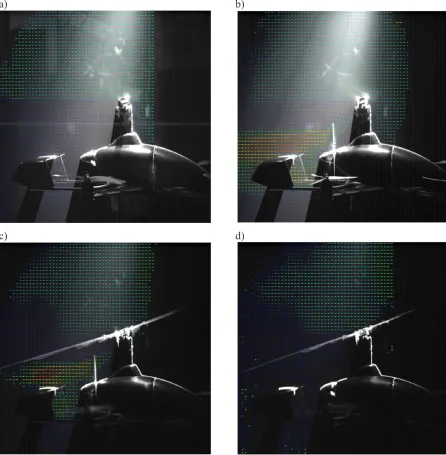
Fig. 10. Four aircraft configurations at an angle of attack α=0o, with airflow v=12.5 m/s
a) b)
Fig. 11. Correlation of airflow speed as a function of the y-coordinate for the fixed x-coordinate of 40 mm (left)
tion III reduce airflow speed from about 21 m/s to 17.5 m/s compared to the behind-propeller sphere in configuration II (Fig. 9 and 10).
Our further research shall focus on speed distribution around the multirotor in the next control plane and the other angles of attack. The results of numerical computations shall also be presented and compared.
REFERENCES
1. Bogdański K., Rodzewicz M., Ruchała P.: Char
-acteristics of locked and free-wheeling ducted fan based on wind tunnel test and CFD analyses. 5th
CEAS Air & Space Conference, 2015.
Fig. 12. Correlation of airflow speed as a function of the y-coordinate for the fixed x-coordinate of 160 mm (left)
and 220 mm (right)
a) b)
Fig. 13. Correlation of airflow speed as a function of the y-coordinate for the fixed x-coordinate of 280 mm (left)
and 340 mm (right)
2. Chen F.,Liu H., Yang Z., Hu H.: Tracking charac
-teristics of tracer particles for PIV measurements in supersonic flows. Chin J Aeronaut (2017), http:// dx.doi.org/10.1016/j.cja.2016.12.033.
3. Czyż Z., Łusiak T., Magryta P.: Badania Numery
-czne CFD wpływu usterzenia na charakterystyki aerodynamiczne wiatrakowca. Prace Instytutu Lot
-nictwa, 232, 2013, 3–14.
4. Czyż Z., Wendeker M., Raczyński R.: Koncepcja hy
-brydowego statku powietrznego z napędem wielow
-irnikowym. Logistyka, nr 6, 2014, 2936–2945.
5. Haertig J, Havermann M, Rey C, George A. Par -ticle image velocimetry in Mach 3.5 and 4.5
shock-tunnel flows. AIAAJ, 40(6), 2002, 1056–60.
6. Prouty R. W.: Helicopter Performance. Stabil
-ity and Control. Malabar, FL: Krieger Publishing
Company, 1990, pp. 143–146, 476–477.
7. Pust, O., 2000, PIV: Direct Cross-Correlation com
-pared with FFT-based Cross-Correlation. Proceed
-ings of 10th International Symposium on Appli -cations of Laser Techniques to Fluid Mechanics, Lisbon, Portugal.
8. Ruchała P., Bogdański K., Stryczniewicz W.: Analy
-ses of airflow around ducted fan propulsion system in pusher configuration using PIV method. ICAS 2016.
9. Ruchała P., Stryczniewicz W., Czyż Z., Łusiak T.: Charakterystyki aerodynamiczne kadłuba wiatra
-kowca dla różnych kątów zaklinowania usterzenia poziomego. Prace Instytutu Lotnictwa, 4(241),
2015, 96–106.
10. Scarano F. Overview of PIV in supersonic flows.
Berlin Heidel-berg: Springer; 2007, pp. 445–463. 11. Stryczniewicz, W., Surmacz, K.: Badania ekspery
-mentalne stanu pierścienia wirowego na wirniku nośnym śmigłowca metodą anemometrii obra
-zowej (PIV). Prace Instytutu Lotnictwa, 235, 2014,
17–27.
12. Stryczniewicz W.: Zastosowanie metody odwrot
-nej w celu zwiększenia możliwości pomiarowych metody anemometrii obrazowej (PIV). Prace In
-stytutu Lotnictwa, Nr 2(243), 2016, 93–107, DOI:
10.5604/05096669.1205252.
13. Stryczniewicz, W.: Algorytm do wyznaczania wekto
-rowego pola prędkości metodą anemometrii obrazo
-wej”, Problemy Mechatroniki, 9, 2012, 41–54.
14. Tanahashi, M., Hirayama, T., Taka, S., Miyauchi,
T.: Measurement of fin scale structure in turbu -lence by time-resolved dual-plane stereoscopic
PIV. International Journal of Heat and Fluid Flow,
![Fig. 1. Demand for power in autogyros and helicopters, based on [6]](https://thumb-us.123doks.com/thumbv2/123dok_us/8806666.1774949/2.595.133.466.533.755/fig-demand-power-autogyros-helicopters-based.webp)