ISSN 2319-7625 (Online) www.chemistry-journal.org
Ground Water Quality Evalution for Drinking Purpose in
Some Areas of Unjha Taluka, Mehsana
District (N. Guj.) India
M. R. Solanki and G. D. Acharya
Department of Chemistry, R. R. Mehta College of Science and
C. L. Parikh College of Commerce, Palanpur, Guj., INDIA.
(Received on: November 18, 2014)
ABSTRACT
Water plays a vital role in human life. Ground water quality is an essential for healthy population. In the present study of drinking water samples for 20 water sources tube wells in the Unjha field has been carried out. The purpose of this study was to ascertain the quality of water from these sources. The physical properties such as pH and Total dissolved solids (TDS) showed the range of pH (7.24-8.48) and TDS (643.0-1208.6) mg/L which is within the permissible limits of World Health Organization (WHO) except few samples. We have measured of SO4-2, F-,
Cl- Na+, K+,Ca+2and Mg+2 also. The analytical data are processed and interpretented as per slandered laboratory method of APHA.
Keywords: Ground water quality, Electric conductivity (EC), Total dissolved Solids (TDS), Sodium adsorption ratio (SAR), American public health association (APHA).
INTRODUCTION
testing for a single analyze to laboratory based multi-component instrumental analysis. The measurement of water quality is a very rigorous and time consuming process, and a large number of quantitative analytical methods are used for this purpose. Understanding the groundwater quality is important as it is the main factor determining its suitability purposes1. In developing countries like India around 80% of all diseases are directly related to poor drinking water quality and unhygienic conditions2. Increasing water pollution causes not only the deterioration of water quality but it also threatens human health and the balance of aquatic ecosystems, economic development and social prosperity.
The consequence of urbanization and industrialization leads to spoil the quality of water. For agricultural purposes, ground water is explored in rural areas especially in those areas, where other sources of water like dam, river or a canal is not available. During last decade, it has been observed that the groundwater gets polluted significantly because of increased human activities3,4. Consequently, number of cases of water borne diseases has been seen causing health hazards5,8. So basic monitoring of water quality has become necessary to observe the demand and pollution level of ground water8. A good number of water analysis experiments are regularly conducted by different groups of chemists and biologists all across the country9,12.
MATERIALS AND METHODS
Unja is a Taluka in Mehsana district of Gujarat State, India. Unjha city lies on the geographical coordinates of 23° 48' 0" N, 72° 24' 0" E. Total population of 174303. The 53876 persons lives in town and 120427 lives in rural areas. It is located 116 meters above Sea level and it is too hot in summer. Unjha summer highest day temperature is in between 350C to 430 C. The area of Unjha taluka is lack of rainfall.
The natural water analysis for physical and chemical properties including trace element contents is very important for public health. 20 water samples were collected from various locations covering the entire study area (Fig. 1). Pre washed one and 500 litter polyethylene bottles were used for sample collection and preservation. Before using the samples bottles carefully cleaned with concentrated HCl then rinsed with tap water finally with distilled water. The samples were kept in a refrigerator and till analyzed. pH, Temperature, diameter, depth, static water level of the tube wells are measured on the sites during.
Physico-Chemical Analysis
The people of North Gujarat region have been facing potable water crisis due to inadequate rains. In Gujarat, ground water is considered as the first water source for drinking, irrigation and other uses. The climate of the Unjha plain can be described as being hot, windy and arid with humidity; air temperature is over 43°C in the period from May to September. The major source of drinking water in unjha area is only ground water, the aim of this study was to investigate the quality of the ground water. Samples were collected from the Unjha tubewells. Chemical and physical characteristics were analyzed.
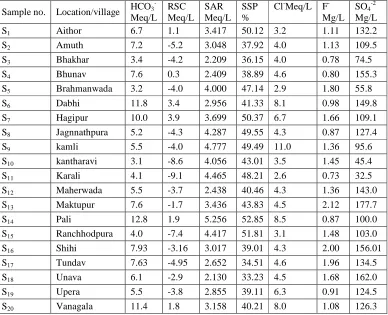
In all, about 20 samples of water were examined for electrical conductivity, pH and the proportion of various cations and anions. The chemical analysis was carried out following standard procedures. Chemical analysis data of the water samples are given in Table 1. It presents different ratios to judge the quality of these water samples from drinking viewpoints.
RESULT AND DISCUSSION
The physical and chemical parameters exhibited significant variations from sample to sample. All the measurements were carried out in the vicinity of temperature 300C.
The observations are summarized in the Table 1.
Table 1 (a): Physico-chemical characteristics of ground water in UNJHA taluka (N.Gujarat)
Sample
no. Location/village
PH TDS Mg/L
EC
Mmhos/cm.
Ca+2+Mg+2
Meq/L
Na+ Meq/L
K+ Meq/L
CO3 -2
Meq/L
S1 Aithor 7.71 710 1.956 5.8 5.81 0.02 0.2
S2 Amuth 7.89 643 1.625 12.5 7.62 0.01 0.1
S3 Bhakhar 8.10 695 1.519 7.7 4.33 0.03 0.1
S4 Bhunav 7.91 597 1.245 7.4 4.65 0.06 0.1
S5 Brahmanwada 8.21 879 1.871 10.1 8.96 0.05 0.2
S6 Dabhi 7.87 789 1.765 8.8 6.18 0.02 0.4
S7 Hagipur 8.01 645 1.588 6.7 6.77 0.03 0.6
S8 Jagnnathpura 7.24 656 1.487 9.6 9.39 0.04 0.1
S9 kamli 7.89 564 1.411 11.9 11.64 0.02 0.2
S10 kantharavi 8.13 889 1.712 13.3 10.02 0.02 0.1
S11 Karali 8.19 632 0.687 9.7 9.02 0.01 0.5
S12 Maherwada 7.75 669 0.703 6.4 4.34 0.01 0.6
S13 Maktupur 7.64 900 1.847 9.7 7.56 0.01 0.4
S14 Pali 7.76 968 1.977 11.0 12.30 0.03 0.1
S15 Ranchhodpura 8.17 872 1.654 8.5 9.10 0.04 0.1
S16 Shihi 7.93 692 1.612 11.5 7.34 0.03 0.1
S17 Tundav 7.65 1208 1.793 12.6 6.63 0.01 0.2
S18 Unava 7.80 566 1.588 9.2 4.56 0.02 0.2
S19 Upera 8.36 645 1.677 9.9 6.34 0.02 0.6
Table 1 (b): Physico-chemical characteristics of ground water in UNJHA taluka (N.Gujarat)
Sample no. Location/village HCO3
- Meq/L RSC Meq/L SAR Meq/L SSP %
Cl-Meq/L F -Mg/L
SO4-2
Mg/L
S1 Aithor 6.7 1.1 3.417 50.12 3.2 1.11 132.2
S2 Amuth 7.2 -5.2 3.048 37.92 4.0 1.13 109.5
S3 Bhakhar 3.4 -4.2 2.209 36.15 4.0 0.78 74.5
S4 Bhunav 7.6 0.3 2.409 38.89 4.6 0.80 155.3
S5 Brahmanwada 3.2 -4.0 4.000 47.14 2.9 1.80 55.8
S6 Dabhi 11.8 3.4 2.956 41.33 8.1 0.98 149.8
S7 Hagipur 10.0 3.9 3.699 50.37 6.7 1.66 109.1
S8 Jagnnathpura 5.2 -4.3 4.287 49.55 4.3 0.87 127.4
S9 kamli 5.5 -4.0 4.777 49.49 11.0 1.36 95.6
S10 kantharavi 3.1 -8.6 4.056 43.01 3.5 1.45 45.4
S11 Karali 4.1 -9.1 4.465 48.21 2.6 0.73 32.5
S12 Maherwada 5.5 -3.7 2.438 40.46 4.3 1.36 143.0
S13 Maktupur 7.6 -1.7 3.436 43.83 4.5 2.12 177.7
S14 Pali 12.8 1.9 5.256 52.85 8.5 0.87 100.0
S15 Ranchhodpura 4.0 -7.4 4.417 51.81 3.1 1.48 103.0
S16 Shihi 7.93 -3.16 3.017 39.01 4.3 2.00 156.01
S17 Tundav 7.63 -4.95 2.652 34.51 4.6 1.96 134.5
S18 Unava 6.1 -2.9 2.130 33.23 4.5 1.68 162.0
S19 Upera 5.5 -3.8 2.855 39.11 6.3 0.91 124.5
S20 Vanagala 11.4 1.8 3.158 40.21 8.0 1.08 126.3
Table 2: Rating of different parameters in water
parameter Acidic Normal Moderately safe
Saline
Moderately unsafe
Alkaline unsafe
pH <7.00
Good
7.00to7.50 safe
7.50to8.50 marginal >8.50 unfit E.C.(mmhos/cm) <0.250
Low
0.250 to 0.750 medium 0.750 to 2.250 high >2.250 very high
SAR <10.0
Safe
10.0 to 18.0 Marginal 18.0 to 26.0 doubtful >26.0 doubtful RSC (meqL-1) <1.25
Safe
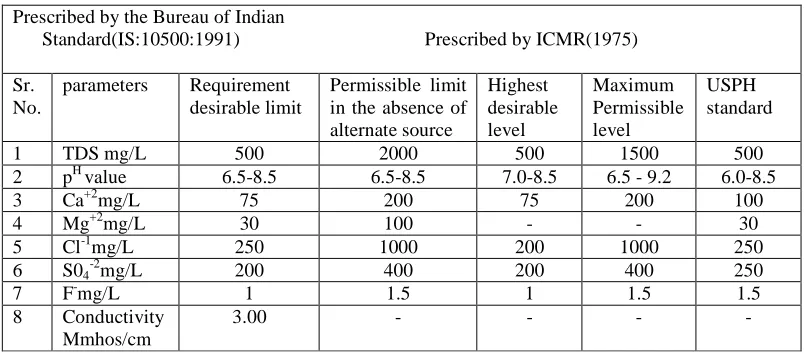
Table 3: Standards of Physical and Chemical Water Quality
Prescribed by the Bureau of Indian
Standard(IS:10500:1991) Prescribed by ICMR(1975)
Sr. No.
parameters Requirement desirable limit
Permissible limit in the absence of alternate source
Highest desirable level
Maximum Permissible level
USPH standard
1 TDS mg/L 500 2000 500 1500 500
2 pH value 6.5-8.5 6.5-8.5 7.0-8.5 6.5 - 9.2 6.0-8.5
3 Ca+2mg/L 75 200 75 200 100
4 Mg+2mg/L 30 100 - - 30
5 Cl-1mg/L 250 1000 200 1000 250
6 S04-2mg/L 200 400 200 400 250
7 F-mg/L 1 1.5 1 1.5 1.5
8 Conductivity Mmhos/cm
3.00 - - - -
Based on these tabulated values and the figures, the following observations are made. It is observed that the pH of the water was slightly alkaline (7.24 to 8.48) and only minor fluctuation in pH was recorded. The pH levels were within the limits set for domesticuse as prescribed by APHA.
The WHO has suggested a limiting value of 500 mg/L of TDS for potable water. In the present investigation, this limit is crossed i.e. 564-1208 mg/L of the samples. However, in the sample No.S17 (Tundav), The TDS value is about to reach the maximum permissible
limit (1208 mg/L). The water of the remaining some samples have reasonable values of TDS (564–879 mg/L). These values are acceptable for domestic use and agricultural purposes. It is a useless for drinking purpose.
Electrical conductivity is a useful tool to evaluate the purity of water. Maximum EC at 1.977 mmhos/cm (S14-Pali) and minimum at 0.687 mmhos/cm(S11-Karali) the result
indicates that all most all the water samples are within the permissible limits of 2.250 mmhos/cm.
The summation of calcium hardness and magnesium hardness is regarded as the totalhardness of water. In the present investigation, it has been observed that the calcium and magnesium concentration of the samples has registered a high value of calcium magnesiumhardness (5.8-13.3meq/L) (Tables 1). The hardness scale has shown value more (13.3meq/L) for sample S10. So water is very hard. These minerals in water can cause some
concentration in the samples fall well within the prescribed limit, but the chloride content is much higher than the permitted values of WHO19 and ISI. High chloride content in ground water attributed to lack of under-ground drainage system and bad maintenance of environment around the sources.
The sodium and potassium ions were investigated in drinking water samples. Their concentrations were in the range of (4.33-12.30meq/L) and (0.01-0.06meq/L) respectively. These results were within the permissible limits by WHO.
The values of HCO3
in the water samples varied from 3.2 to 11.8 meq/L. The lowest value of 3.2 meq/L was observed in the water sample obtained from Brahmamwada, whereas the highest value of 11.8meq/L was observed in Dabhi Village. All the samples were far below the permissible limit of 120 meq/L.
Fluoride content of ground water samples of the study areas ranged from 0.87 to2.12 mg/L. Maximum allowable limit is 1.5 ppm (WHO, 1999). It is under permissible limit. Small concentration of fluoride in drinking water has some beneficial effect also on human body. Low concentration of fluoride below 0.5 ppm causes dental caries and higher concentration beyond 1.5 ppm causes dental and skeletal fluorosis. The result indicates that 65% water sample have higher values of fluoride content. Due to this more people facing fluorosis disease in this taluka today.
The suitability of the tubewell water samples was judged by determining the SAR value and these were categorized under different irrigation classes on the basis of salinity and alkalinity hazards. Sodium adsorption ratio (SAR) was computed by using values of water soluble cation (Table 1). The SAR values varied from 2.209 to 5.256 meq/L. The data revealed that all of the water samples of the taluka under study have low values (< 10.0) and safe.
Residual sodium carbonates (RSC) were computed by using values of anions of sodium CO3
-2
and HCO3 -1
) and cations (Ca+2+ Mg+2), where the ionic concentration is in meq/L. The RSC values varied from –9.1 to 3.9. The soluble sodium percentage (SSP) values of the water samples of Unjha taluka ranged from 33.23 to 52.85 percent. The lowest value of 33.23 per cent was observed in Unava Village whereas the highest values of 52.85 percent were recorded in a water sample from Pali Village. Further, the data revealed that about all of the water samples have low values (< 60) of SSP.
CONCLUSION
REFERENCES
1. Ramachandraiah, C. Right to drinking water in India. Centre of Economic and Social Science Studies. Vol.56 (2004).
2. A. Abdul Jameel, Poll. Res., 7(2), 111 (1998).
3. A. G. Sirkar et al., J. IWWA, Oct.-Dec. 1996, 215 (1996).
4. APHA., Standard Methods for Examination of Water and Wastewater20th Ed. American Pub. Health Asso., Washington D.C. (2000).
5. K. M. Elizabeth and L. Premnath Naik, Poll. Res., 24(2), 337 (2005). 6. E. E. Muller, M. M. Ehlers and Grabow, Wat. Res., 35, 3085 (2001).
7. Guidelines for Drinking Water Quality- WHO, Geneva, 2nd Ed.,pp. 97-100 (1999). 8. D. Nath, J. Inland Fresh. Soc. India, 33(2), 37 (2001).
9. Fluoride in drinking water, WHO /IWA, (2001).
10. APHA, Standard methods for the examination of water and waste water; Washington USA, (1995).
11. M. R. Solanki et al., T.J. of Che. 3(2) pp.32-33 (2013).