R E S E A R C H A R T I C L E
Open Access
Time course analysis of gene expression identifies
multiple genes with differential expression in
patients with in-stent restenosis
Santhi K Ganesh
1†, Jungnam Joo
2†, Kimberly Skelding
3†, Laxmi Mehta
4, Gang Zheng
2, Kathleen O
’
Neill
1,
Eric M Billings
1, Anna Helgadottir
5, Karl Andersen
6,7, Gudmundur Thorgeirsson
6,7, Thorarinn Gudnason
6,
Nancy L Geller
2, Robert D Simari
8, David R Holmes
8, William W O
’
Neill
9, Elizabeth G Nabel
1*Abstract
Background:The vascular disease in-stent restenosis (ISR) is characterized by formation of neointima and adverse
inward remodeling of the artery after injury by coronary stent implantation. We hypothesized that the analysis of gene expression in peripheral blood mononuclear cells (PBMCs) would demonstrate differences in transcript expression between individuals who develop ISR and those who do not.
Methods and Results:We determined and investigated PBMC gene expression of 358 patients undergoing an
index procedure to treat in de novo coronary artery lesions with bare metallic stents, using a novel time-varying intercept model to optimally assess the time course of gene expression across a time course of blood samples. Validation analyses were conducted in an independent sample of 97 patients with similar time-course blood sampling and gene expression data. We identified 47 probesets with differential expression, of which 36 were validated upon independent replication testing. The genes identified have varied functions, including some related to cellular growth and metabolism, such as theNAB2andLAMPgenes.
Conclusions:In a study of patients undergoing bare metallic stent implantation, we have identified and replicated
differential gene expression in peripheral blood mononuclear cells, studied across a time series of blood samples. The genes identified suggest alterations in cellular growth and metabolism pathways, and these results provide the basis for further specific functional hypothesis generation and testing of the mechanisms of ISR.
Background
Cardiovascular disease is the leading cause of death in western countries and a major cause of morbidity and mortality world-wide. Studying coronary atherosclerotic disease (CAD) is challenging for several reasons, since it has substantial environmental and genetic components. Furthermore, despite the nearly universal presence of coronary atherosclerosis, particularly as individuals age, cardiovascular events such as acute coronary syndromes, sudden death and the need for revascularization therapy only occur in some individuals, highlighting the diffi-culty in precisely defining atherosclerosis phenotypes.
In symptomatic patients, revascularization therapy is often required, and percutaneous intervention with bal-loon angioplasty and stent implantation is a cornerstone of therapy. In-stent restenosis (ISR) is a late complica-tion of stent implantacomplica-tion in which inflammatory and proliferative responses to the vascular injury caused by angioplasty and stenting lead to neointimal hyperplasia within the stent and at its edges over the following weeks and months. Many of the same inflammatory and proliferative processes are activated in the development of atherosclerosis but occur over years or decades. ISR is characterized by proliferative responses to the vascu-lar wound incurred as a result of stent implantation [1]. Therefore, ISR may be viewed as a model phenotype of vascular wound repair for which the mechanisms repre-sent part of the pathologic picture of atherosclerosis, with relatively accelerated wound repair responses
* Correspondence: enabel@partners.org
†Contributed equally
1
National Heart, Lung, and Blood Institute (NHLBI), Division of Intramural Research, Bethesda, Maryland, USA
Full list of author information is available at the end of the article
operative in the vascular wall and in peripheral blood leukocytes.
In the analysis reported here, we apply a novel method to analyze time-course gene expression data to gene expression profiles of peripheral blood mononuc-lear cells (PBMCs) of patients enrolled in our study of ISR. The results of the discovery transcriptome analysis of the CardioGene Study were tested for replication in an independent sample of Icelandic patients. We ulti-mately identified and validated a set of 32 genes that are temporally differentially expressed in the blood of patients who develop ISR after stenting, compared to those who do not develop ISR, highlighting the impor-tance of cellular growth pathways and identifying sev-eral biologic candidates for further mechanistic investigation.
Results
Microarray data quality control and filtering
In the CardioGene Study, 312 patients were included (52 with ISR, and 260 who did not develop ISR, as defined by criteria for clinical restenosis [2]) after quality control filtering (Table 1). All 312 patients had baseline gene expression profile data (Figure 1a). Of these, 203 had a blood sample and high quality gene expression profile data at early follow-up (2-4 weeks post-stent), and 166 had high quality gene expression profile data at both early follow-up and late follow-up (6 months post-stent). A total of 681 samples were included in the time course analysis. Box plots showing the distributions of the early and late follow-up times are presented in Figure 1b. From the deCODE sample of patients in Ice-land, 97 patients were enrolled and had high quality gene expression profiles at baseline (28 with ISR, 69 without ISR). Of these, 86 patients had a follow-up blood sample and acceptable gene expression data at
6 months post-stent. Thus, a total of 183 samples were included in the replication analysis.
CardioGene discovery analysis of time-course RNA expression in PBMCs
Applying the time varying intercept model, 46 probes, cor-responding to 42 distinct genes, were found to be signifi-cant at FDR adjusted q-value less than 0.05 out of 12467 probe sets that passed the quality control (Additional File 1). Two patterns of gene expression were observed, with some genes showing divergent gene expression patterns across the time course (Figure 2a) and others showing consistently differential gene expression over the time course (Figure 2b). Descriptions of the genes to which these probe sets map are provided in Additional File 1.
Replication analysis using deCODE time course samples
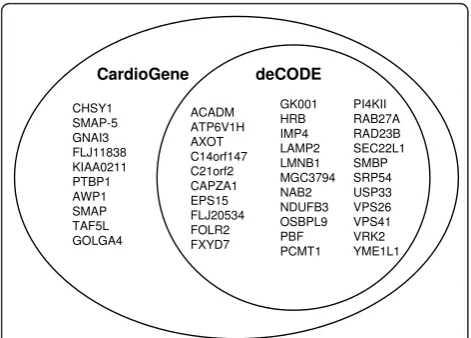
Among 46 significant probe sets identified in the Cardi-oGene time-course analysis, 36 probe sets had FDR adjusted q-value less than 0.05 in the deCODE replica-tion analysis (Figure 3). Gene expression patterns were largely consistent with the patterns observed in the Car-dioGene discovery analysis (Figure 2c and 2d). The 36 probe sets mapped to 32 unique genes (Table 2).
Annotation of Genes Identified
Using the DAVID/EASE annotation tool, several cate-gories of genes were identified, falling into multiple gene ontology classifications. No single category achieved a significance score indicating statistically significant over-representation of a specific gene ontology, and several gene ontology classes showed multiple genes (Additional File 2). The categories with the highest representation (i.e. the largest number of genes mapping to these ontologies) included cell growth and/or maintenance, cellular metabolism, catalytic activity, nucleotide and
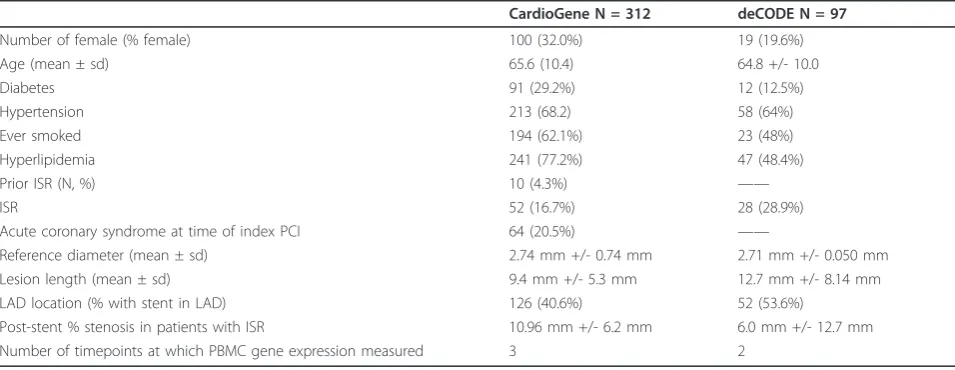
Table 1 Clinical characteristics of the CardioGene and deCODE cohorts
CardioGene N = 312 deCODE N = 97
Number of female (% female) 100 (32.0%) 19 (19.6%)
Age (mean ± sd) 65.6 (10.4) 64.8 +/- 10.0
Diabetes 91 (29.2%) 12 (12.5%)
Hypertension 213 (68.2) 58 (64%)
Ever smoked 194 (62.1%) 23 (48%)
Hyperlipidemia 241 (77.2%) 47 (48.4%)
Prior ISR (N, %) 10 (4.3%) ——
ISR 52 (16.7%) 28 (28.9%)
Acute coronary syndrome at time of index PCI 64 (20.5%) ——
Reference diameter (mean ± sd) 2.74 mm +/- 0.74 mm 2.71 mm +/- 0.050 mm
Lesion length (mean ± sd) 9.4 mm +/- 5.3 mm 12.7 mm +/- 8.14 mm
LAD location (% with stent in LAD) 126 (40.6%) 52 (53.6%)
nucleic acid metabolism, transport, protein binding and cellular binding. Genes with prior evidence of expression in the arterial wall after vascular injury included the NAB2 andLAMP2 genes, with data in the prior litera-ture suggestive of functional relevance of these genes, by mediating proliferative responses and recruitment of PBMCs to injured endothelium, respectively [3-13] (Figure 4).
Sensitivity Analysis
In a sensitivity analysis, we found that the median num-ber of significant probe sets using the same criteria of FDR 0.05 was only 2, the mean was 3.04, and the maxi-mum number was 14 in one iteration, demonstrating a significantly low likelihood that the probesets we identi-fied and replicated were identiidenti-fied due to chance.
Hypothesis-driven analysis of gene expression
We compared our results to published studies examin-ing gene expression in ISR, chiefly in human vascular tissue samples [14,15]. In one study, peripheral blood total leukocytes were also examined [14]. In the Cardi-oGene baseline blood sample, genes reported by
Ashley et al were examined [15], and none were signif-icantly differentially expressed in the baseline blood sample or in our timecourse results. In another study by Zohlnhofer et al [14], gene expression data from neointimal vascular tissue and peripheral blood leuko-cytes were reported. We examined those genes meet-ing a Bonferroni multiple testmeet-ing correction from this discovery report and did not find overlap with our gene expression findings.
Discussion
Using a repeated sampling study design, we investigated PBMC transcript expression in patients undergoing stent implantation, using a novel time-course analysis method. We identified a set of 42 genes with differential temporal expression among patients with and without ISR at one year follow-up in a discovery analysis of the CardioGene Study. Independent replication testing in an Icelandic sample confirmed differential expression of 36 probesets mapped to 32 genes. The gene expression pat-terns over time may be of interest as well, with consis-tently expressed genes representing gene expression data that may be able to predict ISR and differentially expressed genes over the time course representing genes with possible direct functional roles in the development of ISR, both of which require further investigation to explore more fully.
Gene expression profiling with DNA microarray tech-nology is a popular tool to monitor the expression level of thousands of genes simultaneously and has been applied in cardiovascular research, to detect patterns of gene expression indicative of underlying disease states [16-21]. Since the data generated represent the temporal abundance of mRNA levels in the sample, measure-ments of the change of this abundance over the course of disease progression (or any biological process) is therefore both possible and of great scientific interest using this technology. In fact, Yuan and Kendziorski [22] reported that more than one-third of the experi-ments catalogued in the Gene Expression Omnibus (National Center for Biotechnology Information; http:// www.ncbi.nlm.nih.gov/geo/) are from experiments that measure gene expression over time. Early time-course RNA expression studies have focused on identifying clusters of genes with a similar pattern over time [14,23,24]. More recently, detecting a differential gene expression pattern over time between several biological groups has become an interesting goal of time-course gene expression data.
To detect differential gene expression pattern over time, we used a time-varying intercept model which can account for differences in sample intervals between patients. The term“differential gene expression pattern over time”can be interpreted in several ways to form
;ĂͿ
Baseline
at catheterization 2 Weeks 6 months
Clinical outcome determination
12 months
ZĞƐƚĞŶŽƐŝƐ EсϲϬ
EŽ ZĞƐƚĞŶŽƐŝƐ EсϮϵϴ
ůŽŽĚƌĂǁ
dϬ dϭ dϮ
^dEd
͘;ďͿ
10
20
30
40
50
Early Follow-Up Time
Da
y
s
15
0
200
25
0
300
3
50
Late Follow-Up Time
Da
y
s
suitable questions and, thus, the hypotheses are depen-dent on the particular experiment under consideration. We considered two related questions where each can roughly correspond to the main effect of the group, and the interaction between group and time points. Consider, for example, a gene with exactly the same expression pat-tern over time in both groups, but the first group has a
higher expression than the second group, consistently over all time points. This is a gene that shows the main effect of the group. On the other hand, consider another gene with similar expression level at two time points, 1 and 2, but this gene’s expression increases from time 1 to 2 in one group but decreases in another group. This group-by-time interaction cannot be examined by
;ĂͿ
;ďͿ
;ĐͿ
;ĚͿ
CardioGene
deCODE
218047_at
218047_at
OSBPL9
OSBPL9
(d)
CardioGene
CardioGene
201222_s_at
203605_at
RAD23B
SRP54
(c)
methods that only test the main effect of the group. The time-varying intercept model we used can detect both the main effect and group-by-time interaction. This method, however, requires a large number of bootstrap resampling to evaluate the significance level of the differ-ence between groups, which can be computationally challenging especially when a large number of genes are tested.
Of the genes we identified, the most extensive prior literature in vascular disease was found for the NAB2 gene, which is also known as EGR1 binding protein 2. Early growth response (EGR) genes, which are transcrip-tion factors that are implicated in a wide variety of pro-liferative and differentiative processes [15]. Nab proteins are necessary for Schwann cells to exit the cell cycle and generate a myelin-specific gene profile and are key regulators of the myelination process of peripheral nerves [25].NAB2is expressed in vascular smooth mus-cle cells in response to injury [3-12,26] and EGR1 has been identified in a microarray study of in vitro smooth muscle cell proliferation [27]. TheLAMP2gene product protects the lysosomal membrane from proteolytic enzymes within lysosomes and also functions as a recep-tor for proteins to be imported into lysosomes [28]. Mutations in theLAMP2 gene have been identified in patients with hypertrophic cardiomyopathy [29], and the gene product mediates adherence of PBMCs to the vas-cular endothelium [13]. Cellular adhesion to the vasvas-cular endothelium has been well-described in animal models and post-mortem human examinations, in atherogenesis and acute vascular injury [30,31]. In the latter, the extent of leukocyte adhesion is predictive of the degree of subsequent neointimal hyperplasia, which is the key lesion of ISR.
Some genes identified have no apparent role in vascular biology, such asVPS26, VPS41,SRP54, andRAD23B, and comparison to previously published reports in the litera-ture do not show differential gene expression in other studies of restenosis, although these investigations were conducted primarily on vascular tissues or culture vascu-lar smooth muscle cells rather than peripheral blood [17,18,27,32]. TheVPS26 and VPS4genes belongs to a group of vacuolar protein sorting genes and may have a role in lysosome maintenance [33], andSRP54is a pro-tein in the signal recognition particle, which directs secretory proteins to membranes as they emerge from the ribosome [34]. Specific vascular or inflammatory cell function has not been described, but derangement of these basic cellular processes may impact vascular and other physiologic functions adversely.RAD23Bhas a role in DNA (nucleotide excision) repair, and genetic variants in RAD23B have been associated with several solid tumors [35-38]. The association with cancer would sug-gest a possible link to excess proliferative mechanisms in vascular wound repair, as has been described for many other cell cycle regulatory genes [39]. Genetic variants in other genes we identified are also associated with human diseases. Several genetic variants inACADMhave been associated with medium-chain acyl-CoA dehydrogenase activity, but there is no known vascular implication of this disorder [40]. Variants inPCMT1andFOLR2have been associated with neural tube defects [41-43], with no known vascular phenotype in these cases. Overall the findings of this study are hypothesis-generating and can be used to support the rational for investigating the func-tion of specific genes and pathways in adverse vascular remodeling, which is relevant to both ISR and more gen-eral CAD phenotypes.
We compared the results of our study to previously published reports of transcriptome analysis in ISR. Our results were negative for replication of these studies which focused primarily on vascular tissue samples, in relatively small sample sets. In one study, peripheral blood total leukocyte gene expression was studied in 10 patients with ISR and atherectomy specimens [23]. While a high degree of correlation between peripheral blood leukocyte and arterial neointima tissue gene expression was identified in a subset of genes, these findings were based upon single measurements in a small sample size and were not replicated in the original report. These prior reports highlight the major difficulty of studying vascular tissues, since access to these tissues in adequately large sample sizes is limited.
Vascular biopsy and atherectomy are performed infre-quently as part of routine clinical care and would not support well-powered studies of vascular tissues. Tissue sampling over a time course is not clinically indicated or possible. Additionally, a large degree of intra-individual CHSY1
SMAP-5 GNAI3 FLJ11838 KIAA0211 PTBP1 AWP1 SMAP TAF5L GOLGA4
ACADM ATP6V1H AXOT C14orf147 C21orf2 CAPZA1 EPS15 FLJ20534 FOLR2 FXYD7
GK001 HRB IMP4 LAMP2 LMNB1 MGC3794 NAB2 NDUFB3 OSBPL9 PBF PCMT1
PI4KII RAB27A RAD23B SEC22L1 SMBP SRP54 USP33 VPS26 VPS41 VRK2 YME1L1 CardioGene deCODE
variability in gene expression was noted in these prior studies of vascular tissues, making replication testing cri-tical, yet this cannot be done without access to additional tissues samples. In our study, we analyzed peripheral blood leukocytes, specifically focusing on the mononuc-lear fraction which contains primarily B and T lympho-cytes and monolympho-cytes. Although the analysis of peripheral blood cells would ideally be complemented by similar studies in vascular tissues, studying gene expression
profiles in blood leukocytes is biologically relevant due to well-defined interactions with the arterial wall, particu-larly in the setting of vascular injury and repair as in the setting of ISR [17]. The overlap between vascular and blood gene expression in one prior transcriptome analy-sis of ISR was supportive of our rationale to study PBMCs. For these reasons, and with the additional prior knowledge that inflammation plays a significant role in the development of ISR, we undertook a study of PBMCs
Table 2 Validated genes x(32 genes, 36 probesets) with annotation information and gene expression patterns, as shown in Figure 2
Affymetrix probesets Gene Symbol Gene Name Gene expression pattern
202502_at ACADM acyl-Coenzyme A dehydrogenase, C-4 to C-12 straight chain Consistent (ISR > No-ISR) 221504_s_at ATP6V1H ATPase, H+ transporting, lysosomal 50/57 kDa, V1 subunit H Consistent (ISR > No-ISR)
202654_x_at AXOT axotrophin Consistent (ISR > No-ISR)
212460_at C14orf147 chromosome 14 open reading frame 147 Divergent (ISR > No-ISR) 203994_s_at C21orf2 chromosome 21 open reading frame 2 Consistent (No-ISR > ISR) 203996_s_at C21orf2 chromosome 21 open reading frame 2 Consistent (No-ISR > ISR) 208374_s_at CAPZA1 capping protein (actin filament) muscle Z-line, alpha 1 Consistent (ISR > No-ISR) 217886_at EPS15 epidermal growth factor receptor pathway substrate 15 Consistent (ISR > No-ISR) 218646_at FLJ20534 hypothetical protein FLJ20534 Consistent (ISR > No-ISR) 204829_s_at FOLR2 folate receptor 2 (fetal) Consistent (ISR > No-ISR) 220131_at FXYD7 FXYD domain containing ion transport regulator 7 Consistent (No-ISR > ISR)
217814_at GK001 GK001 protein Consistent (ISR > No-ISR)
218092_s_at HRB HIV-1 Rev binding protein Consistent (ISR > No-ISR) 212411_at IMP4 U3 snoRNP protein 4 homolog Divergent (No-ISR > ISR) 200821_at LAMP2 lysosomal-associated membrane protein 2 Consistent (ISR > No-ISR)
203276_at LMNB1 lamin B1 Consistent (ISR > No-ISR)
214773_x_at MGC3794 putative MAPK activating protein Consistent (ISR > No-ISR) 212803_at NAB2 NGFI-A binding protein 2 (EGR1 binding protein 2) Consistent (No-ISR > ISR) 203371_s_at NDUFB3 NADH dehydrogenase (ubiquinone) 1 beta subcomplex, 3, 12 kDa Consistent (ISR > No-ISR) 218047_at OSBPL9 oxysterol binding protein-like 9 Consistent (ISR > No-ISR) 221123_x_at PBF papillomavirus regulatory factor PRF-1 Consistent (No-ISR > ISR) 208857_s_at PCMT1 protein-L-isoaspartate (D-aspartate) O-methyltransferase Consistent (ISR > No-ISR) 205202_at PCMT1 protein-L-isoaspartate (D-aspartate) O-methyltransferase Consistent (ISR > No-ISR) 209345_s_at PI4KII phosphatidylinositol 4-kinase type II Consistent (No-ISR > ISR) 201222_s_at RAD23B RAD23 homolog B (S. cerevisiae) Divergent (ISR > No-ISR) 201223_s_at RAD23B RAD23 homolog B (S. cerevisiae) Consistent (ISR > No-ISR) 209207_s_at SEC22L1 SEC22 vesicle trafficking protein-like 1 (S. cerevisiae) Consistent (ISR > No-ISR) 217758_s_at SMBP SM-11044 binding protein Consistent (ISR > No-ISR) 203605_at SRP54 signal recognition particle 54 kDa Consistent (ISR > No-ISR) 212513_s_at USP33 ubiquitin specific protease 33 Consistent (ISR > No-ISR) 201807_at VPS26 vacuolar protein sorting 26 (yeast) Consistent (ISR > No-ISR) 210849_s_at VPS41 vacuolar protein sorting 41 (yeast) Divergent (ISR > No-ISR)
205126_at VRK2 vaccinia related kinase 2 Divergent (ISR > No-ISR)
216304_x_at YME1L1 YME1-like 1 (S. cerevisiae) Consistent (ISR > No-ISR) 201351_s_at YME1L1 YME1-like 1 (S. cerevisiae) Consistent (ISR > No-ISR)
67
8
9
DN EF LF
67 8 9 RAD23B CardioGene lo g2(G E ) ISR non-ISR
q-value = 0.007
678
9
1
0
DN EF LF
678 9 1 0 GK001 CardioGene lo g2(G E ) ISR non-ISR
q-value = 0.009
6. 0 6. 5 7. 0 7. 5 8. 0 8 .5 9. 0 DN LF 6. 0 6. 5 7. 0 7. 5 8. 0 8 .5 9. 0 RAD23B deCODE lo g2 (G E )
q-value = 0.004
5. 5 6. 0 6. 5 7 .0 DN LF 5. 5 6. 0 6. 5 7 .0 GK001 deCODE lo g2 (G E )
q-value = 0.002
45
67
89
DN EF LF
45 67 89 LMNB1 CardioGene lo g2(G E ) ISR non-ISR
q-value = 0.01
678
9
1
0
DN EF LF
678 9 1 0 OSBPL9 CardioGene lo g2(G E ) ISR non-ISR
q-value = 0.01
67 89 DN LF 67 89 LMNB1 deCODE lo g2 (G E )
q-value = 0.027
7. 0 7. 5 8. 0 8. 5 DN LF 7. 0 7. 5 8. 0 8. 5 OSBPL9 deCODE lo g2 (G E )
q-value = 0.011
9. 5 1 0. 0 10 .5 11. 0 11. 5
DN EF LF
9. 5 1 0. 0 10 .5 11. 0 11. 5 CAPZA1 CardioGene lo g2(G E ) ISR non-ISR
q-value = 0.01
6
.57
.07
.58
.0
DN EF LF
6 .57 .07 .58 .0 SEC22L1 CardioGene lo g2(G E ) ISR non-ISR
q-value = 0.01
9. 5 10. 0 10 .5 11 .0 DN LF 9. 5 10. 0 10 .5 11 .0 CAPZA1 deCODE lo g2(G E )
q-value = 0.002
4. 5 5 .0 5. 5 6. 0 6. 5 7. 0 DN LF 4. 5 5 .0 5. 5 6. 0 6. 5 7. 0 SEC22L1 deCODE lo g2(G E )
q-value = 4e-04
67
89
DN EF LF
67 89 ACADM CardioGene lo g2(G E ) ISR non-ISR
q-value = 0.013
6. 5 7 .0 7. 5 8. 0 8. 5
DN EF LF
6. 5 7 .0 7. 5 8. 0 8. 5 C21orf2 CardioGene lo g2(G E ) ISR non-ISR
q-value = 0.013
45 67 DN LF 45 67 ACADM deCODE lo g2(G E )
q-value = 0.003
5. 0 5 .4 5. 8 6 .2 DN LF 5. 0 5 .4 5. 8 6 .2 C21orf2 deCODE lo g2(G E )
q-value = 0.009
56789
DN EF LF
56789 NAB2 CardioGene lo g2(G E ) ISR non-ISR
q-value = 0.016
5. 0 6. 0 7. 0 8. 0
DN EF LF
5. 0 6. 0 7. 0 8. 0 LAMP2 CardioGene lo g2(G E ) ISR non-ISR
q-value = 0.043
5. 0 5. 5 6. 0 6. 5 7. 0 DN LF 5. 0 5. 5 6. 0 6. 5 7. 0 NAB2 deCODE lo g2(G E
) q-value = 0.021
6. 5 7 .0 7. 5 8 .0 8. 5 9. 0 DN LF 6. 5 7 .0 7. 5 8 .0 8. 5 9. 0 LAMP2 deCODE lo g2(G E )
q-value = 0.004
Figure 4Gene expression for the top eight genes,NAB2andLAMP2. Gene expression plots are shown for the top eight ranked genes, and
in several hundred patients, with adequately powered replication testing for our top discovery findings. Addi-tionally, we use a time course analysis method that improved our ability to detect gene expression signals between the two comparison groups, overcoming some of the difficulty of substantial variability in single point microarray gene expression data.
To address the possibility of false positives identified with our statistical methods, we conducted replication analyses in the independent sample of deCODE samples and we conducted bootstrap resampling to assess signifi-cance of the findings. Through this sensitivity analysis, we demonstrated that the validation of 36 probe sets is not likely to be due to chance. Additional potential limitations of this study of ISR are the use of a clinical restenosis out-come, rather than an angiographic outout-come, in which clinically silent ISR may have been missed, and the choice of tissue analyzed, as discussed. The CardioGene and deCODE cohorts differ in the incidence of ISR (16.7% in the CardioGene Study and 28.8% in deCODE) with the patients in the deCODE sample showing overall lower residual percent stenosis in the treated lesion after stent implantation. Also, the proportions with hyperlipidemia and diabetes differ. However, despite the differences in the cohorts, we find replication of a substantial proportion of the discovery findings.
Conclusions
In summary, we have used a method to analyze gene expression in serial blood samples and identified a set of genes that show differential expression in the blood of patients who develop ISR after BMS implantation, com-pared to those who do not. These gene expression pat-terns of adverse vascular remodeling suggest possible hypotheses for the mechanisms of injury-induced remo-deling observed in both ISR and CAD, since ISR is a niche phenotype occurring in a subset of patients with CAD. Further studies are needed to investigate the func-tional relevance of these genes and are warranted based upon the findings of this study.
Methods
Study samples
The CardioGene Study was an IRB-approved, prospec-tive cohort study of 358 patients enrolled at the time of bare metal stent (BMS) implantation to treat de novo, previously untreated native coronary artery lesions at William Beaumont Hospital (Royal Oak, Michigan, USA) and the Mayo Clinic (Rochester, Minnesota, USA). Patients were followed for one year to determine ISR outcomes (Figure 1). Enrollment began in February 2002 and was closed in September 2003, prior to the approval and clinical use of drug-eluting stents (DES) in the United States. The protocol was approved by the
NHLBI IRB as well as the IRB at each of the clinical enrollment sites. Informed consent was provided by each patient. Standardized case report forms were used to collect baseline clinical data and outcome information in follow-up [2]. Since gene expression discovery studies may suffer from false positives, despite the use of statis-tical corrections for multiple hypothesis testing, we sought out independent validation of the primary find-ings of the CardioGene Study in a separate cohort. For independent replication testing, 97 patients undergoing stent implantation with BMS were enrolled in Iceland by collaborators at Landispitali University Hospital and University of Iceland, and RNA samples were provided through a contract with deCODE Genetics, Inc. The study was approved by the National Bioethics Commit-tee and the Data Protection Authority of Iceland, and each patient provided informed consent for participation in the study. Clinical characteristics of both study cohorts are summarized in Table 1.
Clinical phenotype
Consecutive patients presenting to the cardiac catheteri-zation laboratories of the clinical enrollment sites were approached for participation in the study. Follow-up clinical evaluation was performed via patient interview and review of all available medical records at 6 months and 12 months post-stent (Figure 1). ISR was defined as clinical restenosis [2], which was defined by ischemic symptoms after stent implantation and evidence of flow limitation in the treated vessel by either invasive or non-invasive testing. Follow-up angiography was not specifically performed for the CardioGene Study. Any available angiographic data performed as part of each patient’s clinical care was recorded. The Icelandic subset had follow-up angiography of all patients at 6 months. Quantitative coronary angiography (QCA) in the Cardi-oGene Study was performed by a single QCA reader, and by a TIMI core QCA center for the Icelandic subset.
PBMC Microarray Analysis
contamination. All blood processing was completed within 4 hours of blood draw, at room temperature. Snap-frozen PBMCs samples were shipped to the NIH laboratory, and RNA isolation was performed using the Qiagen RNA isolation protocol, with DNase treatment. RNA labeling and microarray image analysis was accord-ing to the Affymetrix U133A protocol. To minimize the impact of batch-to-batch variation, the multiple samples from each patient were processed together through all stages, and the order of RNA labeling and microarray hybridization was randomized. The same methods were used in the CardioGene and deCODE study samples, and microarray analysis was conducted on all samples at the NIH. In both studies, technicians performing the assays were blinded to the clinical status of patients.
Statistical Analysis
Raw image data were normalized using RMA (Robust multichip average) normalization [44]. Several steps of quality control were performed. These included the investigation of the residual plots using affyPLM, gender match using a linear discriminant analysis and shrunken centroid method [45-47]. Probes with values less than 6 in log 2 scale in more than two thirds of samples were excluded, and age and gender were adjusted before the analysis [48].
In the study design of the time course of blood gene expression profiling, the follow-up times were set at 2 weeks and 6 months for the early and late follow-up. A window was set at each of the time points, with the early follow-up designated as any time 2-4 weeks post-stent and the late follow-up designated as any time between 5-7 months for patients seen at 6 months. If patients did not return for follow-up at the 6 month time point, an attempt was made to have the patient provide the late follow-up blood sample at 12 months post-stent, at the time when final clinical ascertainment for ISR was made. As a result of the use of time windows, we were able to increase ascertainment of follow-up blood samples, but the actual sample collection intervals after stent implantation were not precisely spaced. To analyze such data, we used the time varying intercept model using a B-spline basis of dimension 2 based on only one knot at the median follow-up time (which was 14 days) (Addi-tional File 3) [49]. This is because the majority of the early follow-up is centered around 14 days. The model was fit under the null hypothesis using combined samples of ISR and non-ISR patients, and under the alternative hypothesis where separate models were fitted for ISR and non-ISR patients, respectively. The test statistic is the improvement in the fitted model under the alternative hypothesis from that under the null hypothesis, as measured by the relative difference in the residual sum of squares. The bootstrap method was used to estimate the p-value of this test
statistic [47,49]. To obtain accuracy in estimating the p-values, 10 million bootstrap samples were generated. Significant probe sets were selected based on an FDR-adjusted q-value less than 0.05 [50].
The replication analysis was performed in an indepen-dent set of samples, using deCODE samples from patients enrolled in Iceland, to validate probe sets iden-tified by the time course analysis of the CardioGene samples. We performed the same analysis using the time varying intercept model. P-values were estimated based on 100,000 bootstrap samples, and FDR adjusted q-value of 0.05 was, again, used to select significant probe sets. Here the adjustment was based on the selected set of genes since it was a replication analysis. As a sensitivity analysis and to evaluate whether any random set of 46 probe sets would result in significant results as we saw in the analysis of deCODE samples, we randomly selected 46 probe sets, and repeated the validation analysis. This procedure was repeated 100 times, and the number of probe sets yielding an FDR value less than 0.05 was observed.
Data analyses were performed based on the R lan-guage utilizing libraries freely available via the Biocon-ductor project.
Box plots were generated using the default R software options. The upper whisker is the data point which is 1.5 times the difference between 75th percentile and median from the upper bound of the box, and lower whisker is 1.5 times the difference between median and 25th percentile from the lower bound of the box. Over-all, the whisker represents the data point which is 1.5 times the interquartile range from the box.
Finally, to evaluate genes identified in a prior studies of ISR [23,24], we analyzed the reported genes in our data, at the baseline timepoint comparing normalized gene expression values between ISR cases and no-ISR controls and also against our timecourse analysis results.
Pathway analysis
Annotation of probe sets was done using the NetAffx (Affymetrix U133A library set) and the DAVID/EASE software, which provides gene name and functional annotation of probe sets [51,52]. Analysis of over-repre-sentation, using a Fisher’s exact test of over-representa-tion of genes from different funcover-representa-tional categories based on gene ontology classifications, was performed.
Additional material
Additional file 3: Supporting Materials. Statistical methods and lists of probe IDs discovered and replicated.
List of abbreviations
BMS: bare metal stents; CAD: coronary atherosclerotic disease; DES: drug-eluting stents; ISR: in-stent restenosis; PBMC: peripheral blood mononuclear cells.
Acknowledgements
This work was supported by the Division of Intramural Research of the National Heart, Lung and Blood Institute, National Institutes of Health.
Author details
1
National Heart, Lung, and Blood Institute (NHLBI), Division of Intramural Research, Bethesda, Maryland, USA.2Office of Biostatistics Research, National
Heart Lung and Blood Institute, National Institutes of Health, USA.3Geisinger Clinic, Danville, Pennsylvania, USA.4Division of Cardiovascular Medicine, Ohio
State University Medical Center, Columbus, Ohio, USA.5Department of Cardiovascular Medicine, Wellcome Trust Centre of Human Genetics, Oxford, UK.6Cardiovascular Research Center, Landspitali University Hospital, Reykjavik,
Iceland.7University of Iceland, Reykjavik, Iceland.8Divsion of Cardiovascular
Diseases, Mayo Clinic, Rochester, Minnesota, USA.9Division of Cardiology,
Department of Internal Medicine, Miller School of Medicine, University of Miami, Miami, Florida, USA.
Authors’contributions
Study design (EGN, JJ, KAS, NLG, SKG, WON), CardioGene clinical enrollment and blood and data collection (DRH, KAS, KON, LM, RDS, SKG, WON), deCODE clinical enrollment and data collection (AH, KA, GT, TG), RNA expression data generation (EMB, KON, SKG), Data analysis (JJ, SKG), Manuscript preparation (AH, DRH, EGN, JJ, SKG, WON).
All authors read and approved the final manuscript.
Conflict of Interest Disclosures
The authors declare that they have no competing interests.
Received: 16 August 2010 Accepted: 28 February 2011 Published: 28 February 2011
References
1. Tanner FC,et al:Expression of cyclin-dependent kinase inhibitors in vascular disease.Circ Res1998,82(3):396-403.
2. Ganesh SK,et al:Rationale and study design of the CardioGene Study: genomics of in-stent restenosis.Pharmacogenomics2004,5(7):952-1004. 3. Santiago FS, Atkins DG, Khachigian LM:Vascular smooth muscle cell
proliferation and regrowth after mechanical injury in vitro are Egr-1/NGFI-A-dependent.Am J Pathol1999,155(3):897-905.
4. Silverman ES,et al:Vascular smooth muscle cells express the
transcriptional corepressor NAB2 in response to injury.Am J Pathol1999,
155(4):1311-7.
5. Goetze S,et al:TNFalpha induces expression of transcription factors c-fos, Egr-1, and Ets-1 in vascular lesions through extracellular signal-regulated kinases 1/2.Atherosclerosis2001,159(1):93-101.
6. Hasan RN, Schafer AI:Hemin upregulates Egr-1 expression in vascular smooth muscle cells via reactive oxygen species ERK-1/2-Elk-1 and NF-kappaB.Circ Res2008,102(1):42-50.
7. Morawietz H,et al:Rapid induction and translocation of Egr-1 in response to mechanical strain in vascular smooth muscle cells.Circ Res
1999,84(6):678-87.
8. Ling S,et al:Matrix-dependent gene expression of egr-1 and PDGF A regulate angiotensin II-induced proliferation in human vascular smooth muscle cells.Hypertension1999,34(5):1141-6.
9. Sachinidis A,et al:Thromboxane A2 and vascular smooth muscle cell proliferation.Hypertension1995,26(5):771-80.
10. Grote K,et al:Stretch-inducible expression of the angiogenic factor CCN1 in vascular smooth muscle cells is mediated by Egr-1.J Biol Chem2004,
279(53):55675-81.
11. McCaffrey TA,et al:High-level expression of Egr-1 and Egr-1-inducible genes in mouse and human atherosclerosis.J Clin Invest2000,
105(5):653-62.
12. Santiago FS,et al:New DNA enzyme targeting Egr-1 mRNA inhibits vascular smooth muscle proliferation and regrowth after injury.Nat Med
1999,5(11):1264-9.
13. Kannan K,et al:Lysosome-associated membrane proteins h-LAMP1 (CD107a) and h-LAMP2 (CD107b) are activation-dependent cell surface glycoproteins in human peripheral blood mononuclear cells which mediate cell adhesion to vascular endothelium.Cell Immunol1996,
171(1):10-9.
14. Spellman PT,et al:Comprehensive identification of cell cycle-regulated genes of the yeast Saccharomyces cerevisiae by microarray hybridization.Mol Biol Cell1998,9(12):3273-97.
15. Svaren J,et al:NAB2, a corepressor of NGFI-A (Egr-1) and Krox20, is induced by proliferative and differentiative stimuli.Mol Cell Biol1996,
16(7):3545-53.
16. Zohlnhofer D,et al:Gene expression profiling of human stent-induced neointima by cDNA array analysis of microscopic specimens retrieved by helix cutter atherectomy: Detection of FK506-binding protein 12 upregulation.Circulation2001,103(10):1396-402.
17. Zohlnhofer D,et al:Transcriptome analysis reveals a role of interferon-gamma in human neointima formation.Mol Cell2001,7(5):1059-69. 18. Ashley EA,et al:Network analysis of human in-stent restenosis.Circulation
2006,114(24):2644-54.
19. Blaschke F,et al:C-reactive protein induces apoptosis in human coronary vascular smooth muscle cells.Circulation2004,110(5):579-87.
20. Fleiner M,et al:Arterial neovascularization and inflammation in vulnerable patients: early and late signs of symptomatic atherosclerosis. Circulation2004,110(18):2843-50.
21. Heymans S,et al:Increased cardiac expression of tissue inhibitor of metalloproteinase-1 and tissue inhibitor of metalloproteinase-2 is related to cardiac fibrosis and dysfunction in the chronic pressure-overloaded human heart.Circulation2005,112(8):1136-44. 22. Yuan M, Kendziorski C:A unified approach for simultaneous gene
clustering and differential expression identification.Biometrics2006,
62(4):1089-98.
23. Chu S,et al:The transcriptional program of sporulation in budding yeast. Science1998,282(5389):699-705.
24. DeRisi JL, Iyer VR, Brown PO:Exploring the metabolic and genetic control of gene expression on a genomic scale.Science1997,278(5338):680-6. 25. Le N,et al:Nab proteins are essential for peripheral nervous system
myelination.Nat Neurosci2005,8(7):932-40.
26. Lucerna M,et al:NAB2, a corepressor of EGR-1, inhibits vascular endothelial growth factor-mediated gene induction and angiogenic responses of endothelial cells.J Biol Chem2003,278(13):11433-40. 27. Nguyen KT,et al:Molecular responses of vascular smooth muscle cells
and phagocytes to curcumin-eluting bioresorbable stent materials. Biomaterials2004,25(23):5333-46.
28. Fukuda M,et al:Cloning of cDNAs encoding human lysosomal membrane glycoproteins, h-lamp-1 and h-lamp-2. Comparison of their deduced amino acid sequences.J Biol Chem1988,263(35):18920-8. 29. Charron P,et al:Danon’s disease as a cause of hypertrophic
cardiomyopathy: a systematic survey.Heart2004,90(8):842-6. 30. Libby P:Inflammation in atherosclerosis.Nature2002,420(6917):868-74. 31. Ross R:Atherosclerosis–an inflammatory disease.N Engl J Med1999,
340(2):115-26.
32. Nguyen KT,et al:Molecular responses of vascular smooth muscle cells to paclitaxel-eluting bioresorbable stent materials.J Biomed Mater Res A
2004,69(3):513-24.
33. Haft CR,et al:Human orthologs of yeast vacuolar protein sorting proteins Vps26, 29, and 35: assembly into multimeric complexes.Mol Biol Cell2000,11(12):4105-16.
34. Lutcke H,et al:The methionine-rich domain of the 54 kDa subunit of signal recognition particle is sufficient for the interaction with signal sequences.Embo J1992,11(4):1543-51.
35. Garcia-Closas M,et al:Genetic variation in the nucleotide excision repair pathway and bladder cancer risk.Cancer Epidemiol Biomarkers Prev2006,
36. Mechanic LE,et al:Polymorphisms in nucleotide excision repair genes, smoking and breast cancer in African Americans and whites: a population-based case-control study.Carcinogenesis2006,27(7):1377-85. 37. Huang WY,et al:Nucleotide excision repair gene polymorphisms and risk
of advanced colorectal adenoma: XPC polymorphisms modify smoking-related risk.Cancer Epidemiol Biomarkers Prev2006,15(2):306-11. 38. Shen M,et al:Polymorphisms in the DNA nucleotide excision repair
genes and lung cancer risk in Xuan Wei, China.Int J Cancer2005,
116(5):768-73.
39. Boehm M, Nabel EG:The cell cycle and cardiovascular diseases.Prog Cell Cycle Res2003,5:19-30.
40. Kelly DP,et al:Molecular characterization of inherited medium-chain acyl-CoA dehydrogenase deficiency.Proc Natl Acad Sci USA1990,
87(23):9236-40.
41. Zhu H,et al:A known functional polymorphism (Ile120Val) of the human PCMT1 gene and risk of spina bifida.Mol Genet Metab2006,87(1):66-70. 42. Boyles AL,et al:Neural tube defects and folate pathway genes:
family-based association tests of gene-gene and gene-environment interactions.Environ Health Perspect2006,114(10):1547-52.
43. O’Leary VB,et al:Analysis of the human folate receptor beta gene for an association with neural tube defects.Mol Genet Metab2003,79(2):129-33. 44. Irizarry RA,et al:Exploration, normalization, and summaries of high
density oligonucleotide array probe level data.Biostatistics2003,
4(2):249-64.
45. Tibshirani R,et al:Diagnosis of multiple cancer types by shrunken centroids of gene expression.Proc Natl Acad Sci USA2002,
99(10):6567-72.
46. Gentleman RC,et al:Bioconductor: open software development for computational biology and bioinformatics.Genome Biol2004,5(10):R80. 47. Bolstad BM,et al:A comparison of normalization methods for high
density oligonucleotide array data based on variance and bias. Bioinformatics2003,19(2):185-93.
48. Dave SS,et al:Prediction of survival in follicular lymphoma based on molecular features of tumor-infiltrating immune cells.N Engl J Med2004,
351(21):2159-69.
49. Huang JZ, W C, Zhou L:Varying-coefficient models and basis function approximations for the analysis of repeated measurements.Biometrika
2002,89(1):111-128.
50. Storey JD, Tibshirani R:Statistical significance for genomewide studies. Proc Natl Acad Sci USA2003,100(16):9440-5.
51. Hosack DA,et al:Identifying biological themes within lists of genes with EASE.Genome Biol2003,4(10):R70.
52. Dennis G Jr,et al:DAVID: Database for Annotation, Visualization, and Integrated Discovery.Genome Biol2003,4(5):P3.
Pre-publication history
The pre-publication history for this paper can be accessed here: http://www.biomedcentral.com/1755-8794/4/20/prepub
doi:10.1186/1755-8794-4-20
Cite this article as:Ganeshet al.:Time course analysis of gene expression identifies multiple genes with differential expression in patients with in-stent restenosis.BMC Medical Genomics20114:20.
Submit your next manuscript to BioMed Central and take full advantage of:
• Convenient online submission
• Thorough peer review
• No space constraints or color figure charges
• Immediate publication on acceptance
• Inclusion in PubMed, CAS, Scopus and Google Scholar
• Research which is freely available for redistribution