www.geosci-model-dev.net/8/1339/2015/ doi:10.5194/gmd-8-1339-2015
© Author(s) 2015. CC Attribution 3.0 License.
Development of the GEOS-5 atmospheric general circulation model:
evolution from MERRA to MERRA2
A. Molod1, L. Takacs2, M. Suarez3, and J. Bacmeister4 1University of Maryland College Park, College Park, MD, USA 2Science Systems and Applications, Inc., Lanham, MD, USA 3NASA Goddard Space Flight Center, Greenbelt, MD, USA 4National Center for Atmospheric Research, Boulder, CO, USA
Correspondence to: A. Molod (andrea.molod@nasa.gov)
Received: 2 September 2014 – Published in Geosci. Model Dev. Discuss.: 13 November 2014 Revised: 24 March 2015 – Accepted: 30 March 2015 – Published: 12 May 2015
Abstract. The Modern-Era Retrospective Analysis for Re-search and Applications-2 (MERRA2) version of the God-dard Earth Observing System-5 (GEOS-5) atmospheric gen-eral circulation model (AGCM) is currently in use in the NASA Global Modeling and Assimilation Office (GMAO) at a wide range of resolutions for a variety of applica-tions. Details of the changes in parameterizations subsequent to the version in the original MERRA reanalysis are pre-sented here. Results of a series of atmosphere-only sensi-tivity studies are shown to demonstrate changes in simu-lated climate associated with specific changes in physical pa-rameterizations, and the impact of the newly implemented resolution-aware behavior on simulations at different resolu-tions is demonstrated. The GEOS-5 AGCM presented here is the model used as part of the GMAO MERRA2 reanaly-sis, global mesoscale simulations at 10 km resolution through 1.5 km resolution, the real-time numerical weather prediction system, and for atmosphere-only, coupled ocean-atmosphere and coupled atmosphere-chemistry simulations.
The seasonal mean climate of the MERRA2 version of the GEOS-5 AGCM represents a substantial improvement over the simulated climate of the MERRA version at all resolu-tions and for all applicaresolu-tions. Fundamental improvements in simulated climate are associated with the increased evaporation of frozen precipitation and cloud condensate, re-sulting in a wetter atmosphere. Improvements in simulated climate are also shown to be attributable to changes in the background gravity wave drag, and to upgrades in the re-lationship between the ocean surface stress and the ocean roughness. The series of resolution-aware parameters related
to the moist physics was shown to result in improvements at higher resolutions and result in AGCM simulations that ex-hibit seamless behavior across different resolutions and ap-plications.
1 Introduction
1340 A. Molod et al.: Development of the GEOS-5 atmospheric general circulation model
Table 1. Changes in GCM Algorithms from MERRA to MERRA2.
Module Algorithm change Comments
Moist
Increased re-evaporation of precipitation Fundamental change in model climate Modified autoconversion Fundamental change in model climate Modified effective radius of cloud drops Fundamental change cloud forcing Anvil fractions cut in half Fundamental change cloud forcing AutoConvert “warm fog” Important change in coupled simulations New critical RH with resolution dependance Substantial change in simulated moisture Cloud base set at planetary boundary layer (PBL) depth Remove clouds detraining below PBL height RAS timescale no longer depends on turbulence
Stochastic RAS with resolution dependance Substantial impact at high resolution
Turb
Remove restrictions on diffusion from Louis Increase near surface diffusion Reformulate turbulent length scale in Louis
Reduce Lock scheme when there is wind shear Impact on marine PBL Reduce cloud top entrainment for Lock plumes Impact on marine PBL
Surf
Implement Helfand and Schubert scheme
Remove viscous sublayer over land surfaces Improve land temperatures Change ocean roughness for middle wind regimes Reduce wind bias in S. Ocean Change ocean roughness high wind regimes Increase tropical cyclone intensity
Land surf Changed parameters for evapotranspiration Impact on ratio of surface to canopy evaporation
GW (Gravity Wave) Changed profile of background drag Substantial impact on QBO
drag Added intermittency of drag Impact on timing of winter jet breakup
resolution-aware parameters were implemented in the moist process parameterizations.
Many studies exist that describe major improvements in new versions of AGCMs and show the improvements in simulations as compared to reanalyses and other observa-tions (i.e., Neale et al., 2013; Donner, et al., 2011; Pope et al., 2000). The present study adds to that type of analysis by carefully documenting the connection between individ-ual changes in the physical parameterizations of the AGCM and improvements in the climate simulation at coarse res-olution. A series of sensitivity experiments were conceived and analyzed to explore, step by step, each important change in parameterizations between the MERRA and MERRA2 AGCMs, and to demonstrate the impact on the simulated climate. The present study also describes and analyzes the improvements in high-resolution simulations due to some changes in parameterizations specifically targeted for those resolutions.
The details of the changes in the AGCM physical parame-terizations are described in the next section, the step by step experiments to isolate the impacts of these changes are de-scribed in Sect. 3, and the impacts of the resolution-aware aspects of the AGCM are described in Sect. 4. The study is summarized in Sect. 5.
2 Description of the MERRA2 version of the GEOS-5 AGCM
Table 2. Experiments to attribute MERRA to MERRA2 AGCM simulation changes to changes in parameterizations.
Experiment Description
Control
Exp. 1 Back off change in ocean roughness Exp. 2 Exp. 1+Back off gravity wave background
drag and surface hydrology
Exp. 3 Exp. 2+use old surface layer parameterization Exp. 4 Exp. 3+Back off increase of
Richardson-number diffusion
Exp. 5 Exp. 4+Back off decrease of critical RH aloft and decrease below
Exp. 6 Exp. 5+Back off increase of all re-evaporation
Exp. 7 Exp. 6+Back off gravity wave drag intermittency
A brief summary of the model’s physical parameteriza-tions relevant to the present study is provided here. The GEOS-5 AGCM physics includes parameterization schemes for atmospheric convection, large-scale precipitation and cloud cover, longwave and shortwave radiation, turbulence, gravity wave drag, a land surface model, a thermodynamic sea ice model, and a simple glacier model.
Convection is parameterized using the Relaxed Arakawa– Schubert (RAS) scheme of Moorthi and Suarez (1992) and includes a scheme for the generation and re-evaporation of falling rain (Bacmeister et al., 2006). A stochastic Tokioka trigger function (Bacmeister and Stephens, 2011) governs the lower limits on the allowable entrainment by sampling from a probability distribution function (PDF) with specified pa-rameters. The prognostic cloud cover and cloud water and ice scheme is from Bacmeister et al. (2006). The scheme includes large-scale condensation governed by the PDF de-scribed in Molod (2012), evaporation, autoconversion and accretion of cloud water and ice, sedimentation of cloud ice, and re-evaporation of falling precipitation.
The turbulence parameterization that acts above the sur-face layer is based on the non-local scheme of Lock et al. (2000), acting together with the Richardson-number-based scheme of Louis and Geleyn (1982). The original Lock scheme was extended in GEOS-5 to include moist heat-ing and entrainment in the unstable surface parcel calcula-tions. The parameterization of surface layer turbulence is the Monin–Obukhov similarity theory based scheme described in Helfand and Schubert (1995), and includes the effects of a viscous sublayer for heat and moisture transport over all surfaces except land. The ocean roughness is determined by a polynomial which is a blend of the algorithms of Large and Pond (1981) and Kondo (1975), modified in the mid-range wind regime based on recent observations in the Southern
Figure 1. Scatter diagram of surface wind speed (m s−1) vs. ocean roughness (mm) in the MERRA (green) and MERRA2 (black) AGCMs.
Ocean according to Garfinkel et al. (2011) and in the high wind regime according to Molod et al. (2013).
The longwave radiative processes are described by Chou and Suarez (1994), and the shortwave radiative processes are from Chou and Suarez (1999). The gravity wave parame-terization computes the momentum and heat deposition into the grid-scale flow due to orographic (McFarlane, 1987) and non-orographic (after Garcia and Boville, 1994) gravity wave breaking. The land surface model from Koster et al. (2000) is a catchment-based scheme that treats subgrid-scale het-erogeneity in surface moisture statistically. Glacial thermo-dynamic process are parameterized using an adaptation of the Stieglitz et al. (2001) snow model to glacial ice (Cul-lather et al., 2014), and the catchment and glacier models are each coupled to the multi-layer snow model of Stieglitz et al. (2001). Sea ice albedos in the Northern Hemisphere are from the monthly mean observations of Duynkerke and de Roode (2001).
3 Evolution of low-resolution simulated climate from MERRA AGCM to MERRA2 AGCM
The mean climate characteristics of a single 30-year MERRA2 AGCM simulation on the latitude–longitude grid at a horizontal resolution of 0.5◦×0.5◦ were evaluated by
1342 A. Molod et al.: Development of the GEOS-5 atmospheric general circulation model
Figure 2. A 30-year average December-January-February surface wind speed (m s−1) from (a) MERRA2 control, (b) GSSTF, (c) control-GSSTF, (d) experiment 1, (e) experiment 1-GSSTF.
fundamental improvement in AGCM simulated climate to a specific change in parameterization.
The experiments to be described in this section were all conducted on the latitude–longitude grid at 2.0×2.5◦ hor-izontal resolution, on a vertical hybrid eta-pressure coordi-nate grid with 72 levels, spaced to increase the resolution near the surface and near the tropopause, with an upper lid at 0.01 mb. The simulations were all forced with observed sea surface temperatures (Reynolds et al., 2002), and ran for 30 years each. The sequence of experiments was designed to start with the MERRA2 AGCM as the control and backtrack, one parameterization change at a time or small groups of pa-rameterization changes as a time, to a model that replicates the MERRA AGCM simulated climate. The
parameteriza-tion changes are listed in Table 1, and the full sequence of the control and 7 sensitivity experiments to be described in this section is listed in Table 2.
3.1 Ocean surface winds
the relationship between ocean surface roughness and stress used in the MERRA AGCM. The effect for simulations at 2.◦×2.5◦resolution is expected to be an increase in
exper-iment 1’s simulated surface wind speeds in the mid-range of wind speeds, that is, in the 5–25 m s−1range. The rela-tionship between wind speed and roughness for the higher wind speeds in the MERRA2 AGCM is based on Molod et al. (2013), and the figure shows reduction of roughness at speeds greater than approximately 30 m s−1. This change is expected to result in a net increase of wind speeds in higher wind regimes, as was shown in Molod et al. (2013), for sim-ulations at 0.25◦resolution, but this impact is not apparent at the resolution of the experiments described here because the simulated wind speeds generally do not reach 30 m s−1.
Surface wind speeds from the MERRA2 AGCM con-trol and experiment 1 are shown in Fig. 2. The change in the simulated surface winds is most apparent in the South-ern Hemisphere, where the Goddard Satellite-based Sur-face Turbulent Fluxes (GSSTF; Shie et al., 2009) surSur-face winds, seen in Fig. 2b, show values near 8 m s−1, experi-ment 1 (Fig. 2d) shows surface winds near 12 m s−1, and the MERRA2 AGCM control (Fig. 2a) shows surface winds near 10 m s−1. The difference from the GSSTF estimate shows a reduction in the difference from up to 4 m s−1in experiment 1 (Fig. 2e) to a difference of up to 2 m s−1in the MERRA2 AGCM control (Fig. 2c), pointing out the improvement in AGCM simulated climate due to the change in roughness for-mulation.
3.2 Quasi-biennial oscillation
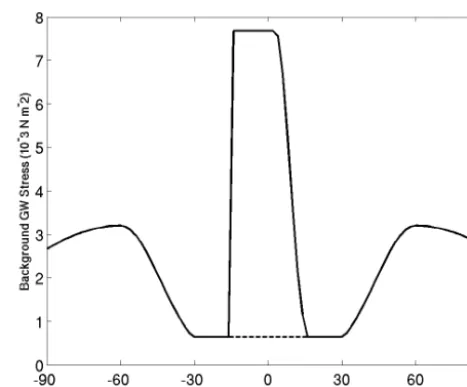
The non-orographic gravity wave source in the MERRA (and MERRA2) AGCMs is specified as a function of latitude, and the source level is 400 mb, after Garcia and Boville (1994). The gravity wave source spectrum is specified a priori, and includes wave components with phase velocities in the range of−40 to 40 m s−1, at intervals of 10 m s−1. The latitudinal profile of background non-orographic drag in the MERRA2 AGCM was modified to include a source related to tropi-cal precipitation in addition to the lotropi-cal maxima related to storm track precipitation. The use of this structure is based on the physical argument that the major sources for non-orographic gravity waves are convective and frontal systems. The MERRA2 AGCM profile was designed to mimic the be-havior of more complex models of non-orographic gravity wave sources such as the state-dependant model of Richter et al. (2010), or the spectral wave source models of Manzini et al. (1997) and Scaife et al. (2002).
The latitudinal dependance of the background non-orographic drag profiles used in the MERRA2 and the MERRA AGCMs are shown in Fig. 3. Experiment 2 of the series examines the impact of the change in the gravity wave drag parameterization of background drag in the tropics and returns to the MERRA AGCM background drag. Experiment 2 is therefore expected to exhibit a stratospheric wind with
Figure 3. Background non-orographic drag from the MERRA (dashed line) and MERRA2 AGCM (solid line) simulations. The dashed line underlies the solid line outside of the tropics.
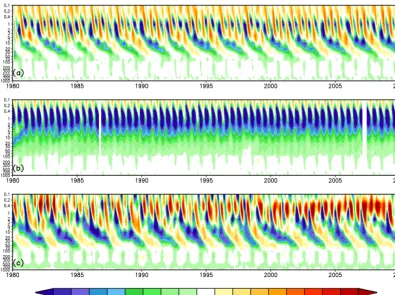
no quasi-biennial oscillation (QBO) variability. The tropical (latitude range 10◦S to 10◦N) zonal average of the zonal wind as a function of height and time is shown in Fig. 4. The patterns of large easterly and westerly winds that slant downwards in pressure as time proceeds indicate the down-ward propagation of the variations due to the QBO. The QBO pattern is seen in Fig. 4a and c, which are the results from experiment 1 from and MERRA reanalysis (Rienecker et al., 2011), respectively. Figure 4b, which shows the results of experiment 2 that uses the old background drag formulation (from Fig. 3), shows no QBO pattern of variability.
3.3 Stable surface layer fluxes
1344 A. Molod et al.: Development of the GEOS-5 atmospheric general circulation model
Figure 4. Spatial average of zonal wind in m s−1from 10◦S to 10◦N latitude as a function of pressure level in millibars and time from (a) MERRA2 AGCM control, (b) experiment 2 and (c) MERRA reanalysis.
Figure 5. Surface bulk Richardson number as a function of sensible heat flux in W m−2in a single July from experiment 3 (red) and experiment 2 (black).
mean air temperature exceeds the monthly mean skin tem-perature. The black points are from the simulation with the Helfand surface layer, and the red are from the simulation
using the surface layer from the Louis scheme. The larger values of sensible heat flux in the Helfand simulation are ap-parent, and even more apparent when the monthly mean sen-sible heat flux is downward.
Figure 6. June-July-August-averaged sensible heat flux in W m−2 from (a) experiment 3 (Louis surface layer scheme), (b) experiment 2 (Helfand scheme) and (c) the difference of experiment 3 minus experiment 2.
skin temperature). The change in stability functions between the Louis and Helfand schemes, which allows more turbulent exchange in the Helfand scheme, is consistent with the sign of the difference in sensible heat flux in regions where the heat flux is downward.
3.4 Atmospheric moisture, clouds and stationary wave pattern
3.4.1 Critical relative humidity
The algorithm for large-scale condensation, as described in Bacmeister et al. (2006), assumes that the PDF of total wa-ter is top-hat shaped. The width of the PDF can be shown to be associated with a critical relative humidity (RHcrit) that governs cloud macrophysical and microphysical processes such as condensation and evaporation (Molod, 2012). The relationship between RHcrit and PDF width is such that a wider PDF corresponds to a lower RHcrit. The MERRA2
Figure 7. Critical relative humidity. Black from MERRA AGCM formulation, blue from MERRA2 AGCM formulation for 2-degree resolution, purple from MERRA2 AGCM formulation for 1-degree resolution, brown from MERRA2 AGCM formulation for 1/ 2-degree resolution, green from MERRA2 AGCM formulation for 1/4-degree resolution, orange from MERRA2 AGCM formulation for 1/8-degree resolution.
AGCM RHcrit (Molod, 2012) represents a change in both the magnitude and vertical structure from the RHcrit in the MERRA AGCM. Typical RHcritprofiles from the MERRA and MERRA2 AGCMs are shown in Fig. 7, and indicate gen-erally lower values in the MERRA2 AGCM formulation ex-cept in the boundary layer, where turbulent mixing is suffi-cient to homogenize the total water distribution and so result in narrower PDF.
Experiment 5 was designed to examine the impact of the change in RHcrit. Removing this change, which for much of the atmosphere means a larger RHcrit, should result in a sim-ulation that is generally wetter because the atmosphere is be-ing adjusted back to a higher relative humidity (RH). The zonal mean RH from experiments 4 and 5, along with the difference between them, is shown in Fig. 8. The experiment 5 minus experiment 4 difference shows a clear increase in RH in the MERRA AGCM-like experiment due to the in-crease in RHcrit. Relative to available observational verifica-tion, the MERRA2 AGCM shows a general wet bias (Molod et al., 2012), which means that the RH field of experiment 4 is closer to the observational verification than the RH field of experiment 5.
at-1346 A. Molod et al.: Development of the GEOS-5 atmospheric general circulation model
Figure 8. December-January-February-averaged relative humidity in percent from (a) experiment 5 (MERRA AGCM-like), (b) exper-iment 4 (MERRA2 AGCM-like) and (c) the difference of experi-ment 5 minus experiexperi-ment 4.
mosphere with a higher RH (as seen in Fig. 8), which would be associated with increased cloud cover. One of these two effects may dominate, or they may cancel and the result would be no change in cloud cover.
Figure 9 shows the zonal mean cloud cover from experi-ments 4 and 5, and an observational estimate of zonal mean cloud cover from AIRS (Atmospheric Infrared Sounder). The MERRA AGCM-like experiment, experiment 5 (Fig. 9a), shows increased cloud cover in the 300–600 mb range rel-ative to the MERRA2 AGCM-like experiment, in particu-lar at high latitudes in both hemispheres. In this regard, the MERRA2 AGCM-like experiment result more closely re-sembles the AIRS cloud cover estimate (Fig. 9c).
The results shown here demonstrate that influence of the wetter atmosphere due to the higher RHcritis the dominant of the two competing effects in the GEOS-5 AGCM. It is not clear, however, precisely why the atmospheric RH increases beyond the change in RHcrit. It may be speculated that it is related to the sequencing of the macro- and micro-physical
Figure 9. December-January-February-averaged cloud fraction from (a) experiment 5 (MERRA AGCM-like), (b) experiment 4 (MERRA2 AGCM-like) and (c) AIRS retrievals.
Figure 11. (a) December-January-February total precipitable water in millimeters from experiment 6 (MERRA AGCM-like), (b) same as (a) but from experiment 5, (c) same as (a) but the difference of experiment 6 minus experiment 5, (d) December-January-February-specific humidity in g kg−1from experiment 6 (MERRA AGCM-like), (e) same as (d) but from experiment 5, (f) same as (d) but the difference of experiment 6 minus experiment 5.
processes in the moist parameterization combined with the enhanced rates of rain and condensate re-evaporation (see Sect. 3.4.2), leaving behind an atmosphere which is no longer in equilibrium with the specific RHcrit (wetter in our case). These sequencing issues are typical of AGCM moist param-eterizations, as can be seen, for example, in the complex se-quencing described in Gettelman et al. (2015).
The MERRA-like AGCM result (experiment 5) also shows smaller cloud cover near the boundary layer at almost all lat-itudes. At high latitudes, the MERRA2 AGCM-like bound-ary layer cloud more closely resembles the AIRS estimate, in the tropics the MERRA2 AGCM-like boundary layer cloud is larger than AIRS, while the MERRA AGCM-like bound-ary layer cloud is smaller. The change in boundbound-ary layer cloud between the MERRA AGCM-like experiment and the MERRA2 AGCM-like experiment is not consistent with the free atmosphere response to the RHcrit change because the presence of boundary layer turbulence makes RHcritless of a determining factor for model mean relative humidity there.
3.4.2 Re-evaporation of precipitation and condensate The MERRA2 AGCM scheme for the re-evaporation of pre-cipitation and suspended cloud water and ice contains a se-ries of new parameter settings that result in a substantial increase over the MERRA model in the re-evaporation of snow and ice. The impact of the changes in parameter set-tings on the water vapor source due to re-evaporation for the December-January-February average is shown in Fig. 10. The largest increase in the MERRA2 AGCM is aloft, near 500 mb, where the increase is up to 0.7 g kg−1day−1.
1348 A. Molod et al.: Development of the GEOS-5 atmospheric general circulation model
Figure 12. December-January-February total precipitation in mm day−1from (a) experiment 6 (MERRA AGCM-like), (b) GPCP, (c) the difference of experiment 6 minus GPCP, (d) experiment 5 (MERRA2 AGCM-like), (e) the difference of experiment 5 minus GPCP. The gray shading indicates land areas.
change from the MERRA2 AGCM to the MERRA AGCM re-evaporation, and, as expected, shows the drying related to the reduced re-evaporation in the MERRA AGCM-like ex-periment. Figure 11a–c show the change in total precipitable water, and the difference (MERRA AGCM formulation mi-nus MERRA2 AGCM formulation, shown in Fig. 11c) is al-ways negative everywhere. The vertical distribution of the moisture is shown with the specific humidity in Fig. 11d– f, where the difference plot (Fig. 11f) also shows an almost global reduction in atmospheric water vapor.
The resulting mean circulation in boreal winter under-went a substantial change associated with this drying, and represents the most substantial impact on the simulated
Figure 13. December-January-February 300 mb eddy height climatology in meters from (a) experiment 6 (MERRA AGCM-like), (b) MERRA, (c) the difference of experiment 6 minus MERRA, (d) experiment 5 (MERRA2 AGCM-like), (e) the difference of experiment 5 minus MERRA.
simulation (experiment 6) shown in Fig. 12a. The change in the tropical precipitation field related to the additional dry-ing in experiment 6 also resulted in substantial changes in the Pacific teleconnection patterns, specifically the Pacific– North America (PNA) pattern in boreal winter. The eddy height field is an indicator of the strength of the PNA, and is shown in Fig. 13 in relation to the eddy height from MERRA reanalysis. The MERRA2 AGCM-like simulated PNA pat-tern (Fig. 12d) has a stronger and more properly oriented ridge near the west coast of North America relative to the PNA as simulated by the MERRA AGCM-like experiment (Fig. 12a). This change has implications for the poleward propagation of heat and momentum. The standard deviation of the difference from MERRA reanalysis estimates is also substantially reduced in experiment 5 (16.8 m) relative to
ex-periment 6 (20.3 m). The direct impact of the change in re-evaporation was also evident in the boreal summer climatol-ogy. Figure 14 shows this both in the total precipitable water fields and in the specific humidity fields, where the differ-ences between experiments 5 and 6 are of the order of the differences seen in boreal winter. The impact on the mean summertime circulation, however, was minimal.
3.5 Breakup of the Southern Hemisphere stratospheric jet
1350 A. Molod et al.: Development of the GEOS-5 atmospheric general circulation model
Figure 14. (a) June-July-August total precipitable water in mm from experiment 6 (MERRA AGCM-like), (b) same as (a) but from ex-periment 5, (c) same as (a) but the difference of exex-periment 6 minus exex-periment 5, (d) June-July-August-specific humidity in g kg−1from experiment 6 (MERRA AGCM-like), (e) same as (d) but from experiment 5, (f) same as (d) but the difference of experiment 6 minus experiment 5.
orographic waves as a function of latitude, changing from a MERRA AGCM global value of 0.125 to values reaching 0.3125 south of approximately 40◦S. This behavior is based on observational evidence of strong gravity waves from iso-lated small mountains in the Antarctic peninsula (Alexan-der and Teitelbaum, 2007) and the South Georgia islands (Alexander et al., 2009).
Experiment 7 is the last experiment in the series, incor-porating the effects of all the fundamental changes between the MERRA and MERRA2 versions of the GEOS-5 AGCM. The removal of the intermittency change is expected to de-crease the orographically induced drag in the Southern Hemi-sphere, thereby depositing less momentum aloft and increas-ing the strength of the westerlies. The zero-wind contour of the zonal wind averaged from 50 to 70◦S in the South-ern Hemisphere can be used as an indicator of the level and timing of the stratospheric jet breakup. Figure 15 shows the zero-wind contour of the averaged zonal wind from exper-iment 7, experexper-iment 6, and MERRA. At the 2-degree hori-zontal resolution of the simulations described here, the
zero-wind line is higher in altitude and delayed in time relative to MERRA in both simulations, reflecting a delayed strato-spheric jet breakup. The decreased intermittency factor in experiment 7, however, delays the jet breakup even more, showing the improvement in the MERRA2 AGCM-like sim-ulation relative to the MERRA AGCM-like simsim-ulation. At higher spatial resolution (not shown) the increase of inter-mittency factor in the MERRA2 AGCM is effective in pro-ducing a reasonable evolution of the polar vortex breakdown in the Southern Hemisphere.
4 High-resolution simulations and resolution-aware behavior in the MERRA2 AGCM
Figure 15. The annual cycle of the zero contour of the 30-year-averaged zonal mean zonal wind, averaged from 70 to 50◦S latitude in m s−2 from experiment 7 in red (MERRA AGCM-like), experiment 6 in blue (MERRA2 AGCM-like) and MERRA in green.
ocean surface roughness at high wind speeds (mentioned in Sect. 3.1 and examined in detail in Molod et al., 2013) and the implementation of resolution-aware parameters.
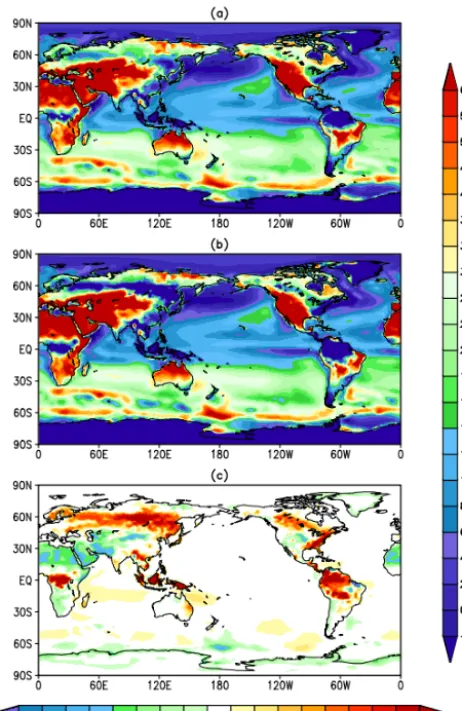
The implementation of the resolution-aware behavior of the moist processes in the MERRA2 version of the GEOS-5 AGCM was designed in part to improve the behavior of the high-resolution simulations and to ensure more unifor-mity of model mean state across resolutions and applications. Figure 16 shows an example of the undesirable behavior in the MERRA version of the AGCM that the resolution-aware parameters were meant to address. Figure 16a–c shows the difference between MERRA AGCM and ERA-Interim spe-cific humidity at 2., 1. and 0.5◦resolution, indicating the
in-crease of the error in atmospheric moisture content relative to ERA-Interim reanalysis (Dee et al., 2011) as the resolu-tion increases.
Studies with many AGCMs used for climate and weather applications have reported large changes in the model so-lution as the horizontal resoso-lution increases. For example, Williamson (2008) showed sensitivity of aqua-planet simula-tions to both resolution and time step, Roecker et al. (2006) reported on lack of convergence toward a single solution as the horizontal and vertical resolution changed even though the higher-resolution simulations showed improvements rel-ative to the coarse resolution result, and Bacmeister et al. (2014) showed a spurious precipitation pattern when the AGCM resolution was increased to 0.25◦.
In order to mitigate the change (increasing error) in the GEOS-5 AGCM simulated climate with increasing
resolu-tion, the MERRA2 AGCM moist physics was modified to in-clude two governing parameters that are specified a priori as a function of horizontal resolution. These are the RHcritused for large-scale condensation, and a parameter which governs the minimum allowable entrainment used for the stochastic Tokioka trigger of the convective parameterization.
The dependence of RHcriton horizontal resolution is based on the Molod (2012) analysis of a global mesoscale simula-tion, and is such that the RHcritabove the planetary boundary layer (PBL) increases with finer resolution, as is seen in the progression from the 2◦ resolution curve up to the 0.125◦ curve in Fig. 7. This progression is consistent with an intu-itive expectation that the variability of total water within an AGCM grid cell decreases as the grid cell becomes smaller. The implementation of the horizontal resolution dependence of RHcrit (as described in Sect. 2) in the MERRA2 AGCM resulted in an atmospheric moisture field that is more consis-tent across different resolutions, as seen in Fig. 16d–f.
ob-1352 A. Molod et al.: Development of the GEOS-5 atmospheric general circulation model
Figure 16. December-January-February seasonal mean difference of specific humidity in g kg−1for (a) MERRA-like AGCM – ERA-Interim at 2-degree resolution, (b) MERRA-like AGCM – ERA-Interim at 1-degree resolution, (c) MERRA-like AGCM – ERA-Interim at 1/2-degree resolution, (d) MERRA2-like AGCM – ERA-Interim at 2-degree resolution, (e) MERRA2-like AGCM – ERA-Interim at 1-degree resolution, (f) MERRA2-like AGCM – ERA-Interim at 1/2-degree resolution.
Figure 17. The PDF for the minimum entrainment allowed by the cumulus parameterization for different AGCM horizontal resolu-tions. Black line is for 2×2.5 degrees, blue for 1 degree, red for 1/2 degree and green for 1/4 degree.
servational relationship can be approximated by sampling the minimum entrainment from a power law PDF. The pa-rameters of the PDF are specified a priori in the MERRA2 AGCM, and vary with resolution. The stochasticity is de-signed to only occasionally permit the least entraining and therefore the deepest detraining cloud plumes. The resolu-tion dependence of the stochastic Tokioka trigger is such that it more severely limits the parameterized convective mass flux at high spatial resolution, where we expect the larger scale convective updrafts to be resolved explicitly, and has little impact at low resolution. This approach enables a rela-tively smooth transition from a fully parameterized cumulus convection at coarse resolution to a fully resolved cumulus convection at extremely high resolution. The ad hoc speci-fied change with resolution of the PDF parameters is shown in Fig. 17.
parameteri-Figure 18. June-July-August seasonal mean cumulus mass flux in kg m−2day−1from MERRA2-like AGCM for (a) 1-degree resolution, (b) 1/2-degree resolution, (c) 1/4-degree resolution, (d) 10 km resolution.
zation so that it converges to an explicit simulation of convec-tion at high resoluconvec-tion. Another approach to implementing resolution-aware behavior in an AGCM cumulus parameteri-zation is that of Bechtold et al. (2008), implemented in the In-tegrated Forecast System Model Cycle 40r1 of the European Center for Medium Range Weather Forecasting (documenta-tion available at http://old.ecmwf.int/research/ifsdocs/). They compute a cumulus timescale that is sampled from a PDF whose parameters change with resolution, such that at high resolution the probability of finding a short timescale is in-creased. The net result is that the relative contribution of convective and resolved precipitation is relatively unchanged across resolutions, but this scheme does not converge to al-low a total dependance on explicitly resolved convection at the highest resolutions.
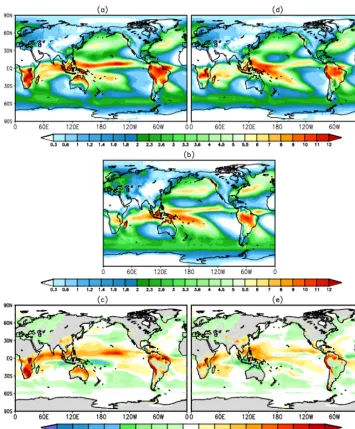
Figure 18 shows a sequence of the June-averaged convec-tive mass fluxes from MERRA2 AGCM simulations with dif-ferent horizontal resolutions. The decrease of parameterized mass flux with resolution reflects the increasingly restrictive trigger, selected from the PDFs with increasingly higher min-imum entrainment values shown in Fig. 17. The effect of this repressed RAS mass flux on the simulated climate is reflected in the total change in moisture due to moist processes, shown in Fig. 19. The cloud model in RAS includes a grid-scale
sub-sidence to compensate for the updraft mass flux that results in a drying of the sub-cloud layer. Figure 19 shows the decrease of the low level drying with increased horizontal resolution. The benefits of the reduced low level drying and the related maintenance of the cumulus available potential energy dur-ing tropical storm development in the GEOS-5 AGCM sim-ulations at high resolution was demonstrated in the study of Lim et al. (2014).
5 Synthesis and discussion
The version of the GEOS-5 AGCM used in the Goddard Modeling and Assimilation Office (GMAO) MERRA2 re-analysis was developed for use across many different reso-lutions and applications. A unique series of AGCM simu-lations were performed with the GEOS-5 AGCM to detail the impact of each change in parameterization between the MERRA version and the current MERRA2 version. The se-ries of sensitivity experiments began with the current AGCM version and regressed, one step of development at a time, to the MERRA AGCM.
precipita-1354 A. Molod et al.: Development of the GEOS-5 atmospheric general circulation model
Figure 19. June-July-August seasonal mean change in moisture due to moist processes in kg m−2day−1from MERRA2-like AGCM for (a) 1-degree resolution, (b) 1/2-degree resolution, (c) 1/4-degree resolution.
tion in the MERRA2 AGCM. The resulting atmosphere had a higher moisture content, and many aspects of the boreal win-ter climate were substantially improved relative to reanalysis. The moisture and cloud cover amounts were shown to be fur-ther improved by the implementation of an AIRS-based PDF of total water.
The development of the MERRA2 AGCM also included the implementation of a set of parameters governing moist processes that contain an a priori change in behavior with horizontal resolution. The parameters are ones which govern the minimum allowable entrainment into a convective up-draft, and govern the atmospheric RH needed for the onset of condensation. Results of a limited set of experiments were
shown to demonstrate the benefits of this resolution-aware behavior at higher resolution.
This study was focused on the results of atmosphere-only simulations, but the resulting model has also performed well in coupled atmosphere–ocean, coupled atmosphere– chemistry, data assimilation, numerical weather prediction, and global mesoscale applications.
Code availability
The GEOS-5 source code is available under the NASA Open-Source Agreement at http://opensource.gsfc.nasa.gov/ projects/GEOS-5/.
Acknowledgements. The GEOS-5 AGCM development in the Global Modeling and Assimilation Office is funded by NASA’s Modeling, Analysis and Prediction (MAP) program under WBS 802678.02.17.01.211 and 802678.02.17.01.25. The authors grate-fully acknowledge the support of David Considine, the MAP project manager. We appreciate the contribution of the many others in the GMAO who participated in various key ways to the development of the GEOS-5 AGCM. The analysis of GEOS-5 AGCM simulations at many spatial and temporal scales was performed by Siegfried Schubert, Yehui Chang, and Myong-In Lee, and the analysis of the GCM performance in data assimilation and numerical weather prediction modes was performed by Stephen Bloom, Gary Partyka, and Austin Conaty. The feedback from William Putman about the performance of the AGCM at very high horizontal resolution was critical in the ability to run the GEOS-5 AGCM seamlessly across a wide range of resolutions, and the analysis of the transport of tracers done by Lesley Ott aided in the understanding of model errors. In addition, the feedback to AGCM development from GMAO scientists involved in the development of the other component models of the GEOS-5 GCM, including Yury Vikhaelev, Bin Zhao, J. Eric Nielsen, Ar-lindo da Silva, Randal Koster, Rolf Reichle, and Sarith Mahanama, was invaluable. In addition, the efforts of Peter Norris in the development and testing of the satellite simulator component of the GCM are appreciated. The authors also gratefully acknowledge the contributions of Atanas Tryanov, Matt Thompson, and Ben Auer to the AGCM infrastructure that made the AGCM tractable and portable to different platforms. All of these contributions made the simulations possible. The simulations were performed at the NASA Center for Climate Simulation (NCCS) at Goddard Space Flight Center and at the NASA Advanced Supercomputing (NAS) Division at Ames Research Center. The authors gratefully acknowledge the support of personnel at both of those computing centers. Finally, author A. Molod prepared the manuscript at two GAIN writing retreats, sponsored by NSF grant number 0620087.
References
Alexander, M. J. and Teitelbaum, H.: Observation and anal-ysis of a large amplitude mountain wave event over the Antarctic peninsula, J. Geophys. Res., 112, D21103, doi:10.1029/2006JD008368, 2007.
Alexander, M. J., Eckermann, S. D., Broutmann, D., and Ma, J.: Momentum flux estimates for South Georgia Island mountain waves in the stratosphere observed via satellite, Geophys. Res. Lett., 36, L12816, doi:10.1029/2009GL038587, 2009.
Arakawa, A. and Wu, C.-M.: A Unified Representation of Deep Moist Convection in Numerical Modeling of the Atmosphere, Part I, J. Atmos. Sci., 70, 1977–1992, doi:10.1175/JAS-D-12-0330.1, 2013.
Bacmeister, J. T. and Stephens, G.: Spatial statistics of likely con-vective clouds in CloudSat data, J. Geophys. Res., 116, D04104, doi:10.1029/2010JD014444, 2011.
Bacmeister, J. T., Suarez, M. J., and Robertson, F. R.: Rain reevapo-ration, boundary layer-convection interactions, and Pacific rain-fall patterns in a AGCM, J. Atmos. Sci., 63, 3383–3403, 2006. Bacmeister, J. T., Wehner, M. F., Neale, R. B., Gettelman, A.,
Han-nay, C., Lauritzen, P. H., Caron, J. M., and Truesdale, J. E.: Exploratory high-resolution climate simulations using the Com-munity Atmosphere Model (CAM), J. Climate, 27, 3073–3099, 2014.
Bechtold, P., Köhler, M., Jung, T., Doblas-Reyes, F., Leutbecher, M., Rodwell, M. J., Vitart, F., and Balsamo, G.: Advances in sim-ulating atmospheric variability with the ECMWF model: From synoptic to decadal time scales, Q. J. Roy. Meteor. Soc., 134, 1337–1351, doi:10.1002/qj.289, 2008.
Chou, M.-D. and Suarez, M. J.: An efficient thermal infrared ra-diation parameterization for use in general circulation models. NASA Tech. Memorandum 104606 – Vol. 3, NASA, Goddard Space Flight Center, Greenbelt, MD, 1994.
Chou, M.-D. and Suarez, M. J.: A Solar Radiation Parameterization for Atmospheric Studies. NASA Tech. Memorandum 104606 – Vol. 15, NASA, Goddard Space Flight Center, Greenbelt, MD, 1999.
Cullather, R. L., Nowicki, S. M. J., Zhao, B., and Suarez, M. J.: Evaluation of the surface representation of the Greenland ice sheet in a general circulation model, J. Climate, 27, 4835–4856, doi:10.1175/JCLI-D-13-00635.1, 2014.
Dee, D. P., Uppala, S. M., Simmons, A. J., et al.: The ERA-Interim reanalysis: configuration and performance of the data assimila-tion system, Q. J. R. Meteor. Soc., 137, 553–597, 2011. Donner, L. J., Wyman, B. L., Hemler, R. S., et al.: The
Dy-namical Core, Physical Parameterizations, and Basic Simula-tion Characteristics of the Atmospheric Component AM3 of the GFDL Global Coupled Model CM3, J. Climate, 24, 3484, doi:10.1175/2011JCLI3955.1, 2011.
Duynkerke, P. and de Roode, S.: Surface energy balance and turbulence characteristics observed at the SHEBA Ice Camp during FIRE III, J. Geophys. Res., 106, 15313–15322, doi:10.1029/2000JD900537, 2001.
Garcia, R. R. and Boville, B. A.: Downward control of the mean meridional circulation and temperature distribution of the polar winter stratosphere, J. Atmos. Sci., 51, 2238–2245, 1994. Garfinkel, C. I., Molod, A., Oman, L. D., and Song, I.-S.:
Im-provement of the GEOS-5 AGCM upon Updating the Air-Sea
Roughness Parameterization, Geophys. Res. Lett., 38, L18702, doi:10.1029/2011GL048802, 2011.
Gettelman, A., Morrison, H., Santos, S., Bogenschutz, P., and Caldwell, P. M.: Advanced Two-Moment Bulk Micro-physics for Global Models. Part II: Global Model Solutions and Aerosol-Cloud Interactions, J. Climate, 28, 1288–1307, doi:10.1175/JCLI-D-14-00103.1, 2015.
Helfand, H. M. and Schubert, S. D.: Climatology of the Simulated Great Plains Low-Level Jet and Its contribution to the Continen-tal Moisture Budget of the United States, J. Climate, 8, 784–806, 1995.
Huffman, G., Adler, R. F., Rudolf, B., Schneider, U., and Keehn, P. R.: Global precipitation estimates based on a technique for com-bining satellite-based estimates, rain gauge analysis, and NWP model precipitation information, J. Climate, 8, 1284–1295, 1995. Kondo, J.: Air-sea bulk transfer coefficients in diabatic conditions,
Bound.-Lay. Meteorol., 9, 91–112, 1975.
Koster, R. D., Suarez, M. J., Ducharne, A., Stieglitz, M., and Ku-mar, P.: A catchment-based approach to modeling land surface processes in a GCM, Part 1, Model structure, J. Geophys. Res., 105, 24809–24822, 2000.
Large, W. G. and Pond, S.: Open ocean momentum flux measure-ments in moderate to strong winds, J. Phys. Oceanogr., 11, 324– 336, 1981.
Lim, Y.-K., Schubert, S. D., Reale, O., Lee, M.-I., Molod, A., and Suarez, M. J.: Sensitivity of Tropical Cyclones to Parameterized 2 Convection in the NASA GEOS5 Model, J. Climate, 28, 551– 573, doi:10.1175/JCLI-D-14-00104.1, 2015.
Lock, A. P., Brown, A. R., Bush, M. R., Martin, G. M., and Smith, R. N. B.: A new boundary layer mixing scheme. Part I: Scheme description and single-column model tests, Mon. Weather Rev., 138, 3187–3199, 2000.
Louis, J. F.: A Parametric Model of Vertical Eddy Fluxes in the Atmosphere, Bound.-Lay. Meteorol., 17, 187–202, 1979. Louis, J. F. and Geleyn, J.: A short history of the PBL
parame-terization at ECMWF. Proc. ECMWF Workshop on Planetary Boundary Layer Parameterization, Reading, United Kingdom, ECMWF, 59–80, 1982.
Manzini, E., McFarlane, N. A., and McLandress, C.: Impact of the Doppler spread parameterization on the simulation of the middle atmosphere circulation using the MA/ECHAM4 gen-eral circulation model, J. Geophys. Res., 102, 25751–25762, doi:10.1029/97JD01096, 1997.
McFarlane, N. A.: The effect of orographically excited gravity-wave drag on the circulation of the lower stratosphere and troposphere, J. Atmos. Sci., 44, 1775–1800, 1987.
Molod, A.: Constraints on the Profiles of Total Water PDF in AGCMs from AIRS and a High-Resolution Model, J. Climate, 25, 8341–8352, 2012.
Molod, A., Takacs, L. L., Suarez, M. J., Bacmeister, J. T., Song, I.-S., and Eichmann, A.: The GEOS-5 Atmospheric General Circu-lation Model: Mean Climate and Development from MERRA to Fortuna. NASA Tech. Memo. 104606, Vol. 28, Tech. Rep. Series on Global Modeling and Data Assimilation, edited by: Suarez, M. J., 117 pp., 2012.
1356 A. Molod et al.: Development of the GEOS-5 atmospheric general circulation model
Moorthi, S. and Suarez, M. J.: Relaxed Arakawa Schubert: A pa-rameterization of moist convection for general circulation mod-els, Mon. Weather Rev., 120, 978–1002, 1992.
Neale, R. B., Richter, J., Park, S., Lauritzen, P. H., Vavrus, S. J., Rasch, P. J., and Zhang, M.: The Mean Climate of the Commu-nity Atmosphere Model (CAM4) in Forced SST and Fully Cou-pled Experiments, J. Climate, 26, 5150–5168, doi:10.1175/JCLI-D-12-00236.1, 2013.
Pope, V. D., Gallani, M. L., Rowntree, P. R., and Stratton, R. A.: The impact of new physical parametrizations in the Hadley Centre climate model – HadAM3, Clim. Dynam., 16, 123–146, doi:10.1007/s003820050009, 2000.
Putman, W. and Lin, S.-J.: Finite Volume Transport on Var-ious Cubed Sphere Grids. J. Comput. Phys., 227, 55–78. doi:10.1016/j.jcp.2007.07.022, 2007.
Reynolds, R. W., Rayner, N. A., Smith, T. M., Stokes, D. C., and Wang, W.: An improved in situ and satellite SST analysis for climate, J. Climate, 15, 1609–1625, 2002.
Richter, J. H., Sassi, F., and Garcia, R. R.: Toward a phys-ically based gravity wave source parameterization in a general circulation model, J. Atmos. Sci., 67, 136–156, doi:10.1175/2009JAS3112.1, 2010.
Rienecker, M. M., Suarez, M. J., Todling, R., Bacmeister, J., Takacs, L., Liu, H.-C., Gu, W., Sienkiewicz, M., Koster, R. D., Gelaro, R., Stajner, I., and Nielsen, J. E.: The GEOS-5 Data Assimilation System-Documentation of versions 5.0.1 and 5.1.0, and 5.2.0. NASA Tech. Rep. Series on Global Modeling and Data Assimi-lation, NASA/TM-2008-104606, Vol. 27, 92 pp., 2008. Rienecker, M. M., Suarez, M. J., Gelaro, R., et al.: MERRA:
NASA’s Modern-Era Retrospective Analysis for Research and Applications, J. Climate, 24, 3624–3648, 2011.
Roeckner, E., Brokopf, R., Esch, M., Giorgetta, M., Hagemann, S., Kornblueh, L., Manzini, E., Schlese, U., and Schulzweida, U.: Sensitivity of Simulated Climate to Horizontal and Vertical Resolution in the ECHAM5 Atmosphere Model, J. Climate, 19, 3771–3791, doi:10.1175/JCLI3824.1, 2006.
Scaife, A. A., Butchart, N., Warner, C. D. and Swinbank, R.: Impact of a spectral gravity wave parameterization on the stratosphere in the Met Office Unified Model, J. Atmos. Sci., 59, 1473–1489, doi:10.1175/1520-0469(2002)059<1473:IOASGW>2.0.CO;2, 2002.
Shie, C.-L., Chiu, L. S., Adler, R., Nelkin, E., Lin, I.-I., Xie, P., Wang, F.-C., Chokngamwong, R., Olson, W., and Chu, D. A.: A Note on reviving the Goddard satellite-based surface turbulent fluxes (GSSTF) dataset, Adv. Atmos. Sci., 26, 1071–1080, 2009. Stieglitz, M., Ducharne, A., Koster, R. D., and Suarez, M. J.: The Impact of Detailed Snow Physics on the Simulation of Snow-cover and Subsurface Thermodynamics at Continental Scales, J. Hydromet., 2, 228–242, 2001.
Takacs, L., Suarez, M. J., and Todling, R.: Maintaining Atmospheric Mass Balance within Reanalysis. NASA Tech. Memo. 104606, Vol. 34 Technical Report Series on Global Modeling and Data Assimilation, edited by: Koster, R., 2014.
Tokioka, T., Yamazaki, K., Kitoh, A., and Ose, T.: The equato-rial 30–60 day oscillation and the Arakawa Schubert penetrative cumulus parameterization, J. Meteorol. Soc. Jpn., 66, 883–901, 1988.