R E S E A R C H
Open Access
The interaction between stock prices and
interest rates in Turkey: empirical evidence
from ARDL bounds test cointegration
Turgut Tursoy
Correspondence:turgut.tursoy@neu. edu.tr
Department of Banking and Finance, Near East University, Nicosia, 99138, North Cyprus, 10 Mersin, Turkey
Abstract
This paper demonstrates a significant, long-running relationship between stock prices and domestic interest rates in Turkey’s financial markets for the period of 2001 M1–2017 M4. Cointegration analysis is investigated using the autoregressive-distributed lag bounds (ARDL Bounds) test and vector autoregressive cointegration. Additionally, cointegrating equations such as the fully modified ordinary least square, dynamic ordinary least squares, and canonical cointegrating regression are applied to check the long-run elasticities in the concerned relationship. The ARDL Bounds and Johansen Cointegration test results show that, dynamically, both prices are
significantly related to each other. The cointegrating equation outcomes
demonstrate elasticities whereby both coefficients have negative signs. Additionally, the same results are corroborated by the impulse response where all variables respond negatively to each other.
Keywords:Stock price, Interest rates, Cointegration, ARDL, VAR
Jel classifications:G11, G12, C22
Introduction
Based on the theoretical model proposed by Chen, Roll and Ross (Chen et al.,1986), stock price estimates by the expected cash flow are discounted by the interest rate. During the discounting process, the interest rates directly affect the value of the stock.
Huang et al. (Huang et al., 2016) specify that a low level of interest rates makes the discounting cash flow high, thus justifying the increase in current stock prices. Based on the stock valuation models, stock prices are predicted by the discounted value of expected cash flow. Therefore, according to the theory, the primary factor determining the value of stocks is directly related to the discounting rate, namely interest rates.
Laopodis (Laopodis, 2013) explains that expected dividends determine stock prices and interest rates with any surprises in monetary policy likely to influence stock prices, either directly via the interest rate channel or indirectly through changes in the deter-minants of dividends.
According to Bernanke and Reinhart (Bernanke & Reinhart, 2004), current interest rates can influence asset prices. Moreover, Assefa et al. (Assefa et al., 2017) find that interest rates have significant effects on stock returns in developed economies.
Theoretically, financial markets are classified as capital and money markets, respect-ively. Today, it is important in both markets for participants to follow market move-ments before making investment decisions. All types of prices provide essential information for investors to revise their portfolios. There are many kinds of prices, in-cluding stock prices and interest rates. According to the explanation above, empirical evidence supports the view that there is a significant relationship between stock prices and interest rates.
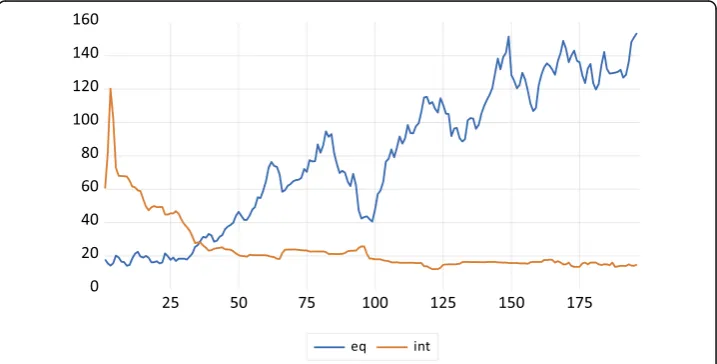
Figure 1 shows the interest rates and stock price levels for the period 2001 M1 – 2017 M4. The graphical investigation presents evidence indicating that when interest rates dropped from 120% to under 20%, the stock market indexes increased substan-tially. After the 2001 crisis in Turkey, the monetary authority pursued an inflation tar-geting program to decrease the inflation rate. Following the monetary changes, interest rates fell substantially and remained under 20%. Additionally, the stock market responded with a substantial increase during the same period.
Assefa et al. (Assefa et al., 2017) explain that monetary policy, through interest rates, tends to affect the returns–and hence prices–of financial assets, thereby influencing economic decisions and growth. Sellin (Sellin,2001) also surveys the literature on mon-etary policy and stock prices. For Turkey, Alrub et al. (Alrub et al.,2016) provide sup-port by illustrating the outcomes of monetary policy changes in the stock market for the period of January 2002 to December 2013.
There are two main reasons for revisiting the relationship between the equity market and interest rates. First, a significant volume of literature developed by Chen, Roll and Ross (Chen et al.,1986), Campbell and Ammer (Campbell & Ammer,1993), Thorbecke (Thorbecke, 1997), Laopodis (Laopodis, 2013), Huang et al. (Huang et al., 2016), and Assefa et al. (Assefa et al., 2017) focuses on the effects of macro-variables on stock prices.
Second, in general, Turkey is classified as a bank-based financial system, but also has a stock exchange that is integrated into the global financial market. Market participants usually prefer deposit accounts to safeguard their wealth. They also have the option to invest in the stock market, but foreigners usually place their wealth in the Borsa
Istanbul as a portfolio investment. Foreigners make approximately three quarters of the in-vestments in the stock market, while domestic residents prefer bank accounts. Therefore, this study uses the indicator of deposit interest rates as the proxy for interest rate components.
Moreover, it is favorable to use the equity price index for the component of the stock market. The interaction between both components is investigated based on the dynam-ics between them. Consequently, the objective of this study is to examine the relation-ship between both prices by applying the ARDL Bounds Test, cointegration equations, and equity capital market (ECM) for Turkey in order to substantiate evidence for this relationship. Specifically, a bivariate form of cointegration is applied to analyze the rela-tionship between the two variables. The primary purpose of this study is to identify the short-run and long-run relationships, as well as the elasticities of the relationship in Turkey. Therefore, this study investigates if in the case of Turkey, both the stock prices and interest rates have a long-run relationship by using the ARDL Bounds Test.
Furthermore, the elasticities of the concerned relationship produced by the cointegration equations (FMOLS, DOLS, and CCR) provide the signs of each coefficient in the possible relationship. The vast majority of studies in the literature provide the signs for coefficients in this relationship. Also, the cointegration results from the ARDL Bounds Test and the long-run elasticities are corroborated with the Johansen cointegration methods.
The rest of the article is organized as follows:
Section 2 explains the literature review.
Section 3 describes the data, model specification, and econometric methodology. Section 4 provides the empirical results and discussion, and.
Section 5 explains the conclusion.
Literature review
Stock prices are widely investigated by scholars such as Gordon (Gordon,1959), Blan-chard (BlanBlan-chard, 1981), Campbell and Shiller (Campbell & Shiller, 1988), and Lee (Lee, 1992). Stock prices are connected to earnings and macroeconomic variables such as output and inflation dividends.
Furthermore, Chen, Roll and Ross (Chen et al.,1986) propose macroeconomic variables that are linked with the stock market under the framework of arbitrage pricing theory (APT). Nasseh and Strauss’(Nasseh & Strauss,2000) findings support the existence of a significant, long-run relationship between stock prices and domestic and international economic activities in six European economies. Specifically, they find a relationship be-tween stock prices and interest rates. Asprem (Asprem,1989) testifies to the inverse rela-tionship between stock indices and interest rates in 10 European countries.
Therefore, the relationship between stock prices and interest rates is widely studied, and important investigations prove the negative relationship between both concerned variables. Finally, Flannery and James (Flannery & James, 1984) examine the relation-ship between the interest rate sensitivity of common stock returns and the maturity composition of a firm’s nominal contracts. This paper finds that common stock returns are correlated with interest rate changes.
They argue that according to financial theory, it is possible that interest rates have a substantial effect on the behavior of financial aggregates, such as stock prices.
The findings of Arpegis and Eleftheriou (Apergis & Eleftheriou, 2002) demonstrate that an increase in interest rates motivates investors to change their portfolio compos-ition to hold bonds in their portfolio. On the contrary, when interest rates fall, investors choose stocks instead of bonds.
Modigliani and Cohn (Modigliani & Cohn,1979) propose that during inflationary pe-riods, investors capitalize equity earnings at a rate that parallels nominal interest rates, revealing the behavior of the investors, who continuously compare the prices of both markets (stock and interest rate markets) in order to revise their portfolios.
Also, Jebran et al. (Jebran et al.,2017) investigate the effect of oil price and its volatility on the stock market in Pakistan. There are also studies that investigate the factors affect-ing the bitcoin’s price such as Zhu et al. (Zhu et al.,2017). Moreover, Panda and Nanda (Panda & Nanda, 2017) determine the short-run and long-run interconnectedness of stock returns in Western Europa and the global market via cointegration method.
Previous studies such as Tursoy et al. (2008) and Rjoub et al. (2009), in Turkey present empirical evidence on stock market and the interactions between macroeco-nomic variables. These studies predominately scrutinize the stock market and macro-economic variable interactions within the country.
Tursoy and Faisal (Tursoy & Faisal, 2018) determine the relationship between stock prices, crude oil, and gold prices in Turkey. Likewise, Granger et al. (Granger et al.,2000) explore the link between two variables in the bivariate form by looking at stock prices and another variable.
For instance, Tursoy (Türsoy,2017) investigates the relationship between stock prices and exchange rates in the bivariate form. This study examines the causal relationship between two important theories (traditional/portfolio) in Turkey. Another study conducted by Tursoy and Faisal (Tursoy & Faisal, 2016) evaluates the interaction between stock prices and economic growth in Turkey with the bivariate form. Also, Tursoy and Faisal (Tursoy & Faisal, 2017) study the interconnectedness of Turkey with the global market in the bivariate form.
Data and methods
Analysis of the bivariate form of the relationship explores the relationship between two important market indicators. All necessary data is obtained from the International Fi-nancial Statistics (IFS) database for the period of January 2001 to April 2017.
Model specifications
The chief relationship in this study is examined using the following equations. The vari-ables in the bivariate form of the relationship are represented by the stock prices (equity price index–LEQ) and interest rates (deposit interest rates–LINT). The following Eqs. (1) and (2) show the bivariate relationship between stock prices and interest rates:
lnEQt ¼β0þβlnINTtþεt ð1Þ
lnINTt ¼β0þβlnEQtþεt ð2Þ
represents the natural logarithm of the variables, and the beta coefficients depict the long-run elasticities.εtrepresents the white noise error term of the equations.
Methods
The empirical analysis in a time series usually begins with an investigation of the vari-ables’ order of integration by applying the unit root tests. This study uses the Perron (Perron,1989) breakpoint unit root test method to determine the order of integration.
Based on Tursoy and Faisal (Tursoy & Faisal, 2018), the conventional unit root test cannot identify evidence of the structural break. Also, Türsoy and Faisal (Türsoy & Fai-sal, 2018) using conventional and breakpoint unit root tests to determine the correct order of integration. Perron (Perron, 1989) proposes the breakpoint unit root test to allow for the break in the unit root test. Perron (Perron,1989) states that breakpoints and unit roots are related, and conventional unit root tests are biased when determin-ing the correct order of integration. In this unit root test, there are two forms: the addi-tive outlier (AO) model and the innovaaddi-tive outlier (IO) model, which observe the immediate and gradual shocks, respectively (Türsoy,2017).
This study analyses the long-run and short-run dynamics using the ARDL Bounds Test, developed by Pesaran et al. (Pesaran et al.,2001). The standard log-log functional specifi-cation represents the cointegration between stock prices and interest rates, as follows:
Δ ln EQt¼β0þ
Xn1
i¼1
β1iΔlnEQt−iþ
Xn2
i¼1
β2iΔlnINTt−iþλ1 ln EQt−1þλ2 ln INTt−1þυ1t; ð Þ3
Δ ln INTt¼β0þ
Xn1
i¼1
β1iΔlnINTt−iþ
Xn2
i¼1
β2iΔlnEQt−iþλ1 ln INTt−1þλ2 ln EQt−1þυ2t; ð Þ4
WhereΔis the first different operator, andυ1 t andυ2 t are the error terms. The error terms should be white noise. The Akaike Information Criterion (AIC) is used to select the lag length selection, and in the ARDL model, the null hypothesis of no cointegra-tion between two variables is examined via the F-statistic.
The estimated F-statistic is usually compared with the two critical values (upper--bound and lower-(upper--bound). Theoretically, the null hypothesis of no cointegration is rejected by the condition of the F-statistic being higher than the critical values. If the estimated statistic lies between the two bounds, the decision is rendered inconclusive. Lastly, if the estimated statistic is below both bounds, the null hypothesis of no cointe-gration is accepted, and it concludes that there is no cointecointe-gration.
Specifically, by the estimation, it is understood that the F-statistic should be higher than the upper-bound critical values in order to find the cointegration between the concerned variables. In the ARDL framework, a mixed order of integration among the regressors is admissible for estimating the necessary statistic to determine the cointegration.
Δ lnEQt¼γ0þ Xp1
j¼1
γ1iΔlnEQt−iþ Xp2
j¼1
γ2iΔlnINTt−iþ þψECTt−1þϑt; ð Þ5
ΔlnINTt¼γ0þ
Xp1
j¼1
γ1iΔlnINTt−iþ Xp2
j¼1
γ2iΔlnEQt−iþ þψECTt−1þϑt; ð Þ6
In Eqs. 5 and 6, the error term, which represents the speed of adjustment to converge back to the long-run equilibrium, is ECTt−1. This term should be negative and also needs to be between 0 and 1. Likewise, the long-run elasticities among the predeter-mined, cointegrated variables are analyzed via the single vectors with fully modified OLS (FMOLS) as proposed by Philips and Hansen (Phillips & Hansen, 1990), the dy-namic OLS (DOLS) technique as suggested by Stock and Watson (Stock & Watson,
1993), and the Canonical Cointegrating Regression (CCR).
The single cointegrating equations are applied to the unique order of series to pro-vide epro-vidence of a long-run relationship. The robustness of the findings in the ARDL cointegration is supported by the FMOLS, DOLS, and CCR to estimate the long-run elasticities for the concerned relationship for the two variables. Moreover, the cointe-gration between stock prices and interest rates are examined again through the Vector Autoregressive Model (VAR), which was proposed by Johansen (Johansen,1991; Johan-sen, 1995) in order to scrutinize the relationship between the variables. Also, the short-run innovation accounting techniques (impulse response and variance decompos-ition) are applied to investigate the short-run shock between them.
Empirical results
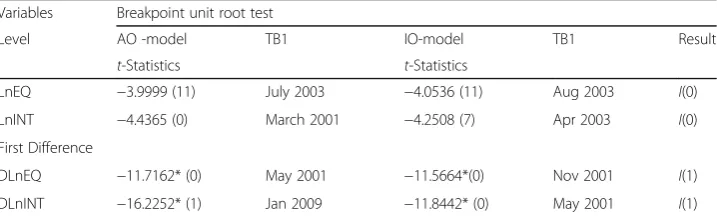
As explained in the prior section, the first stage determines the order of integration of the series. In this study, the Perron (Perron,1989) breakpoint unit root test is employed to estimate the stationarity of the variables. Table1represents the outcomes of the unit root test with a structural break in the variables.
The Perron (Perron, 1989) unit root test allows one break point. This method has two models: an AO and an IO. Both models’ results are reported in the above table, and both variables are non- stationary at level and stationary at first difference. As a re-sult, the variables have the same order of integration, which is I(1).
After the first estimation determining the order of integration of the variables, it is possible to proceed to the cointegration analysis in both the ARDL Bounds and VAR frameworks.
Table 1Perron (Perron,1989) Test with one endogenous structural break Variables Breakpoint unit root test
Level AO -model TB1 IO-model TB1 Result
t-Statistics t-Statistics
LnEQ −3.9999 (11) July 2003 −4.0536 (11) Aug 2003 I(0)
LnINT −4.4365 (0) March 2001 −4.2508 (7) Apr 2003 I(0)
First Difference
DLnEQ −11.7162* (0) May 2001 −11.5664*(0) Nov 2001 I(1)
DLnINT −16.2252* (1) Jan 2009 −11.8442* (0) May 2001 I(1)
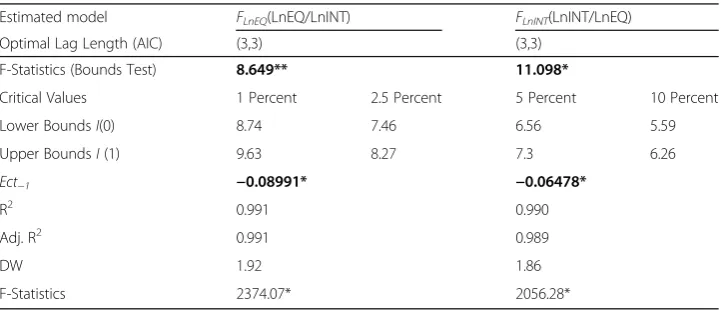
For the ARDL Bounds, Eq. 3 and Eq. 4 can be applied to explore the cointegration between the two variables. Table 2 reports the estimated F-statistic for both equations. The second row provides evidence that both models are cointegrated and a long-run relationship exists between the two variables.
For example, the estimated F-statistic for the model of FlnEQ(LnEQ/LnINT) is 8.649,
and above the upper bound critical values for 5%. According to the second model of FlnEQ(LnINT/LnEQ), the estimated statistic is 11.098 and lies above the upper
bound-ary critical values at 1%. Estimation of the short-run dynamics is shown in the same table.
The models for Eq. 5 and Eq. 6 are included with the error correction terms. These coefficients represent the speed of adjustment of the short-term disequilibrium to the long-term equilibrium. The results of the error correction terms are also presented in Table 2. In Model 1, the speed of adjustment is close to 9%, whereas for the second, it is approximately 7%. Both coefficients are significant at 1% and negative, which pro-vides data for the short-run dynamics. With these coefficients, it is evident that both variables affect each other. This implies that each variable converges to its long-run equilibrium, with its speed of adjustment in one period, by channeling with the other variable.
After evidence is provided for cointegrating vectors among the variables for both models, the next step is to estimate the long-run elasticities with the FMOLS, DOLS, and CCR cointegration equations. These cointegration equation results are reported in Tables3and4for the variables, which are I(1).
The cointegration equations are applied to the variables, which are nonstationary at level and stationary at first difference. The long-run elasticities are estimated differently by Panel A (Table3) and Panel B (Table4).
In Table 3, stock prices are used as the regress, and interest rates are used as the re-gressors. The findings show that a 1% increase in interest rates causes a decrease of 1.40% in stock prices, based on the FMOLS equations.
The results of DOLS and CCR provide the same evidence for a negative, significant impact on stock prices. All three methods provide approximately the same outcomes, which testify to the negative effect of interest rates on stock prices. In the matter of the
Table 2Results of the bounds test of cointegration and Ect−1term from short-run dynamics
Estimated model FLnEQ(LnEQ/LnINT) FLnINT(LnINT/LnEQ)
Optimal Lag Length (AIC) (3,3) (3,3)
F-Statistics (Bounds Test) 8.649** 11.098*
Critical Values 1 Percent 2.5 Percent 5 Percent 10 Percent
Lower BoundsI(0) 8.74 7.46 6.56 5.59
Upper BoundsI(1) 9.63 8.27 7.3 6.26
Ect−1 −0.08991* −0.06478*
R2 0.991 0.990
Adj. R2 0.991 0.989
DW 1.92 1.86
F-Statistics 2374.07* 2056.28*
initial theory, explained at the beginning of this paper, the adverse effect can be ob-served in Table3.
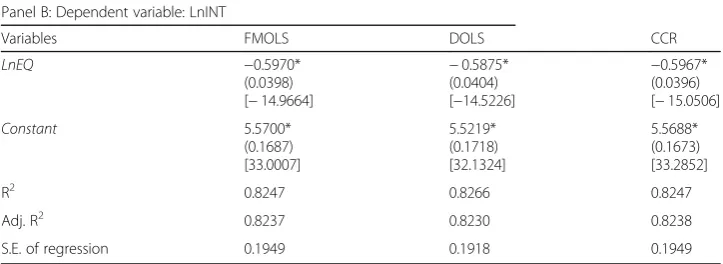
Similar to the above explanation, in the case where the interest rate is the regress and stock price is the regressor, a 1% increase in stock price will cause interest rates to fall by approximately 0.6%.
The negative and significant signs of both variables correlate to the findings of Huang et al. (Huang et al., 2016), which imply that the U.S. stock market responds negatively to interest rates. Furthermore, Assefa et al. (Assefa et al.,2017) find statistically signifi-cant, negative effects of interest rates on stock returns in developed countries. These negative effects on stock returns are consistent with the expected cash flow hypothesis.
Nasseh and Strauss (Nasseh & Strauss,2000) reveal a strong, integrating relationship between stock prices and domestic and international macro-economic variables in de-veloped countries. Specifically, long-term interest rates are shown to negatively influ-ence stock prices, which is consistent with their role as a discount factor.
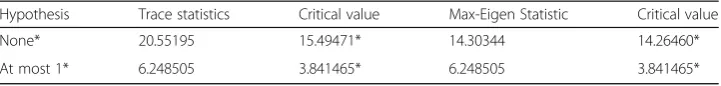
In the interest of checking the robustness of the above evidence, the Johansen Coin-tegration test is applied to verify the existing cointegrating equation. Like the ARDL and cointegrating equations, the Johansen cointegration results produce the same evi-dence for one cointegrating vector.
Table 5 represents the Trace and Max-Eigen statistics. The Johansen test outcomes demonstrate cointegration between the stock price and interest rates, which confirm Table 3Long-run elasticities for the dependent variable of stock price
Panel A: Dependent variable: LnEQ
Variables FMOLS DOLS CCR
LnINT −1.4019*
(0.0939) [−14.9147]
−1.4207* (0.1038) [−13.6857]
−1.4023* (0.0926) [−15.1362]
Constant 8.4931* (0.2917) [29.1086] 8.5368* (0.3172) [26.9074] 8.4944* (0.2883) [29.4619]
R2 0.8246 0.8373 0.8246
Adj. R2 0.8237 0.8339 0.8237
S.E. of regression 0.3003 0.2888 0.3003
Note:* represents the significance level at 1%. The value in the parentheses and square brackets are standard errors and T-statistics, respectively.FMOLSFully Modified Ordinary Least Squares,CCRCanonical Cointegration Regression,DOLS Dynamic Ordinary Least Squares
Table 4Long-run elasticities for the dependent variable of interest rate Panel B: Dependent variable: LnINT
Variables FMOLS DOLS CCR
LnEQ −0.5970*
(0.0398) [−14.9664]
−0.5875* (0.0404) [−14.5226]
−0.5967* (0.0396) [−15.0506]
Constant 5.5700* (0.1687) [33.0007] 5.5219* (0.1718) [32.1324] 5.5688* (0.1673) [33.2852]
R2 0.8247 0.8266 0.8247
Adj. R2 0.8237 0.8230 0.8238
S.E. of regression 0.1949 0.1918 0.1949
the results of the ARDL Bounds Test. The critical values for both statistics reject the null hypothesis of at most, one cointegrating vector at the 5% level.
Like FMOLS and others, the Johansen test records similar coefficients for the con-cerned relationship. The cointegration equations provide coefficients whose signs are negative for both variables. This data also corroborates the negative relationship be-tween the variables. Thus, both variables are moving in opposite directions. These find-ings support the view that investors are segmented in each market, which signifies that they either choose the stock market or the interest rate market.
Enders (Enders, 2004) explains that with economic data, it is not always clear that one variable is
dependent and that the others are independent. Using vector auto-regression is ap-propriate because
it treats all variables as jointly endogenous. Each variable can depend on its own past values and on the past values of all other variables in the system.
Enders (Enders, 2004) also states that, for each variable in the system, innovation ac-counting techniques (impulse response and variance decomposition) can be used to ascertain:
(i) the percentage of the forecast error variance attributable to each of the other vari-ables, and.
(ii) the impulse responses to the various innovations.
These techniques are applied to examine the relationship between stock prices and interest rates.
Figure 2 displays the impulse response of each variable to itself and to the others. The response of stock prices to the shocks from interest rates is significant at Period 7, and its shocks give a negative response from interest rates. For the case of interest rates, stock price shocks have an immediate effect on interest rates, which is significant and negative until Period 4. The negative shocks from stock prices to interest rates im-mediately occur and die at period 4. Both responses demonstrate that each variable shows a negative response to each other.
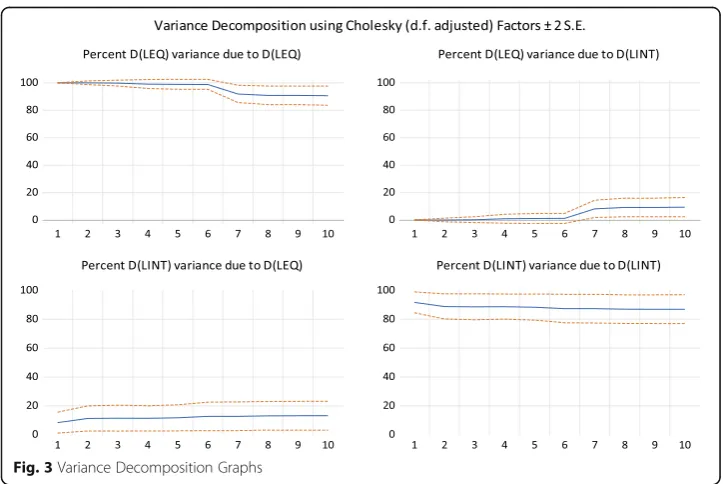
Although the impulse response function and variance decomposition offer similar in-formation, the variance decomposition illustrates another technique for examining VAR system dynamics.
The variance decomposition gives the proportion of the movements in dependent variables, which are the result of their own shocks and the other variables’shocks. The variance decomposition determines how much of the n-step-ahead forecast error vari-ance of a given variable is explained through innovations of each variable.
Figure3illustrates the variance decompositions of the stock prices and interest rates. As is immediately apparent, almost all forecast error variances of the stock price are ex-plained by their own innovation. The outcome is consistent with the result obtained Table 5Johansen cointegration test results
Hypothesis Trace statistics Critical value Max-Eigen Statistic Critical value
None* 20.55195 15.49471* 14.30344 14.26460*
At most 1* 6.248505 3.841465* 6.248505 3.841465*
Cointegration Equations: lnEQ =−4.01715*lnINT / lnINT =−0.24893*lnEQ
from the impulse response analysis, which reveals that its innovation produces a signifi-cant response of stock prices to the shock.
Nevertheless, after Period 7, the variance decomposition of stock price demonstrates that interest rate shocks account for approximately 9% of the forecast error variance of the stock price. Similarly, the variance decomposition of interest rates shows that the stock price shocks accounted for approximately 13% of the forecast error variance of the interest rates, and the remaining proportion is accounted for by its own innovation. The analytical interpretation concludes that stock price is responsible for movements in interest rates and vice versa. This conclusion verifies the findings obtained from the impulse response function.
Fig. 2Response to Cholesky One S.D. (d.f. adjusted) Innovations
Concluding remarks
The Central Bank normally establishes benchmark interest rates for market participants and institutions, thereby providing an indication for them to assist in determining their profits and losses.
After Turkey started to liberalize its financial markets, as well as other countries, they deregulated their interest rates to follow free market dynamics. Supply and demand de-termines the interest rates in markets, and all institutions are free to engage with their own interest rates. Therefore, like stock prices, which are determined by the market participants, interest rates also show the same co-movements and dynamics.
The purpose of this study is to explore the interaction between two prices (stock and interest rates) via the ARDL Bounds and VAR cointegration techniques, cointegration equations, and innovation accounting techniques. The study obtains monthly data from the IFS database, covering the period from January 2001 to April 2017. This empirical evidence indicates a significant and long-run relationship between stock price and interest rates. Specifically, interest rates have a negative effect on stock prices in Turkey, which is consistent with the expected cash flow hypothesis. At the same time, stock prices negatively impact interest rates. This is explained by the effect of monetary policy implications on the financial market due to the rate targeting program.
With this program, interest rates are reduced substantially, while stock market invest-ments increase significantly in Turkey’s financial markets. Based on the findings, in order to improve financial market investments in stock prices, it is necessary to change the interest rates. If authorities continue the inflation-targeting program in Turkey to reduce rates in the financial markets, this will likely improve investments in the stock market.
Abbreviations
AIC:Akaike information criterion; AO: Additive outlier; ARDL: Autoregressive distributed lag; CCR: Canonical cointegrating regression; DOLS: Dynamic ordinary least squared; ECM: Error correction model; ECT: Error correction term; FMOLS: Fully modified ordinary least squared; IFS: International financial statistics; IO: Innovative outlier; VAR: Vector autoregressive
Acknowledgements
I’m greatly thankful to the Editor and the anonymous referees for their most valuable suggestions that improved early version of the manuscript.
Funding
Not applicable.
Availability of the data and materials
The data for the variables of this study were collected from the International Financial Statistics (IFS).
Authors' contribution
The author read and approved the final manuscript.
Ethics approval and consent to participate
Author is approving the article for ethical issues and consent to participate to the article.
Consent for publication
I would be willing to give the permission to the Journal of Financial Innovation to publish my article.
Publisher’s Note
Received: 5 July 2018 Accepted: 18 January 2019
References
Alrub, A. A., Tursoy, T., & Rjoub, H. (2016). Exploring the long-run and short-run relationship between macroeconomic variables and Stock prices during the restructuring period: does it matter in Turkish market?. J Financial Studies & Research. g1–11
Apergis N, Eleftheriou S (2002) Interest rates, inflation, and stock prices: the case of the Athens Stock exchange. J Policy Model 24(3):231–236
Asprem M (1989) Stock prices, asset portfolios and macroeconomic variables in ten European countries. J Bank Financ 13(4– 5):589–612
Assefa TA, Esqueda OA, Mollick AV (2017) Stock returns and interest rates around the world: a panel data approach. J Econ Bus 89:20–35
Bernanke BS, Reinhart VR (2004) Conducting monetary policy at very low short-term interest rates. Am Econ Rev 94(2):85–90 Blanchard OJ (1981) Output, the stock market, and interest rates. The American Economic Review 71(1):132–143
Campbell JY, Ammer J (1993) What moves the stock and bond markets? A variance decomposition for long-term asset returns. J Financ 48(1):3–37
Campbell JY, Shiller RJ (1988) Stock prices, earnings, and expected dividends. J Financ 43(3):661–676 Chen NF, Roll R, Ross SA (1986) Economic forces and the stock market. J Bus:383–403
Enders W (2004) Applied econometric time series, 2nd edn. John Wiley and Sons
Flannery MJ, James CM (1984) The effect of interest rate changes on the common stock returns of financial institutions. J Financ 39(4):1141–1153
Gordon MJ (1959) Dividends, earnings, and stock prices. Rev Econ Stat:99–105
Granger CW, Huangb BN, Yang CW (2000) A bivariate causality between stock prices and exchange rates: evidence from recent Asianflu☆. The Quarterly Review of Economics and Finance 40(3):337–354
Huang W, Mollick AV, Nguyen KH (2016) US stock markets and the role of real interest rates. The Quarterly Review of Economics and Finance 59:231–242
Jebran K, Chen S, Saeed G, Zeb A (2017) Dynamics of oil price shocks and stock market behavior in Pakistan: evidence from the 2007 financial crisis period. Financial Innovation 3(1):2
Johansen, S. (1991). Estimation and hypothesis testing of cointegration vectors in Gaussian vector autoregressive models. Econometrica:Journal of the Econometric Society, 1551–1580
Johansen S (1995) Likelihood-based inference in cointegrated vector autoregressive models. Oxford University Press on Demand
Laopodis NT (2013) Monetary policy and stock market dynamics across monetary regimes. J Int Money Financ 33:381–406 Lee BS (1992) Causal relations among stock returns, interest rates, real activity, and inflation. J Financ 47(4):1591–1603 Modigliani F, Cohn RA (1979) Inflation, rational valuation and the market. Financ Anal J 35(2):24–44
Nasseh A, Strauss J (2000) Stock prices and domestic and international macroeconomic activity: a cointegration approach. The Quarterly Review of Economics and Finance 40(2):229–245
Panda AK, Nanda S (2017) Short-term and long-term interconnectedness of stock returns in Western Europe and the global market. Financial Innovation 3(1):1
Perron, P. (1989). The great crash, the oil price shock, and the unit root hypothesis. Econometrica:Journal of the Econometric Society, 1361–1401
Pesaran MH, Shin Y, Smith RJ (2001) Bounds testing approaches to the analysis of level relationships. J Appl Econ 16(3):289– 326
Phillips PC, Hansen BE (1990) Statistical inference in instrumental variables regression with I (1) processes. Rev Econ Stud 57(1):99–125
Rjoub, H., Türsoy, T., & Günsel, N. (2009). The effects of macroeconomic factors on stock returns: Istanbul Stock market. Stud Econ Financ, 26(the 1), 36–45
Sellin P (2001) Monetary policy and the stock market: theory and empirical evidence. J Econ Surv 15(4):491–541 Stock JH, Watson MW (1993) A simple estimator of cointegrating vectors in higher order integrated systems. Econometrica:
Journal of the Econometric Society:783–820
Thorbecke W (1997) On stock market returns and monetary policy. J Financ 52(2):635–654
Türsoy T (2017) Causality between stock prices and exchange rates in Turkey: empirical evidence from the ARDL bounds test and a combined cointegration approach. International Journal of Financial Studies 5(1):8
Tursoy T, Faisal F (2016) Causality between stock price and GDP in Turkey: an ARDL bounds testing approach. Romanian Statistical Review 64(4):3–19
Tursoy T, Faisal F (2017) Re-testing for financial integration of the Turkish Stock market and the US Stock market: an evidence from co-integration and error correction models. Romanian Statistical Review 2
Tursoy T, Faisal F (2018) The impact of gold and crude oil prices on stock market in Turkey: empirical evidences from ARDL bounds test and combined cointegration. Resources Policy 55:49–54
Türsoy T, Faisal F (2018) Does financial depth impact economic growth in North Cyprus? Financial Innovation 4(1):12 Tursoy T, Gunsel N, Rjoub H (2008) Macroeconomic factors, the APT and the Istanbul stock market. Int Res J Financ Econ 22:
49–57