Open Access
Research
Determining geographic areas and populations with timely access
to cardiac catheterization facilities for acute myocardial infarction
care in Alberta, Canada
Alka B Patel*
1,3, Nigel M Waters
5and William A Ghali
2,3,4Address: 1Department of Geography, University of Calgary, 2500 University Drive NW, Calgary, AB, T2N 1N4, Canada, 2Faculty of Medicine,
University of Calgary, 3330 Hospital Drive NW, Calgary, AB, T2N 4N1, Canada, 3Department of Community Health Sciences, University of
Calgary, 3330 Hospital Drive NW, Calgary, AB, T2N 4N1, Canada, 4Centre for Health and Policy Studies, Faculty of Medicine, Department of
Community Health Sciences, University of Calgary, 3330 Hospital Drive NW, Calgary, AB, T2N 4N1, Canada and 5Department of Geography and
Director, GIS Center of Excellence, George Mason University, 4400 University Drive, Fairfax, Virginia, 22030, USA
Email: Alka B Patel* - [email protected]; Nigel M Waters - [email protected]; William A Ghali - [email protected] * Corresponding author
Abstract
Background: This study uses geographic information systems (GIS) as a tool to evaluate and visualize the general accessibility of areas within the province of Alberta (Canada) to cardiac catheterization facilities. Current American and European guidelines suggest performing catheterization within 90 minutes of the first medical contact. For this reason, this study evaluates the populated places that are within a 90 minute transfer time to a city with a catheterization facility. The three modes of transport considered in this study are ground ambulance, rotary wing air ambulance and fixed wing air ambulance.
Methods: Reference data from the Alberta Chart of Call were interpolated into continuous travel time surfaces. These continuous surfaces allowed for the delineation of isochrones: lines that connect areas of equal time. Using Dissemination Area (DA) centroids to represent the adult population, the population numbers were extracted from the isochrones using Statistics Canada census data.
Results: By extracting the adult population from within isochrones for each emergency transport mode analyzed, it was found that roughly 70% of the adult population of Alberta had access within 90 minutes to catheterization facilities by ground, roughly 66% of the adult population had access by rotary wing air ambulance and that no population had access within 90 minutes using the fixed wing air ambulance. An overall understanding of the nature of air vs. ground emergency travel was also uncovered; zones were revealed where the use of one mode would be faster than the others for reaching a facility.
Conclusion: Catheter intervention for acute myocardial infarction is a time sensitive procedure. This study revealed that although a relatively small area of the province had access within the 90 minute time constraint, this area represented a large proportion of the population. Within Alberta, fixed wing air ambulance is not an effective means of transporting patients to a catheterization facility within the 90 minute time frame, though it becomes advantageous as a means of transportation for larger distances when there is less urgency.
Published: 16 October 2007
International Journal of Health Geographics 2007, 6:47 doi:10.1186/1476-072X-6-47
Received: 12 May 2007 Accepted: 16 October 2007
This article is available from: http://www.ij-healthgeographics.com/content/6/1/47
© 2007 Patel et al; licensee BioMed Central Ltd.
Background
Cardiac catheterization and the importance of the 90 minute transfer time
Myocardial infarction (MI) arises from the blockage of blood flow to the heart and is commonly known as a heart attack. The U.S. National Library of Medicine and the National Institutes of Health have compiled an on-line encyclopedia that highlights the treatment options for MI. The treatments can be summarized under four headings: pain control medications, blood thinning medications, other medications, and surgery and other procedures.
There have been several studies in recent years that have shown the superiority of procedures such as catheteriza-tion and early angioplasty (with or without stenting) as treatment for acute myocardial infarction (AMI). When the AMI type is an ST segment elevation myocardial inf-arction (STEMI – a subtype of AMI diagnosed by an elec-trocardiogram), immediate re-establishment of the blood flow is desirable. Early catheterization has been directly compared to the use of blood thinning medications such as thrombolytic therapy, and shown to reduce mortality rate and recurrence of myocardial infarction [1-4]. How-ever, the success of using catheterization to treat STEMI is dependent on a number of factors; one of the most docu-mented influences on its success is the time to treatment.
Early catheterization permits the rapid detection and localization of arterial blockages that can then be treated with percutaneous coronary intervention (PCI). This is a procedure involving catheter passage through the blocked area, balloon inflation to dilate the affected artery, and in most cases, insertion of a metal stent that helps to keep the artery open. Delaying PCI ultimately results in an increase in the mortality rate for patients [5]. Current American and European guidelines suggest performing cardiac catheterization within 90 minutes of the first med-ical contact [6,7]. For this reason, this study focuses on determining the populated places that are within a 90 minute transfer time to a city with a catheterization facil-ity. This determination is crucial as the cardiac catheteriza-tion procedure is time sensitive [8].
The time sensitive nature of catheter intervention for AMI necessitates that access to cardiac catheterization facilities be studied. Within the province of Alberta (Canada), there are three cardiac catheterization facilities. One is located in Calgary at the Foothills hospital, and two are located in Edmonton at the Royal Alexandra hospital and the Uni-versity of Alberta hospital. Because access to these facili-ties is dependant in part to the geographic location of patients, geographic information systems (GIS) are a potentially valuable tool for studying this problem.
GIS in accessibility analysis
Accessibility measures are commonly integrated into GIS studies regarding access to health services. There are a number of studies in recent years that have utilized GIS as a tool for evaluating accessibility to health services [9-12]. In addition to evaluating accessibility to health services, GIS has proven to be an effective tool for evaluating emer-gency transport decisions to these services. One study con-sidered how GIS could be used as a tool to help make transport decisions for trauma patients [13]. This study is of interest because its goal was to create a map that would show where air or ground ambulance would be preferred to transport patients to a trauma centre, in terms of faster travel time.
In this paper, we use GIS and reference travel time data from the regional air ambulance provider to: 1) Deter-mine the areas within the province where transfer to a hospital for catheter intervention would be the preferred method of treatment for AMI and evaluate the proportion of the adult population living within these defined areas, and thus having rapid access to catheter intervention for AMI; and 2) Determine which areas of the province are best served by a certain mode of transport in terms of fast-est travel time.
Methods
Study area
The area of focus for this study is the province of Alberta, a western Canadian province with a population of approximately three million. Figure 1 shows the extent of the study area; highlighted are the three catheterization facilities that are of interest for this project. For reference purposes, this figure includes the populated places with a population greater than 2000 within the provincial boundaries. The populated places are the municipalities that are typically the originating points for patient transfer to the larger cities with catheterization facilities. There are 136 different municipalities that are included in this study and two major cities within the province where the cathe-terization facilities are located. One cathecathe-terization facil-ity is located in the cfacil-ity of Calgary and two are located in the city of Edmonton. For the purpose of this study the two catheterization facilities in Edmonton are treated as one due to their close proximity and the small scale of this analysis.
fea-ture of the province that can be ascertained from the map in Figure 1 is the terrain. It can be seen that along the south-western boundary of the province (which is adja-cent to the province of British Columbia) there is a range of mountains (Rocky Mountains). In this area the road
networks and populated places are sparse. Although the terrain data shown in the figure are not explicitly used for analytical purposes, these data provide an impression of the physical environment within the province.
Study Area: Province of Alberta Figure 1
Study Area: Province of Alberta.
Calgary Edmonton
Olds
Taber Hanna Edson
Devon
Banff
Leduc
Morley Jasper
Elnora Breton
Sundre
Rimbey Ponoka Hinton
Brooks Wabasca
Empress St Paul
Raymond Okotoks
Lacombe
Canmore Airdrie
Camrose
Gleichen
Standoff Westlock
Stettler Redwater Grimshaw
Fairview
Didsbury
Coaldale
Cardston Barrhead
Red Deer
Blairmore
Hay Lakes Athabasca
Innisfail Fox Creek
Carstairs
Cold Lake
Torrington Trout Lake
Whitecourt
Wainwright Vermillion Vegreville Slave Lake
High River High Level
Claresholm
Bonnyville
Drumheller Wetaskiwin
Lethbridge Bragg Creek
Three Hills Sylvan Lake
Stony Plain Peace River
Beaverlodge
Water Valley Grande Cache
Lac La Biche High Prairie
Medicine Hat Lloydminster
Pincher Creek Fort Vermilion
Drayton Valley Grande Prairie
Red Earth Creek
Rocky Mtn House
Fort Saskatchewan
Carseland St Albert
Strathmore
Fort Macleod
Fort Chipewyan
Cath Facility
Highways
Populated Places
Major City
0 50 100 200 300 400
Kilometres
Study Area: Province of Alberta
Data Sources:
Data Source: Alberta Chart of Call
To study the accessibility of areas in terms of travel time, it was necessary to obtain data on travel times from differ-ent originating locations within the province to the cathe-terization facilities within Calgary and Edmonton. Although it was not possible to obtain detailed individual trip records within the time constraints of this study, it was possible to obtain generalized reference data on travel times via different modes of transportation. An integral data set used in this study is the Alberta Chart of Call. The Chart of Call is used in the Alberta Shock Trauma Air Res-cue Society's (STARS) Emergency Link Centre and its pri-mary objective is to "assist dispatchers in choosing the most appropriate air carrier and medical crew once a med-ical decision has been made that a patient needs to be transported" [14]. The data within this manual are col-lected and compiled by the Provincial Flight Coordina-tion Centre and STARS. The three different modes of transportation accounted for in this reference manual are rotary wing air ambulance (RW), fixed wing air ambu-lance (FW) and ground ambuambu-lance (GRD).
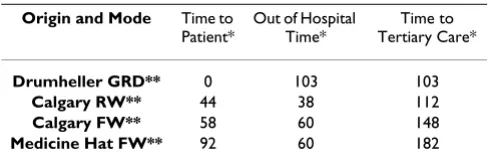
Table 1 shows an example of the data used from the Chart of Call for the municipality of Drumheller, Alberta. For each municipality there is one record that contains differ-ent options for patidiffer-ent transport to a city with a tertiary care centre. Within the Chart of Call, the overall travel times to tertiary care for the two air ambulance options (FW and RW) are calculated based on average yearly response times; the individual records used to obtain the averaged time were not available for this study. The ground ambulance times are calculated using a fixed cal-culation of the distance along the road network from city centre to city centre divided by 100 km/hr with the addi-tion of 10 minutes for in city travel added at both the ori-gin and destination. Although this fixed travel time may seem unrealistic for road travel, the consideration must be
made that ambulances often travel at speeds above the posted speed limit; the fixed addition of 10 minutes at both the origin and destination accounts for the imped-ance encountered through in-city travel. In the absence of individual travel time records to evaluate the air and road travel time and variability encountered with varying con-ditions, the Chart of Call data was deemed a credible data source in this study as the time calculations were based on consultation with the stakeholders of the Alberta Air Ambulance Program [14].
Included in the final time to tertiary care are fixed loading and unloading times associated with all three modes. Both air modes also contain a fixed addition of time in the calculation called '30-minute in hospital time', which accounts for patient stabilization and preparation for transport; there is no such time assigned to ground trans-port in the Chart of Call because there is typically less time involved in preparing a patient for transport via ground. Air ambulance time calculations also contain a 'time to patient' that represents the time from dispatch to the time the air carrier reaches a patient. Ground ambulances are more typically ready to transport a patient and thus in the Chart of Call calculations there is no addition of 'time to patient' for the ground mode of transport. The application of this generalized data set to this study is justified by its daily use as part of the decision making process for patient transport within the province of Alberta.
Interpolating travel time surface
In this study the method of spatial interpolation was used to create a continuous surface of patient transport times for the different modes of transport. Given a set of point locations with known values over a surface, the method of spatial interpolation finds a "function that will best repre-sent the whole surface and that will predict values at other points or for other sub areas" [15]. The Chart of Call records (an example is shown in Table 1) were compiled into three separate tables, each representing one mode of transport. The individual tabular files for the three modes of transport were ultimately converted into a continuous surface of travel times within ESRI ArcGIS 9.1 software [16]. Figures 2 and 3 highlight the data, methods and gen-eral processes used in this study.
First, each of the Chart of Call modes was individually joined to the Populated Places point file. This Populated Places file was created by DMTI Spatial [17] and repre-sents the municipalities or originating points of travel to a city with a catheterization facility. Although there were 136 municipalities used in this study, each was not always serviced by all three modes. Joining the Chart of Call records to point locations within a GIS made it possible to give each origin's time to tertiary care a geographic loca-tion. In this study only the fastest travel time was used. For
Table 1: Example of travel time data from Chart of Call for Drumheller, AB
Origin and Mode Time to Patient*
Out of Hospital Time*
Time to Tertiary Care*
Drumheller GRD** 0 103 103
Calgary RW** 44 38 112
Calgary FW** 58 60 148
Medicine Hat FW** 92 60 182
* Time to Patient is the time from dispatch until the response team arrives at the sending hospital. Out of Hospital Time is the time that the patient is out of a hospital while being transported from the sending facility to the tertiary care centre. Time to Tertiary Care is the total time from dispatch to arrival at the tertiary care centre. Note: Both air modes contain a fixed addition of time in the final Time to Tertiary Care calculation called '30-minute in hospital time', which accounts for patient stabilization and preparation for transport [14].
example, if there was an originating location in the Chart of Call that had multiple options for FW transport, only the fastest FW transport time was joined to the populated places point. For example, in Table 1 there are two options for FW transport from Drumheller to Calgary. One option is a FW originating in Calgary and the other is a FW origi-nating in Medicine Hat. Since the Calgary FW has a faster travel time than the one originating in Medicine Hat, only the Calgary FW data is included in this study.
Once these joins were made to shortest travel times, there were a total of 99 FW points, 109 RW points and 126 GRD points available for the subsequent interpolation. A vari-ety of interpolation methods were investigated during the preliminary stages of analysis (e.g. inverse distance weighting, radial basis function, global and local polyno-mial methods and kriging). Local polynopolyno-mial interpola-tion was selected because this method had the best fit to the data available for each transportation mode. The travel time data used for this study were averaged over dif-ferent seasons and times of day and represented a subset of the municipalities within the study area; consequently there was a need to match the interpolation method to the data used.
Inverse distance weighting and radial basis function (both exact methods of interpolation that honor the original data points) created surfaces that were irregular with the appearance of 'bull's eyes' in some areas due to the distri-bution of the point data. Global polynomial interpolation created an overly generalized surface while kriging pro-duced a surface with a false sense of precision. Since the data were averaged, a method was needed that would show the changes in the travel times over the study area without creating a false sense of precision in the results. Local polynomial interpolation was the best method for this. There are a variety resources available to researchers which discuss in detail the theoretical basis of the differ-ent interpolation methods [15,18-20].
Figure 2 reveals that the method of interpolation created three surfaces and isochrones: a set of interpolated sur-faces and isochrones for each of the modes of transport (FW, RW, and GRD). The three interpolated surfaces were converted to raster data files using ArcGIS 9.1. Raster data files were created in order to compare the study area for the three modes on a cell by cell basis to determine the mode with the fastest travel time for each cell. Using the
Raster Calculator tool in ArcGIS, the three modes were compared using conditional statements. The following is an example of the statement used to find the areas with the fastest travel times for GRD: GRDfaster = con([GRD] < [FW], con([GRD] < [RW], 3, 2), 1). Using this statement, the cells where GRD transport had the lowest travel time in comparison to the other modes, were given a value of 3.
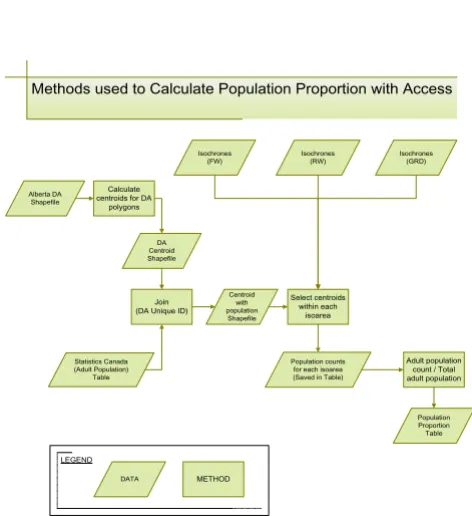
Methods used to calculate population proportion with access Figure 3
Methods used to calculate population proportion with access. (Abbreviations: GRD = ground ambulance; RW = rotary wing air ambulance; FW = fixed wing air ambu-lance; DA = dissemination area)
LEGEND
METHOD
DATA
Methods used to Calculate Population Proportion with Access
Select centroids within each
isoarea
Population counts for each isoarea (Saved in Table) Statistics Canada
(Adult Population) Table
Join (DA Unique ID)
Isochrones (RW) Isochrones (FW) Isochrones (GRD) Alberta DA Shapefile Calculate centroids for DA
polygons
DA Centroid Shapefile
Adult population count / Total adult population Centroid with population Shapefile Population Proportion Table
Methods used to create interpolated travel time surfaces Figure 2
Methods used to create interpolated travel time sur-faces. (Abbreviations: GRD = ground ambulance; RW = rotary wing air ambulance; FW = fixed wing air ambulance; TTC = time to tertiary care)
LEGEND
METHOD
DATA
Methods used to Create Interpolated Travel Time Surfaces
Alberta Chart of Call (FW) Table
Join (Name to Origin)
Interpolation Based on TTC
Alberta Chart of Call (RW) Table Alberta Chart of Call (GRD) Table Populated Places Shapefile Interpolated Surface (FW) Interpolated Surface (GRD) Interpolated Surface (RW) Isochrones (RW) Isochrones (FW) Isochrones (GRD) Origins with TCC
In order to create a visualization comparing all three modes of transport, three surfaces were created that showed areas where each mode was the fastest means of patient transport (e.g. one surface showing where RW was fastest, one where FW was fastest and one where GRD was fastest). Once the fastest areas for all three modes were cre-ated, it was possible to overlay these three layers onto one another to create a visualization of the locations where each mode of transport would be preferred for patient transport to a city with a tertiary care centre.
Evaluating the population with access
Once the interpolated surfaces were created, the results were displayed as isochrones and these isochrones were then converted to a shapefile, which is a vector data stor-age format used within ESRI software. An isochrone is a linear representation of an equal time interval from a specified location and thus can be used to display results from an accessibility analysis in terms of travel time. The creation of the isochrone lines made it possible to begin extracting the adult population (20 years of age and older) having access within different travel time intervals. The census unit used for this study was the Statistics Canada dissemination area. Dissemination areas (DA) are the smallest geographic area for which census data are dis-seminated. Each DA contains roughly 400 to 700 people and respects the boundaries of the census tracts and cen-sus subdivision so they remain relatively stable over time [21].
Figure 3 highlights the data and methods used to evaluate the population proportion with access. First, using the DA polygon shapefile, calculations were made within ArcGIS to find the centre of the DA boundaries. These locations, called centroids, were represented by a point shapefile and used to join to the population data that was in tabular format. The isochrone layers were then overlaid onto the DA centroids and a select by location operation was per-formed within ArcGIS to extract the population (in the form of DA centroids) within different isoareas. Those centroids were selected which have their centre in a specific isoarea; this data set contained no centroids that fell directly on an isochrone line. Using a method that selected points from areas ensured that the population was not double counted. The misclassification of DA cen-troids (a DA being included or excluded from within an isochrone) could occur, but the error created would be random and non-directional. These methods were devel-oped based on processes used in previous studies [10,11].
The population counts within each time interval were transferred to a tabular file and then converted to propor-tions of total population. This would allow for an esti-mate of the population proportion with access within selected travel time minutes. This study used the most
cur-rent available data which were collected in the 2001 cen-sus when the total population of Alberta was calculated to be 2977625 people. Details on the collection of the Statis-tics Canada census data can be found in the 2001 Census Handbook [22].
Results
Areas with access to catheterization facilities
Figure 4 shows the time to tertiary care for the three modes of transportation presented side by side for comparative purposes. When viewing the map for ground ambulance transport, the origin points used for the interpolation are noticeably concentrated in the southern and western areas of the province. For the rotary wing ambulance, the points are concentrated only in the southern areas of the prov-ince within 250 km of the centres of Calgary and Edmon-ton (where the catheterization facilities are located). For the fixed wing air ambulance, the points used for the interpolation are spread more evenly throughout the province but the concentration of points is in the central eastern side of the province. Additionally, for the fixed wing mode there are fewer points within 100 km of the catheterization facilities.
The travel times interpolated using these points show vis-ible trends. The ground ambulance travel times within 90 minutes of a city with a tertiary care centre cover a larger area than the area covered by the rotary wing air ambu-lance. When comparing GRD to RW travel times between 120 and 180 minutes, there is a larger distance covered in the same amount of time by RW. The larger distance cov-ered by the RW mode is represented through the wider time intervals in the RW interpolation.
Figure 4 shows that fixed wing travel times are higher around the major cities in comparison to GRD or RW, but this mode has lower times for areas that are further north than the other two modes of transport. There is a clear asymmetry in the appearance of travel times via fixed wing air ambulance. While the RW and GRD times appear to increase radially from the two major cities, the fixed wing travel times do not exhibit this same pattern.
Population with access
that has access within 120 minutes using the fixed wing mode of transport.
The percentage of the population within 120 minutes is only slightly higher using ground over rotary wing air ambulance. There are 40865 more people who have access by ground at 120 minutes when compared with rotary wing for the same time interval. For 180 minutes the proportion of population becomes higher for RW than for GRD. Also, within 180 minutes transport time to a tertiary care facility, FW becomes an option for patient transport from some regions. Using the Chart of Call data it was found that the proportion of population for fixed wing transport is lower for this time interval than for both RW and GRD. At 180 minutes there are 30715 more peo-ple with access by RW over GRD and 79220 more peopeo-ple who have access by RW over FW.
Comparison of different modes
Figure 5 is a visualization showing where each mode would be faster throughout Alberta. In this figure areas where FW would be the fastest mode for transporting a patient to a tertiary care centre are shown in blue, those where RW would be fastest are shown in green and those where ground would be fastest are shown in yellow. The red circles represent the 250 kilometre extent of RW air ambulance service. The limitation of distance flown by the current helicopters is due to the maximum distance this mode can fly without refuelling.
The areas closer to the major cities, where the road net-work is denser, are the areas where using ground ambu-lance for patient transport would be preferred. Within the RW service area, it appears that benefit is greater as one moves further from the city. The areas within the rotary wing ambulance service extents are best served by rotary wing when comparing RW to FW. There is a very small area to the east of Calgary where it appears that RW is faster than GRD. Finally, there is an area in the north-east-ern portion of the province where travel is deemed to be faster by RW than by FW.
Table 2: Population proportion within each isoarea for GRD, RW and FW
Time to Tertiary Care Within 90 minutes
Within 120 minutes
Within 180 minutes
Ground 0.696 0.801 0.894
Rotary Wing 0.661 0.782 0.909
Fixed Wing 0 0 0.872
Travel time to city with a tertiary care centre Figure 4
Travel time to city with a tertiary care centre. (Abbreviations: LPI = local polynomial interpolation) Origin
Cath Facility Highways
Travel Time (min)
< 60 60 - 75
75 - 90 90 - 105 105 - 120
120 - 135 135 - 150 150 - 165
165 - 180 > 180
Data Sources:
Highways: CanMap® RouteLogistics: DMTI Spatial (2001) Origin: Populated Placenames: DMTI Spatial (2001) Travel Times: Interpolated using LPI with Alberta
Chart of Call: PFCC/STARS (2002)
0 75 150 300 450 600
Kilometres
Travel Time to a City with a Tertiary Care Centre
Discussion
Areas and population with access to catheterization facilities
Our findings show that only rotary wing and ground ambulance are viable options for patient transport to catheterization facilities within 90 minutes. It was found that roughly 70% of Alberta's adult population had access to a city with a catheterization facility by ground transport within the 90 minute constraint while roughly 66% of the adult population had access by rotary wing air transport. This is lower than the national level of access in the United States where it was found that by ground, nearly 80% of the adult population lived within 60 minutes of a hospital with a cardiac catheterization facility [23]. The lower population density and typically lower number of
facilities within the province of Alberta when compared with the US as a whole is one explanation for the lower population proportion with geographic access.
The level of access in Alberta is also lower than the popu-lation access to tertiary care facilities in Wales, UK, where one study estimated that between 73–78% of the popula-tion had access within 60 minutes by ground and between 84–91% had access within 90 minutes by ground to terti-ary care facilities [10]. There were five cities with tertiterti-ary facilities in Wales and the surrounding area of the UK that were included in this study. The higher numbers of facili-ties, higher population density and shorter distance to travel to the nearest facility are probable explanations for the differences seen between Wales and Alberta. In our
Comparison of three modes of transport Figure 5
Comparison of three modes of transport. (Abbreviations: GRD = ground ambulance; RW = rotary wing air ambulance; FW = fixed wing air ambulance; LPI = local polynomial interpolation)
0 50 100 200 300 400 Kilometres
Best Mode of Transport to a City with a Cardiac Catheterization Facility
Data Sources:
Highways: CanMap® RouteLogistics: DMTI Spatial (2001) Populated Places : Populated Placenames: DMTI Spatial (2001) Travel Times: Interpolated using LPI with Alberta Chart of Call:
PFCC/STARS (2002) Hillshade: Created from GeoBase® DEM (2001) Cath Facility
Populated Places Highways
study and in the studies discussed above, the primary focus was on geographic access. Individual access, which would be affected by socio-economic conditions and other factors, was not directly assessed in these studies.
The expectation may be to see an increase in the popula-tion proporpopula-tion with access when a patient is being trans-ported by helicopter, but there are initial time costs involved with patient transport by air (e.g. time to patient, time for patient stabilization and preparation for trans-port). These initial time costs result in ground being a bet-ter option for transport until the threshold of the fixed time costs are overcome. Other studies have also found that areas closest to the destination facilities are best served by ground transport due to the distance from the helicopter base to the scene and due to the time necessary to deploy such vehicles [13,24]. The areas where helicop-ter is fashelicop-ter than ground transport can be thought of as areas where this initial time cost has been overcome. Based on the population study, it appears that this cost is overcome between 120 and 180 minutes; this is seen in the higher proportion having access within 180 minutes by helicopter than by ground.
Figure 4 showed that the areas accessible within 90 min-utes by helicopter were concentric around the major cities. This is a result of the flight pattern for air transport that would be similar to a straight line distance, thereby mak-ing the travel times and distances correlated [25]. The rotary wing travel times outside of a 250 kilometre radius of Calgary and Edmonton can be disregarded since the current rotary air ambulance service in Alberta only flies within these limits. Although the fixed wing air ambu-lance proved to be unsuitable for transporting AMI patients, the results revealed that this mode of transport could reduce the patient transport time for areas that are outside the RW service area. This is an important finding when considering patients who do not need to be trans-ported within 90 minutes to a city with a tertiary care cen-tre (i.e. for less urgent tertiary services).
The asymmetry for FW travel time around the city centres is likely due to the variation in the start location for this mode. When fixed wing is destined for Calgary the origin of the FW is Calgary in the majority of cases (i.e. a round trip has to be made). In contrast, many fixed wing ambu-lances which are destined for Edmonton are dispatched from centres such as Lac La Biche, Grande Prairie, Fort McMurray, Peace River and Slave Lake (See Figure 1). This difference in origins for the FW ambulances causes the asymmetry in travel times around Edmonton for this mode. The variations in the results between GRD, RW and FW transport seen in Figure 4 show that the methods used in this study can help to gain a visual understanding of those areas within the province where transport to a
cath-eterization facility should be the preferred method of treatment.
Comparison of different modes
In addition to the findings specific to AMI care, some gen-eral findings on the nature of GRD, RW and FW transport within Alberta were also uncovered. It was found that closer to the cities with tertiary care facilities, GRD would be the fastest mode of transport. Beyond a 100 km radius of the two major cities, RW started to become a faster mode of transporting patients; this was especially appar-ent in the eastern and northern parts of the province within the RW service area.
Although the three mode comparison provided some gen-eralizations on travel times for the different modes of transportation, it is believed that the comparison between GRD and RW does not show the true delineations of the areas where transport would be faster by air. The Alberta Chart of Call data used in this study were for populated areas, most with a community hospital. There are a number of rural areas along the Alberta-British Columbia provincial borders that are not easily accessible by road. Areas without access to a major highway would be areas where it is expected that patient transport would be faster using RW over GRD. The generalization using interpola-tion mutes these finer delineainterpola-tions between areas where one mode would be preferred over another due to the sparseness of data in this area. Previous studies that deter-mined the appropriate mode of patient transport within different areas found that these finer delineations were possible when actual trip records were used [13]. Obtain-ing individual trip records for GRD as well as a travel times for RW from locations that are not populated would provide a better indication of where different modes would be preferred for patient transport.
is potential for our findings to be reconsidered in step with new technology.
Prior studies have compared accessibility to hospitals in terms of travel time for rotary wing and ground ambu-lance transport [13,24,26]. There have also been specific studies performed to understand national level access to cardiac catheterization facilities in terms of ground ambu-lance travel times [23]. This study contributes to current literature on access to tertiary care facilities by comparing three modes of emergency transport. The data used for the study conducted in this paper allowed for a regional understanding of the accessibility of cardiac catheteriza-tion facilities to the general populacatheteriza-tion using ground, hel-icopter and fixed wing emergency transport. Determining the areas with access within 90 minutes to a cardiac cath-eterization facility gives an indication of where direct referral to these facilities would be preferred over trans-port to a non-catheterization facility.
Caveats and future research
The time constraint used in this study is based on current guidelines but is not inflexible. The limit of 90 minutes is somewhat arbitrary and clinical judgement is ultimately needed in order to determine if patient transport to a cath-eterization facility is the best option for treatment even if the 90 minute time period is exceeded. The fact that all AMI do not have the same risk is another consideration that must be made when making transport decisions. Another aspect of time important to consider is the door-to-balloon time, which is the time from patient presenta-tion to the hospital to reperfusion. The study in this paper considers the patient transport time from dispatch to the door of the hospital. The delays encountered within the hospital are not considered.
We remind readers that in discussing AMI in this study, our specific condition of focus is STEMI (ST segment ele-vation myocardial infarction). This condition can be dis-tinguished from other acute coronary syndromes through the use of an electrocardiogram (ECG). One method which could be incorporated into the patient transport process to reduce the door-to-balloon time is a STEMI pro-gram where ambulance attendants are trained to diagnose STEMI from the ECG; once a STEMI is diagnosed en route the patient can be transported directly to a catheterization facility, thus eliminating the need for transfer from a facil-ity which does not provide catheterization services [27]. Furthermore, such care pathways can incorporate expe-dited transfer through emergency room bypass to reduce door-to-balloon times (i.e. patients are sent directly to the catheterization lab).
Although some areas may show that ground is the faster means of transporting a patient, there are various
consid-erations that must be made when choosing the mode of patient transport. Through personal communications with the STARS emergency link centre staff it was uncov-ered that the final decision for patient transport at the link centre was made by an Emergency Referral Physician (ERP). Some of the factors that affect transport mode deci-sions relate to the patient's condition, time for patient preparation and level of in-transport care needed.
When patients are transported by air there is the possibil-ity for an in-flight physician to be present thereby allow-ing patient access to medical care before they reach the hospital. One study found that cardiac patients trans-ported by air presented to hospitals with reduced chest pain, a result of the medical care given en route [26]. It is therefore important to consider that the fastest mode may not always be the 'best' mode in certain conditions. Issues such as time to patient or availability of RW influence the decision of using RW, while time of day and congestion can dissuade the use of GRD. While geography can aid in this decision making process, the ultimate decision is a clinical one based on patient needs and their require-ments for transport.
The methods and data used for this study proved to be effective for generalizations but the reader should be aware that different interpolation methods yield dissimi-lar surfaces. Also, interpolation methods are sensitive to the sample size (number of points used) and the density or sparseness of the points. For the purpose of this study it was decided that only the general trend of the travel times was desired. Using interpolation methods that would create highly irregular time surfaces gave a sense that variation in the travel times were being uncovered that were not possible with the use of these generalized data. Increasing the number and distribution of originat-ing points of travel would allow for the use of alternative interpolation methods and ultimately increase the preci-sion of this study. One study showed that using a large database of originating points for patient travel time allowed for the delineation of confidence intervals around travel time zones created using the method of interpolation [13].
loca-tions. Additionally, using individual data would allow for sensitivity testing across the different spatial interpolation methods to quantify the differences produced in the results.
There are other important research directions which can be taken using this study as a basis. Since the census data used in this study were collected in 2001, there will be a need to reevaluate the results using 2006 census data when the new census data become publicly available. Within this five year period, there has been an increase in the population in the northern areas of Alberta. Since this is an area that is not currently accessible within the recom-mended time frame, future studies using GIS could evalu-ate how the addition of a facility in northern Alberta would affect the population proportions with access. The addition of such a facility would of course be dependent on both the financial and staff resources available in this area.
Conclusion
The results of this analysis have shown that the areas within the province that are accessible to catheterization facilities within 90 minutes are limited. Although these areas with access are limited, there is a high percentage of the total population within these regions, due to the con-centration of the population within and surrounding the major city centres of Calgary and Edmonton. Ground and rotary wing ambulance are the two modes of transporta-tion that make access to a catheterizatransporta-tion facility within the 90 minute target time frame possible. Direct transfer of AMI patients to the nearest cardiac catheterization facil-ity within these areas would be preferred based on current outcomes research.
This paper has shown that GIS is a powerful tool that can be used to determine accessibility to catheterization facil-ities. However, data limitations dictate that the results are generalizations and should be considered with some cau-tion. In order to make more accurate determinations of areas with access to catheterization facilities it is necessary to obtain individual trip records of patient transport via the different modes.
Competing interests
The author(s) declare that they have no competing inter-ests.
Authors' contributions
ABP compiled data, performed analysis and drafted the manuscript. NMW participated in the design of the study, consulted on the geographic techniques to be used and provided comments on the manuscript. WAG conceived the study, and participated in its design and coordination
and provided comments on the manuscript. All authors read and approved the final manuscript.
Acknowledgements
The authors would like to thank the Alberta Shock Trauma Air Rescue Society (STARS) for making the Alberta Chart of Call available and for pro-viding a background understanding of the data and the processes involved in air ambulance dispatch. The Alberta Provincial Project for Outcome Assessment of Coronary Heart Disease (APPROACH) researchers are thanked for providing comments on this study.
WAG is supported by a Health Scholar Award from the Alberta Heritage Foundation for Medical Research and by a Government of Canada Research Chair in Health Services Research. NMW is supported by a Geomatics for Informed Decisions (GEOIDE) research grant and by a Social Science and Humanities Research Council of Canada grant. ABP is supported by a Cana-dian Cardiovascular Outcomes Research Team (CCORT) doctoral fellow-ship funded through a Canadian Institutes of Health Research (CIHR) Team Grant in Cardiovascular Outcomes Research.
References
1. Henriques JPS, Zijlstra F, van't Hof AWJ, de Boer MJ, Dambrink JHE,
Gosselink ATM, Hoorntje JCA, Ottervanger JP, Suryapranata H:
Pri-mary percutaneous coronary intervention versus thrombo-lytic treatment: long term follow up according to infarct location. Heart 2006, 92(1):75-79.
2. de Jaegere PP, Serruys PW, Simoons ML: Should all patients with
an acute myocardial infarction be referred for direct PTCA? Heart 2004, 90(11):1352-1357.
3. Andersen HR, Nielsen TT, Rasmussen K, Thuesen L, Kelbaek H,
Thayssen P, Abildgaard U, Pedersen F, Madsen JK, Grande P, Villadsen AB, Krusell LR, Haghfelt T, Lomholt P, Husted SE, Vigholt E, Kjaergard
HK, Mortensen LS: A comparison of coronary angioplasty with
fibrinolytic therapy in acute myocardial infarction. New Eng-land Journal of Medicine 2003, 349(8):733-742.
4. Keeley EC, Boura JA, Grines CL: Primary angioplasty versus
intravenous thrombolytic therapy for acute myocardial inf-arction: a quantitative review of 23 randomised trials. Lancet
2003, 361(9351):13-20.
5. Steg PG, Juliard JM: Primary percutaneous coronary
interven-tion in acute myocardial infarcinterven-tion: time, time, and time! Heart 2005, 91(8):993-994.
6. Antman EM, Anbe DT, Armstrong PW, Bates ER, Green LA, Hand M,
Hochman JS, Krumholz HM, Kushner FG, Lamas GA, Mullany CJ,
Ornato JP, Pearle DL, Sloan MA, Smith SC: 2004 ACC/AHA
guide-line for the management of patients with STEMI: Executive Summary. Circulation 2004, 110:588-636.
7. Van de Werf F, Ardissino D, Betriu A, Cokkinos DV, Falk E, Fox KAA,
Julian D, Lengyel M, Neumann FJ, Ruzyllo W, Thygesen C,
Under-wood SR, Vahanian A, Verheugt FWA, Wijns W: Management of
acute myocardial infarction in patients presenting with ST-segment elevation. European Heart Journal 2003, 24(1):28-66.
8. Ghali WA, Donaldson CR, Knudtson ML, Lewis SJ, Maxwell CJ, Tu JV:
Rising to the challenge: transforming the treatment of ST-segment elevation myocardial infarction. Canadian Medical Association Journal 2003, 169(1):35-37.
9. Dummer TJB, Parker L: Hospital accessibility and infant death
risk. Archives of Disease in Childhood 2004, 89(3):232-234.
10. Christie S, Fone D: Equity of access to tertiary hospitals in
Wales: a travel time analysis. Journal of Public Health Medicine
2003, 25(4):344-350.
11. Brabyn L, Skelly C: Modeling population access to New Zealand
public hospitals. Int J Health Geogr 2002, 1(1):3.
12. Branas CC, MacKenzie EJ, Williams JC, Schwab CW, Teter HM,
Flan-igan MC, Blatt AJ, ReVelle CS: Access to trauma centers in the
United States. JAMA 2005, 293(21):2626-2633.
13. Lerner EB, Billittier AJ, Sikora J, Moscati RM: Use of a geographic
information system to determine appropriate means of trauma patient transport. Academic Emergency Medicine 1999,
Publish with BioMed Central and every scientist can read your work free of charge
"BioMed Central will be the most significant development for disseminating the results of biomedical researc h in our lifetime."
Sir Paul Nurse, Cancer Research UK
Your research papers will be:
available free of charge to the entire biomedical community
peer reviewed and published immediately upon acceptance
cited in PubMed and archived on PubMed Central
yours — you keep the copyright
Submit your manuscript here:
http://www.biomedcentral.com/info/publishing_adv.asp
BioMedcentral
14. PFCC, STARS: Air Ambulance Program Policy and
Proce-dures. Alberta ; 2002.
15. Lam NSN: Spatial Interpolation Methods - A Review. American
Cartographer 1983, 10(2):129-149.
16. ESRI: ESRI - The GIS software leader. [http://www.esri.com/].
17. DMTI: Location Intelligence Solutions. DMTI Spatial . [http:/
/www.dmtispatial.com].
18. Chang K: Introduction to Geographic Information Systems.
3rd edition. New York , McGraw Hill; 2006.
19. Mitas L, Mitasova H: Spatial Interpolation (Ch. 34). In
Geograph-ical Information Systems: Principles, Techniques, Applications and
Manage-ment Second edition. Edited by: Longley P, Goodchild MF, Maguire
DJ, and Rhind DW.. Wiley, New York.; 1999:Pp. 481-92.
20. Waters N: Unit 40: Spatial Interpolation I. [http://
www.geog.ubc.ca/courses/klink/gis.notes/ncgia/u40.html#SEC40.2].
21. StatisticsCanada: Geographic units: Dissemination areas.
[http://www12.statcan.ca/english/census01/Products/Reference/dict/ geo021.htm].
22. StatisticsCanada: 2001 Census Handbook. Canada ; 2001.
23. Nallamothu BK, Bates ER, Wang YF, Bradley EH, Krumholz HM:
Driving times and distances to hospitals with percutaneous coronary intervention in the United States - Implications for prehospital triage of patients with ST-elevation myocardial infarction. Circulation 2006, 113(9):1189-1195.
24. Diaz MA, Hendey GW, Bivins HG: When is the helicopter faster?
A comparison of helicopter and ground ambulance trans-port times. J Trauma 2005, 58(1):148-153.
25. Diaz MA, Hendey GW, Winters RC: How far is that by air? The
derivation of an air : ground coefficient. Journal of Emergency Medicine 2003, 24(2):199-202.
26. Berns KS, Hankins DG, Zietlow SP: Comparison of air and
ground transport of cardiac patients. Air Medical Journal 2001,
20(6):33-36.
27. de Villiers JS, Anderson T, McMeekin JD, Leung RCM, Traboulsi M: