http://www.sciencepublishinggroup.com/j/ogce doi: 10.11648/j.ogce.20180605.11
ISSN: 2376-7669 (Print); ISSN: 2376-7677(Online)
Measurement Scheme of Local Water Holdup in Oil-Water
Two-Phase Flow Based on Edge Effect of Interdigital
Capacitance Method
Chen Qiang
1, *, Qin Minjun
1, Liu Guoquan
1, Li Qingping
1, Yu Houquan
2, Wei Yong
2, Fang Yu
31Production Logging Center, China Petroleum Logging Limited Company, Xi'an, China
2
Electronics & Information School, Yangtze University, Jingzhou, China 3
Wireless Department, Wuhan Hongxin Communication Technology Limited Company, Wuhan, China
Email address:
*
Corresponding author
To cite this article:
Chen Qiang, Qin Minjun, Liu Guoquan, Li Qingping, Yu Houquan, Wei Yong, Fang Yu. Measurement Scheme of Local Water Holdup in Oil-Water Two-Phase Flow Based on Capacitance Method. International Journal of Oil, Gas and Coal Engineering.
Vol. 6, No. 5, 2018, pp. 81-87. doi: 10.11648/j.ogce.20180605.11
Received: June 21, 2018; Accepted: July 5, 2018; Published: August 27, 2018
Abstract:
In order to realize array measurement of water holdup on oil well section, a capacitance-based sensor with planar inter-digital structure is proposed, an integrated detecting module is designed, which converts the measured capacitance value to periodic signal with corresponding frequency, a circuit which extracts signal from current change of power supply is developed. The experimental result shows the above solution has advantages to minimize size sensor, less connections between sensor and circuit boards, strong anti-interference performance and high definition when water holdup is not above 50%, thereby, it has important reference value for developing array capacitance-based log tool for water holdup measurement.Keywords:
Capacitance Method, Water Holdup, Array Sensor Measurement, Edge Effect, Integration1. Introduction
Water holdup of oil well is an important parameter for the decision of crude oil production. On the scene, one of the commonly used methods of water holdup detection is capacitive method by dint of catchment umbrella. The effect of gravity in horizontal wells and high-angle wells leads to oil-water stratification on the cross profile of oil well, and the long distance wave fluctuation in horizontal wells and high-angle wells lead to an abnormally complex flowing state. The common detection method used in vertical wells such as capacitive method by dint of catchment umbrella cannot accurately reflect the water holdup information of horizontal wells and high angle deviated wells. In order to obtain information of oil-water distribution on oil well cross profile, relevant institutes at home and abroad have carried out a great deal of researches. SONDEX company has developed Capacitance Array Tool in 2002. Xu Wenfeng [1] team has
easy to clean. According to the in-line detection requirements for water holdup of crude oil, in order to obtain the distributing information of water holdup on the cross profile of the oil well, the sensors are required to arrange in an array distributing structure on cross profile of oil wells. In order to realize array detection of water holdup with capacitive method, there are two basic problems must to be solved: (1) Miniaturized the capacitive sensor structure to forming sensor arrays and arrange multiple detection points on the cross section of the oil well; (2) Reducing the influence of the distributed capacitance between the sensor and the detection circuit on the measurement results and channel consistency After analyzing existing domestic and foreign capacitive water holdup tools' design schemes, this paper presents the interdigital capacitive water holdup sensor structure [4], and designs an indirect measurement scheme Based on the conversion between capacitance and frequency.
2. Interdigital Capacitor Based on Plane
Structure
2.1. Sensing Principle
Interdigital capacitance sensor based on plane structure (Figure 1). By placing tow interdigital electrodes on the same plane, the water holdup of the crude oil can be measured by
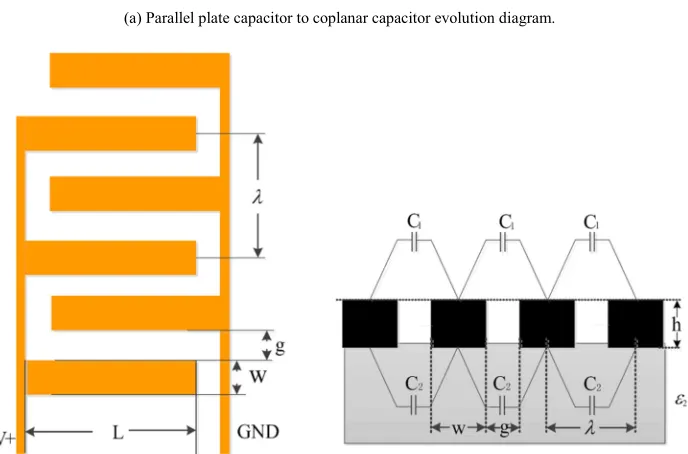
detecting dielectric constant of the oil-water mixture when flowing through the tow electrodes. It comes from the evolution of parallel plate capacitors (Figure 1(a)). Its structure is shown in Figure 1(b) (L is electrode length, w is electrode width, g is the distance between the electrodes,λ is capacitance unit,h is electrode thickness). Similar with the parallel plate capacitor, a stable electric field is formed by the fringe effect between the two electrodes [5-6]. The permittivity of oil and water is very different, different water holdup correspond to different equivalent permittivity of the mixture between electrodes, and the different equivalent permittivity correspond to different capacitance, so we can get the water holdup by measuring the capacitance value. Figure 1 (c) is a sensor's equivalent circuit model, which consists of a resistor and a capacitor in series.
C is the capacitance value [7-9] of unit length of the sensor electrode, therefor: C = Kɛ0ε1+ɛ0ε1h/g+Kɛ0ε2
C = (K + h/g) ɛ0ε1+Kɛ0ε2=K1ɛ0ε1+Kɛ0ε2 (1)
In the formula, K and K1 are constant; ε0 is vacuum
permittivity; ε1 is the equivalent relative permittivity of the
measured medium (pending measure mixture) on the sensor's surface, and the ε2 is the relative permittivity of the plate base
material. The total capacitance value of the sensor is Csen=N *
L * C, and N is the number of the interdigital capacitor.
(a) Parallel plate capacitor to coplanar capacitor evolution diagram.
It is known from Formula (1) that when the physical structure of the capacitor and the permittivity of the plate base material are constant, the capacitance Csen varies with the
dielectric constant of the measured medium. This means that the capacitance value of the capacitor increases monotonously [10] when the water holdup of the oil-water mixture passing through the sensor surface rises, thus realizing the detection of the water holdup of the crude oil.
2.2. The Advantages of This Capacitor Structure
The benefits of this capacitor structure: (1) the planar structure is simple and easy to realize sensor miniaturization design. (2) Maximize the capacitance value on the limited area by interdigital structure, and improve sensor sensitivity. (3) The open plane structure is convenient for cleaning and maintenance.
3. An indirect Measurement Scheme
Based on Capacitance-Frequency
3.1. Detecting Principle
In the conventional capacitive water holdup tool, the output of the sensor and the input of the detection circuit are
connected through the wire. There is a distributed capacitance in the connection wire, the value of which is updating with the change of the environment, causing the error of the measurement results. Besides, due to the difference of each connection wire, that will affect consistency of array tool's each channel. In order to avoid the influence of this distributed capacitance on the measurement results, the most direct way is to integrate sensors and partial detection circuits. Converting the measured capacitance directly to the corresponding frequency change pulse signal at the detection point, and then connecting to the downhole follow-up circuit through the connection wire to isolate or reduce the influence of the distributed capacitance on the connection line to the measured capacitance value. This requires that sensors and frequency conversion circuits be integrated in the detection point. The structure is as simple as possible and the volume is as small as possible.
3.2. The Realization Measurement Scheme
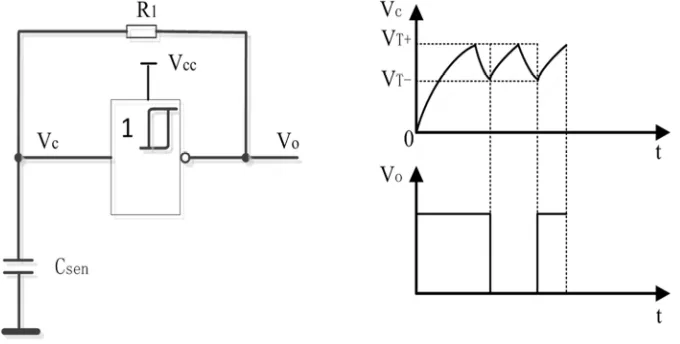
This paper adopts an indirect measurement scheme based on capacitance-frequency conversion, the scheme uses a capacitive sensor and a NAND gate with hysteresis to construct a self-oscillation oscillator to form an integrated sensing and detecting circuit. (Figure 2).
Figure 2. Integrated sensing &detecting circuit and input/output waveform.
This integrated detecting circuit is very simple. It consists of capacitance Csen, Schmidt NAND gate and resistor R1. When Schmidt NAND gate turned on the power, the initial voltage Vc on capacitance Csen is 0. At this time, the output voltage V0 is high level. Capacitance Csen which connected to the ground is charged by the NAND gate output through the resistance R1. When Vc rises to the V+, the input is high level. At the same time, the NAND gate state flipping, and the output V0 is low, the measured capacitor Csen discharge through the R1 to the output terminal, then the voltage on the Csen begin to decline. When the voltage (Vc) of the two sides of the capacitor is reduced to V-, the Inverter input is low, and the V0 is changed from low level to high level, and
the Csen is recharged again. By this cycle, the rectangular wave is obtained at the output of the NAND gate. The waveforms of V0 and Vc are shown in Figure 2 (b). The Csen value is proportional to the charge-and-discharge time. The sum of the charge-and-discharge time is the oscillation period of the circuit. The oscillation period of the circuit is:
ln[( DD T ) T ]
sen
DD T T
V V V T RC
V V V
− +
+ −
−
= •
− (2)
Make the f is the oscillation frequency, so that the relationship between Csen value and the output frequency of the oscillator can be show as follow:
1 1
ln[( ) ]
sen
DD T T
DD T T
C
V V V K R f
f R
V V V
− +
+ −
= =
− • •
• • •
−
(3)
According to formula (3), the Csen value is inversely proportional to the oscillation frequency. By converting the measured capacitance to a pulse signal that is inversely proportional to the frequency, it can avoid the influence of the connecting wires distribution capacitance on the measurement results when the signal is transmitting through connecting wires. The volume of Schmidt NAND gate devices is 5mm * 3mm * 1mm, which is easy to integrate with sensors.
4. Detecting Circuit Based on the
Changed Current of Power
Adopting the above detecting scheme, 3 connecting wires are needed for each sensor. They are power wire, ground wire and signal wire, which added 1 power wire compared with conventional capacitive sensor. As for the 12 array sensors, there are 12 wires added.
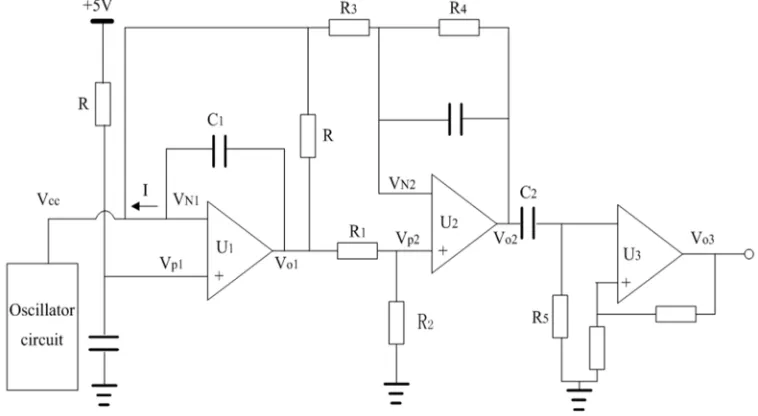
The analysis of the integrated sensing and detecting circuit in Figure 2 (a) shows that when the circuit resonates, the current provided by Vcc will also change periodically. If the current in the power wire could be detected, the signal wire can be omitted, and the multiplexing of power wire and signal wire can be realized. Therefor the conversion circuit which transforms the current change of the constant voltage source to the voltage pulse signal is adopted (Figure 3).
Figure 3. Conversion circuit for current signal – voltage pulse signal conversion circuit.
The whole conversion circuit is divided into 3 stages. The first stage is a current detecting circuit composed of operational amplifier U1, sampling resistor R and oscillating circuit power supply. C1, R and front-end power load constitute a low-pass filter, whose cut-off frequency is greater than 1MHz, which is to filter out high-frequency interference. In the frequency range of the detected signal, C1 is regarded as an open circuit. The non-inverting input terminal of the U1 connects to 5V voltage source, so the inverting input terminal of the U1 is actually a constant voltage source of 5V, the circuit converts the current to the corresponding voltage when the current flows through the sampling resistance R. The second stage is differential amplifier composed of U2, R1, R2, R3 and R4, the negative feedback capacitor connected to the U2 input and the output terminal is used to filter the high frequency interference, and the output Vo2 is equal to the result of Vcc minus Vo1 (the U1 output). The third stage is shaping circuit. The function of C2 is to isolate DC component of front-end circuit. U3 and peripheral resistors constitute hysteresis comparator, which
will output shaping voltage signals. The output signals of U1 and U2 can be expressed as:
1
o cc cc
V =V +I R (4)
2 [ 1 ]
o o cc cc
V =K V −V =I R (5)
According to formula (5), the output of the hysteresis comparator U3 is the same voltage pulse signal as the frequency of the current of power supply in the multivibrator circuit.
5. Experiment and Result
5.1. Experiment
increase the structure of the sensor. But for array detection, it is obvious that the structure of the sensor cannot be too large. On the other hand, the interdigital capacitance sensor can't be too small. If the interdigital surface is too small, the tiny oil beads and water beads attached to the detection surface will cause errors. According to formula (3), the capacitance value Csen of the sensor as well as the resistance R1 determine the frequency range of the output of the multivibrator. In order to increase the stability of the multivibrator and the circuit shown in Figure 3, R1 should use larger value resistance under the condition of ensuring resolution. Because of the high downhole temperature, in order to reduce the influence of the resistance temperature drift on the measurement results, R1 resistance should not be too large, otherwise, it will lead to a low oscillation frequency range and reduce the scanning rate of each channel. Considering the size of the sensor, the range of detecting frequency, the scanning period and the stability of the circuit, the R1 resistance is 820kΩ, the electrode length L is 9mm, the width of the electrode is 1mm,
the polar distance is 0.7mm, the number of interdigital N is 5, and the frequency range is 32 to 67kHz. The oscillating circuit consists of the interdigital capacitance sensor and the Schmidt NAND gate is printed on one glass fiber board, and the insulating material is coated on the electrode and detection circuit. The size of the whole integrated sensor is 40mm * 18mm * 1.5mm, only with ground wire and power wire, which is very suitable for array design.
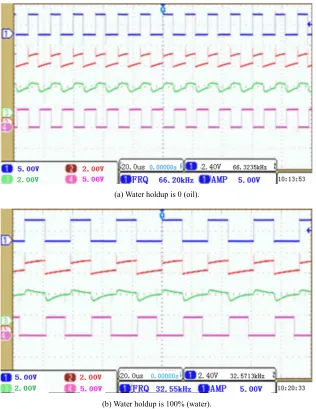
According to the circuit of Figure 3, the waveforms of the detection circuit for extracting current changes from the Schmidt oscillator power line are shown in Figure 4. (yellow is the output of oscillating circuit; blue is integral output Vo1; violet wire is differential output Vo2; green line is comparator output Vo3). Figure 4 (a) is the response of the sensor in pure oil, the output frequency of the oscillating circuit is 66.2kHz. Figure 4 (b) is the response of the sensor in the pure water, the output frequency of the oscillating circuit is 32.5kHz.
(a) Water holdup is 0 (oil).
(b) Water holdup is 100% (water).
Figure 4. Output waveform of the detecting circuit’s test points.
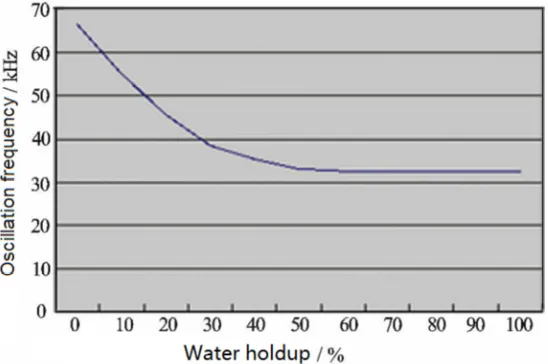
Figure 5. The relationship between water holdup and Oscillation frequency.
5.2. Analysis of Results
The experimental results show that: (1) With the increase of water holdup, the oscillating frequency of the circuit decreases monotonously. (2) With the increase of water holdup of oil and water mixture, the resolution of detecting circuit decreasing. (3) When the water holdup of oil and water mixture increases from 0 to 50%, the output frequency decreases from 66.2kHz to 32.5kHz. When the water holdup of oil and water mixture increases from 50% to 100%, the output frequency decreases from 33kHz to 32.5kHz. The interdigital capacitance sensor has a good resolution when the water holdup is less than 50%. When the water holdup is above 50%, the resolution is low. One of the reasons, as shown in formula (3), is that the oscillation frequency is inversely proportional to the capacitance value (Csen) (dielectric constant), and its derivative (the rate of change) is inversely proportional to the square of the capacitance value (the square of the dielectric constant). The resolution will decrease rapidly with the increase of the dielectric constant (water holdup). The other of the reasons is that the running water and the mineralized water can't be considered as insulator. There is an equivalent resistance at both ends of the capacitor (as shown in Figure 1 (c). When the water holdup is higher than 50%, the water appears continuous phase. The connected water forms connected resistance, which reduces the influence of the change of the capacitance value (permittivity) on the output frequency, resulting in the decline of the resolution.
6. Conclusion
Both theoretical calculation and experimental research show that when the water holdup is less than 50%, the water holdup of the crude oil can be accurately measured through the capacitance edge effect.
In order to improve the resolution of water holdup, the capacitance boundary effect should be maximally utilized. So, Integrated sensor structure should be selected for the design of the sensor, which can be used to achieve the maximum
edge on the limited sensor substrate. The structure is simple and compact, which improves the consistency and stability of sensors, it can be applied not only to the detection of annular fluid profile, but also to the design of horizontal well array imaging tool.
The method adopted in this paper is extremely sensitive to distributed capacitance. Therefore, the front end integrated oscillation circuit is used in this paper, the analog signal is directly converted to the pulse signal at the front of the detector through the oscillating circuit, thus avoiding the interference of distributed capacitance on the signal transmission wires.
Acknowledgements
The authors gratefully acknowledge financial support from the china petroleum science and technology innovation fun (No.2017D-5007-0306)and China major science and technology project(No.2017ZX05019001).
References
[1] Xu Wenfeng and Li Wentao, “A cylindrical capacitance sensor for measuring the water holdup of low yield horizontal wells,” J. Well Logging Technology, vol. 32, pp. 403 - 405, 2008. [2] Zhao Xiaoqiang and Lang Jifeng, “Study on a capacitive
water holdup meter for horizontal well,” J. Instrument technique and sensor, vol. 4, pp. 19 - 21, 2014.
[3] Yu Bao and Yu Jingmin, “Experimental study of water holdup measured by coaxial array capacitance method under low flow,” J. Well Logging Technology, vol. 36, pp. 559 - 563, 2012.
[4] Chetpattananondha K, Tapoanoi T and Phukpattaranonta P, “A Self-calibration Water Level Measurement Using an Interdigital Capacitive Sensor,” J. Sensors and Actuators A: Physical, vol. 209, pp. 175-182, 2014.
[6] Wang Huiling and Li Baosheng. “Electric field simulation analysis of ring capacitive sensor based on edge effect,” J. Transducer and Microsystem Technologies, vol. 33, pp. 31-34, 2014.
[7] Zheng Qiurong and Li Youquan, “Improvement for design formula of interdigital capacitance on high resistance surface” J. Acta Electronica Sinica, vol. 35, pp. 2319-2323, 2007. [8] Aleksandra, Vukovic and Rukavina, “Hand-held Unit for
Liquid-type Recognition Based on Interdigital Capacitor,” J. Measurement, vol. 51, pp. 289-296, 2014.
[9] Ong K G and Grimes C A, “A Resonant Print Circuit Sensor for Remote Query Monitoring of Environmental Parameters” J. Smart Mater & Struct, vol. 9, pp. 421-428, 2000.