Available Online at www.ijpret.com 503
INTERNATIONAL JOURNAL OF PURE AND
APPLIED RESEARCH IN ENGINEERING AND
TECHNOLOGY
A PATH FOR HORIZING YOUR INNOVATIVE WORK
STUDY THE EFFECT OF CONSTRUCTION SEQUENCE ANALYSIS ON R.C.C. FRAMED
STRUCTURE USING STAAD PRO
PRASHANT UMESHKUMAR GAUTAM, DR. U.P. WAGHE
1. PG Student, Yeshwantrao Chavan College of Engineering, Nagpur.
2. Principal & Professor, Department of Civil Engineering, Yeshwantrao Chavan College of Engineering, Nagpur
Accepted Date: 15/03/2016; Published Date: 01/05/2016
\
Abstract:In this paper we have considered a multi-storey residential building (G+15) with different bay width. The building model is situated in seismic zone-IV for seismic parameters we have considered the Indian standard code (IS: 1893-2002) and analyzed it with STAAD Pro. The structure is a reinforced concrete frame with conventional beam slab system. Two cases have been considered for the study and comparison. Whereas in first case the model of building will be analyzed as a whole for the subjected loading and in second case the same model of building will be analyzed with reference to the construction sequence or staged construction for the subjected loading. Finally, a comparative study of axial forces, bending moments, shear forces was done at every storey for full frame model and construction stage model.
Keywords: Conventional analysis, construction sequence analysis, false work load, inspection live
load, sequential gravity load, construction loads.
Corresponding Author: MR. PRASHANT UMESHKUMAR GAUTAM
Access Online On:
www.ijpret.com
How to Cite This Article:
Available Online at www.ijpret.com 504
INTRODUCTION
In conventional analysis or traditional analysis the building structure is analyzed in a single step using linear static analysis method the results obtained are linear in nature but during construction the loads may vary from the loads we have considered at the time of conventional analysis. Such variation in load may affect the serviceability of building. So that building should be analyzed at each stage of construction. The method to perform such analysis is known as construction sequence analysis or stage analysis. In this method the structure is analyzed at each stage of building. The results obtained from construction sequence analysis are different than the results of conventional analysis. Separating the results of earthquake shaking due to sustained loading was an immensely complex problem that required a critical seismological study and materials-based investigation, including evaluation of floor response spectra and contents damage, with an unusually in-depth nonlinear time-dependent analysis phase.[1]
Which is one of the type of construction sequence analysis. Construction sequential analysis is becoming an essential part during analysis as many well recognized analysis software included this facility in their analysis and design package
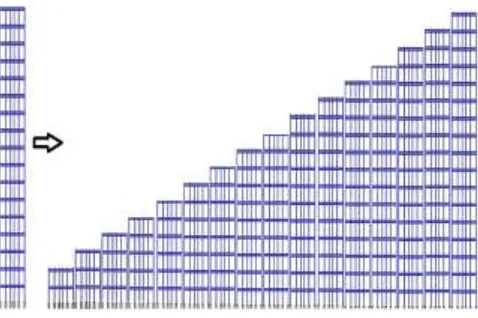
Fig 1.Conventional Vs Construction Sequence[5]
Available Online at www.ijpret.com 505 for the subjected loading by using STAAD Pro software.[3] At last comparison of results for axial load ,moments. displacement from both the cases.
LITERATURE REVIEW
Sr. No. References Evolution Approach
1
Rosenboom O.A., Paret T.F.And Searer G.R (2012)
The detailed approach about the creep and shrinkage formation due to lateral load during construction stages
2
Yousuf Dinar, Munshi Md. Rasel, Muhammad Junaid Absar Chowdhury, Md. Abu Ashraf (2014)
The variation in steel and RCC frames while analyzing with construction sequence analysis.
3
K M Pathan, Sayyad Wajed Ali, Hanzala T Khan, M S Mirza, Mohd Waseem, Shaikh Zubair (2014)
Very good paper and gives detailed about constructional sequence loading pattern as specified in IS 14687:1999 and analysis is done by STAAD Pro.
4 B Sri Harsha & J Vikranth
(2014)
This paper is concluded on the variation of forces due to construction sequence analysis and analyzed structure with Etabs.
5
R. Pranay, I. Yamini Sreevalli, Er. Thota. Suneel Kumar (2015)
The damages come in knowledge while analyzing with construction sequence analysis in this paper analysis is done by Etabs and check the effect on plinth beam.
6 Sagupta R. Amin, S.K.
Mahajan (2015)
Available Online at www.ijpret.com 506
DETAILS OF STRUCTURE
Structure G+15
Beam Size (500 X 500)mm
Column Size (550 X 550)mm
Slab Size 200 mm
Material M25 Fe415
Seismic Zone IV
Importance Factor 1
Frame Type SMRF (R=5)
DESIGN CODES
IS 456:2000 - Code of practice for plain and reinforced concrete[6]
IS 875:1987 (Part 1 ) - Code of practice for design loads (Dead Load)[7]
IS.875:1987 (Part 2 ) - Code of practice for design loads (Live Load)[7]
IS 1893:2002 - Criteria for earthquake resistant design of structures[8]
IS 14687:1999 – False work for concrete structures – guidelines[9]
MODELING OF STRUCTURE
Available Online at www.ijpret.com 507 .
Fig(2) Plan View Building
Various stiffness governing factors such as bay width/length, storey height, etc. are decided as basic parameters. Three frames of G+5 G+10 and G+15 RC buildings of bay width/length 5m, 4m and 3m and storey height 3m were modeled and analyzed with conventional analysis method and by construction sequence analysis method. These models were used for the comparison of responses of various forces in terms of axial forces, bending moments, shear forces and displacements shows the typical floor plan of the models.[3]
LOADING OF STRUCTURE
Conventional Analysis
1) Dead Load(DL)
Self weight of columns and beams
Self weight of dry concrete slab (Density = 25 KN/m3)
Floor Finish = 1 KN/m2(refer IS 456:2000)
2) Live Load(LL)
3 KN/m2 (refer IS 875:1987 Part II)
Available Online at www.ijpret.com 508
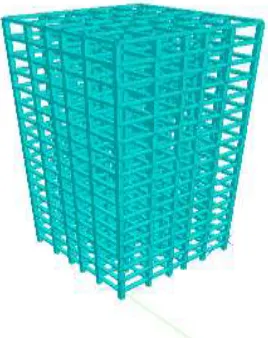
Fig 3- 3-D Model of Whole Building
3) Seismic Load(EQ)
Earthquake Loads and different load combinations as per I.S. 1893-2002 Part II in Earthquake Zone IV considering ductile detailing.
Z 0.24
I 1
R 5
Soil Type II
4) Load Combination
1.2(DL+LL+EQ)
Construction Sequence Analysis
1) Dead Load(DL)
i) Self-weight of columns and beams;
Available Online at www.ijpret.com 509
iii) Self weight of wet concrete slab (freshly poured) Density = 26 KN/m3 (refer IS 14687:1999)
iv) False work dead load 500 N/m2 (refer IS 14687:1999)
2) Live Load(LL)
i) Inspection live load on Constructed floor slab 750 N/m2 (refer IS 14687:1999)
ii) Construction live load on floor slab being constructed [assumed adequate to be equal to inspection live load i.e. 750 N/m2 (refer IS 14687:1999)
Fig 4 - Conventional analysis Vs Construction Sequence Analysis
3) Seismic Load(EQ)
Earthquake Loads and different load combinations as per I.S. 1893-2002 Part II in Earthquake Zone IV considering ductile detailing.
Z 0.24
I 1
R 5
Soil Type II
4) Load Combination
Available Online at www.ijpret.com 510
RESULTS
Maximum Moment
CA G+15 161.693
CSA G+15 186.101
145 150 155 160 165 170 175 180 185 190
K
N
m
Maximum Moment In
Beam (G+15)
0 50 100 150
Outer Middle Inner Middle Outer
Moments Variation in
Selected Beams In Plan
View
Available Online at www.ijpret.com 511 Maximum Axial Load
CA G+15 5971.012
CSA G+15 6051.852
5920 5940 5960 5980 6000 6020 6040 6060
KN
Maximum Axial Load in
Column (G+15)
0 2000 4000 6000 8000
Corner Middle Inner Inner Middle Corner
Axial Load Variation in
Columns Situated
Diagonally in Plan View
Available Online at www.ijpret.com 512 4500
5000 5500 6000
Outer Middle Inner Inner Middle Outer
Axial Load Variation in
Columns Situated
Vertically &
Horizontally in Plan …
CA CSA
62 63 64 65 66 67
G+15
Max Joint Displacement
(G+15)
Available Online at www.ijpret.com 513 0
10 20 30 40 50 60 70
KN
Displacement
CA G+5
CSA G+5
CA G+10
CSA G+10
CA G+15
Available Online at www.ijpret.com 514
DISCUSSION ON RESULTS
While comparing the moments induces in selected beams are observed greater in construction sequence analysis. The graph indicate, in our structure the middle selected beams are showing higher difference in results of construction sequence analysis and conventional analysis.
After observing the results for max axial load on column at different positions of building, obtained higher value of axial load in construction sequence analysis .The graphs shows that the difference in conventional analysis and construction sequence analysis are varying diagonally and perpendicularly and shows higher variation result in mid corner column.
In construction sequence analysis, main area to be observed is displacement and while comparing the results of displacement in conventional analysis and construction sequence analysis, construction sequence analysis gives higher value of displacements and the graph shows the result of floor to floor comparison with respect to joints the results are near about same till the roof to be constructed but at the roof level sudden change in values of displacement are observed. In addition to this as we constructing higher buildings we are getting the difference in values of displacement in conventional analysis and construction sequence analysis are increasing.
0 0.5 1 1.5 2 2.5 3
G+5 G+10 G+15
Available Online at www.ijpret.com 515
CONCLUSION
It is concluded that simulation of sequence of construction in the construction sequence analysis leads to considerable variations in deformations and design loads observed by conventional analysis.
As the height of structure increasing the difference in results of conventional analysis and construction sequence analysis is also increasing.
Therefore it is necessary that for Multi storey building frames the construction sequence effect shall be taken into consideration.
REFERANCES
1. Rosenboom O.A., Paret T.F.And Searer G.R., “Chronological Construction Sequence, Creep,
Shrinkage And Pushover Analysis Of An Iconic 1960s Reinforced Concrete Building” Proceedings 2012, 15th World Conference in Earthquake Engineering, Lisbon.
2. Yousuf Dinar, Munshi Md. Rasel, Muhammad Junaid Absar Chowdhury, Md. Abu Ashraf3;
“Chronological Construction Sequence Effects On Reinforced Concrete And Steel Buildings” The International Journal Of Engineering And Science (IJES); Volume 3; Issue 1; Pages 52-63; 2014 ISSN(e): 2319 – 1813 ISSN(p): 2319 – 1805.
3. K M Pathan, Sayyad Wajed Ali, Hanzala T Khan, M S Mirza, Mohd Waseem, Shaikh Zubair;
“Construction Stage Analysis Of RCC Frames Using Staad Pro”; International Journal of Engineering & Technology Research Volume-2, Issue-3, May-June, 2014, pp. 54-58.
4. B Sri Harsha & J Vikranth; “Study And Comparison Of Contruction Sequence Analysis With
Regular Analysis By Using Etabs”; International Journal Of Research Sciences And Advanced Engineering [IJRSAE]TM Volume 2 , Issue 8, PP: 218 - 227 ,Oct - Dec 2014.
5. .R. Pranay, I. Yamini Sreevalli, Er. Thota. Suneel Kumar,”Study and Comparison of
Construction Sequence Analysis with Conventional Lumped Analysis Using Etabs” PG Student, School of Mechanical and Building Science,VIT Chennai, Chennai-600127, Tamil Nadu.School of Mechanical and Building Science,VIT Chennai, Chennai-600127, Tamil Nadu Design Manager, Shradha Designtech Pvt Ltd, Bangalore.2015
6. Sagupta R. Amin, S.K. Mahajan; ”Analysis of Multi Storied Rcc Building for Construction
Available Online at www.ijpret.com 516
7. IS 456:2000; “Plain And Reinforced Concrete - Code Of Practice”, BIS, New Delhi, 2000.
8. IS 875: 1987 (Part 1 and 2 ); “Code Of Practice For Design Loads (Dead loads and Live loads)
For Buildings And Structures”, BIS, New Delhi, 1987.
9. IS 1893:2002 ; “Criteria For Earthquake Resistant Design Of Structures - Part 1”, BIS, New
Delhi, 2002