Available Online at www.ijpret.com 1169
INTERNATIONAL JOURNAL OF PURE AND
APPLIED RESEARCH IN ENGINEERING AND
TECHNOLOGY
A PATH FOR HORIZING YOUR INNOVATIVE WORK
SUPPORT VECTOR MACHINE BASED BIOMETRIC AUTHENTICATION OF SINGLE
LEAD ELECTROCARDIOGRAM
P S GAWANDE1, S A LADHAKE2
1.Department of Electronics and Telecommunication Engg, Rajarshi Shahu College of Engineering, Buldana, MS, India.
2.SIPNA College of Engineering and Technology Amravati, MS, India.
Accepted Date: 05/03/2015; Published Date: 01/05/2015
\
Abstract:This research is on presenting an approach for person authentication by using single lead ECG signal. The proposed method uses support vector machine to classify the normal subjects. We have recorded data within thirty six months. Ten hybrid features were extracted from the recorded signals by using wavelet transform. In this paper, Support Vector Machine is applied by varying number of epochs up to 1000. The classification performance is evaluated based on percent average classification accuracy and mean squared error. During testing an accuracy of 98.86 percent is achieved and mean squared error is found to be 0.0080.
Keywords: ECG, classification, discrete wavelet transform, support vector machines
Corresponding Author: MR. P. S. GAWANDE
Access Online On:
www.ijpret.com
How to Cite This Article:
Available Online at www.ijpret.com 1170
INTRODUCTION
An important factor which helps in the success of classification is the choice of appropriate machine learning technique. Now a days, security is a major concern. In security systems biometrics can be used to increase the security level. Biometrics is identification of an individual based on the physiological and/or behavioral characteristics [2]. It is highly difficult to do falsification in case of biometric systems. In biometrics different physiological parameters such as fingerprint, palm veins, face recognition, DNA, palm print, hand geometry, iris, retina etc and behavioral parameters such as typing rhythm, gait, signature etc. are used as a biometric treats.
ECG contains wealth of information and it is popularly used as a diagnostic tool by the physicians. The composition mechanism and electrical activity of the human heart inherit uniqueness from the individuality of DNA [3]. Thus, along with all these biometric tools, electrocardiogram can also be used as tool to distinguish the individuals. ECG as a biometrics is first time used by Lena Biel [1]. The advantage of using ECG as a biometric is that ECG checks the aliveness of a person.
The ECG signal varies from person to person due to the differences in position, size, and anatomy of the heart, age, sex, relative body weight, chest configuration and various other factors. However, other than the changes in the rhythm, the morphology of the ECG is generally unaltered [4]. Prior to this, artificial neural network was being used for the classification cardiac arrhythmia, for multi class ECG signal [13].
Related Work
Biel et al.’s (2001) for the first time used fiducial feature extraction algorithm, which demonstrated the feasibility of using ECG signals for human identification. Signals were recorded from 20 subjects of various ages and 30 fiducial features were estimated for each of the 12 leads. Correlation matrix was used to reduce the number of features. Features with a relatively high correlation with other features were removed, finally the numbers of features were reduced to 12. Variance was studied using PCA and finally numbers of features were restricted to 10. This feature set was then applied to for classification. All measurements were done within a time period of six weeks[1].
Available Online at www.ijpret.com 1171
neural network (DBNN) was then formed to strengthen the validation of the resulting identity and an accuracy of 100% is achieved in recognition. Later in 2005 Shen and Tompkin have used correlation analysis and linear regression method for the analysis[5,6].
Yongbo Wan et. al. (2008) used wavelet transform for signal decomposition. Wavelet coefficients were then applied to a 3 layered feed forward neural network to identify human subjects. Multilayer Backpropogation neural network is established for the same. During network design they used 64 neurons in input layer, 128 neurons in hidden layer and one neuron in output layer for identification [7].
Silva et. al. have used Nearest Neighbour and Support Vector Machine produced promising recognition results for data collected with several months apart [8].
Tawfik et. al. (2010) used the coefficients of Discrete Cosine Transform of ECG signal as an input to a neural network classifier. The identification rate of up to 99.09% was achieved when normalized QRS complexes were applied [9].
Data Description
We have recorded data from group of people in the regular interval within the period of 36 months. ECG signals were obtained from 10 clinically normal populations. Six male and 4 female subjects between 5 to 42 years old. All 12-lead electrocardiograms were recorded by two independent operators, one of the readers was physician. Signals were recorded by using ECG recorder “Samvid”, manufactured by Schiller Health Care India Pvt. Ltd. The said recorder is specially made for telemetry system. The signals were transmitted to a PC by using software iECG (version 1.2) via USB cable. The sampling rate of recorder is 500 s/s. Out of the 12 leads recorded, signal from lead-II, a single lead was considered as a signal for raw database. During each recording signal was noted for one minute. Signals were recorded regularly within 15-20 days, for thirty-six months when the subject is in resting condition.
Feature Extraction
Available Online at www.ijpret.com 1172
For remaining seven statistical features the signals were decomposed using wavelet transform. In this study we selected db5 mother wavelet which are similar in shape to the ECG signal and have scaling function similar to ECG signal and the number of decomposition levels were chosen to be 5. The discrete wavelet coefficients of ECG signal were computed using the MATLAB software tool. These coefficients were used to calculate statistical features. The statistical features used were Standard deviation, Entropy, Covariance, Energy, Maximum, Minimum and Mean of the wavelet coefficients in each subband.
Methodology
SVM is new supervised of learning algorithm introduced by Vapnik in 1992 for classification. SVM simultaneously minimize the classification error and maximize the geometric margin hence called maximum margin classifiers. An assumption is made that the larger the margin between these parallel hyperplanes the better is the generalization error of the classifier. Consider the problem of separating the input vectors set belonging to two separate categories
𝑥1, 𝑦1 , 𝑥2, 𝑦2 , 𝑥3, 𝑦3 … … … 𝑥𝑛, 𝑦𝑛 (1)
𝑥𝑛 is n dimensional data. 𝑦𝑖𝜖{±1} , with a hyper-plane 𝑤𝑇𝑥 + 𝛾 = 0. Each point 𝑥𝑖 has a label
𝑦𝑖 to denote which class 𝑥𝑖belongs to; 𝑦𝑖 = +1 if 𝑥𝑖belongs to class 1 and 𝑦𝑖 = –1 if 𝑥𝑖 belongs to
class 2. This is an example of binary classification in which data is classified into two categories, and 𝛾 is bias. If the two categories can be separated by a straight line then the problem is called linearly separable.
One-dimensional data can be divided by using a single point. In two dimensions, a straight line divides the space in half, and in three dimensions, we need a plane to divide the space. We can continue this procedure mathematically to higher dimensions. The general term for a straight line in a high-dimensional space is a hyperplane. The two planes parallel to classifier passing through one or more points in data set are called bounding planes. The distance between these planes is called margin and finding central hyper plane that minimizes this margin is nothing but SVM learning. The points on the bounding planes are called support vectors.
Available Online at www.ijpret.com 1173
decision surface in the feature space, and this allows for non-linear separation in the original space.
RESULTS
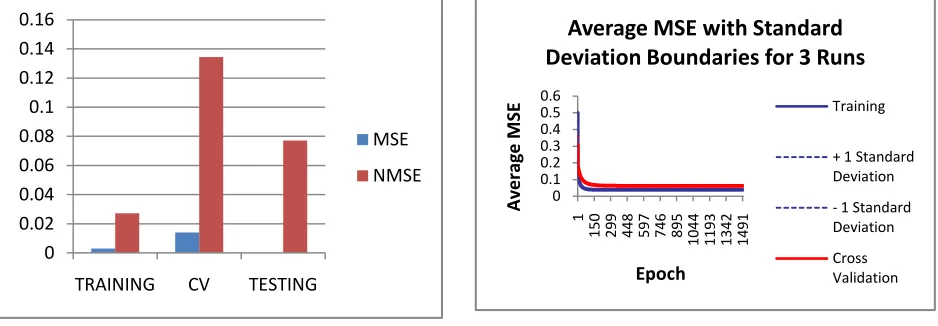
The support vector machine (SVM) is a kind of classifier that is motivated by two concepts. First, transforming data into a high-dimensional space can transform complex problems into simpler problems that can use linear discriminant functions. Second, SVMs are motivated by the concept of training and using only those inputs that are near the decision surface since they provide the most information about the classification. The proposed SVM uses the Kernel Adatron algorithm. This decouples the capacity of the classifier from the input-space and at the same time provides good generalization. This is an ideal combination for classification. Figure 1 shows the MSE and NMSE during training, cross validation and testing session for the input feature set. From figure 2 it is clear that the average MSE is almost constant after 300 epochs.
Figure 1:MSE & NMSE during training, testing and CV
Figure 2: Average MSE versus number of epochs
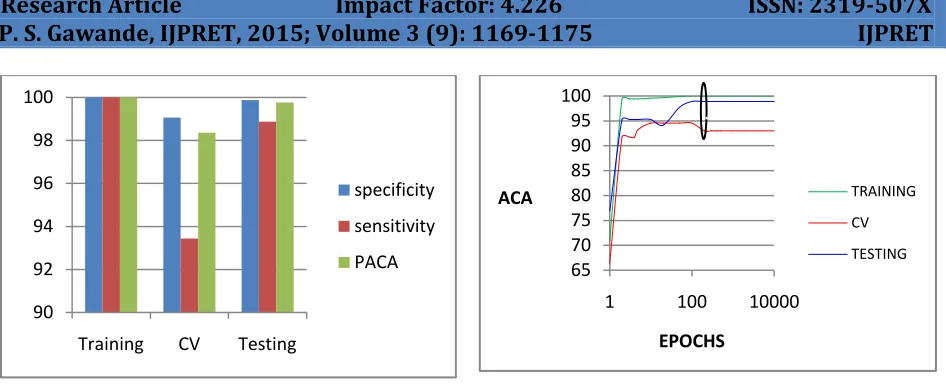
Further the performance classification using SVM is also compared using parameters like specificity, sensitivity and average classification accuracy from figure 3 and 4. During classification specificity is observed as 99.87, sensitivity as 98.86 and the value of percent average classification accuracy (PACA) is noted as 99.76 percent as shown in figure 3. Figure 4 shows graph of PACA versus epochs. The value of PACA is almost constant after 300 epochs. Thus SVM provides better classification of ECG data.
0 0.02 0.04 0.06 0.08 0.1 0.12 0.14 0.16
TRAINING CV TESTING
MSE NMSE 0 0.1 0.2 0.3 0.4 0.5 0.6 1
150 299 448 597 746 895 1044 1193 1342 1491
A ve rag e M SE Epoch
Average MSE with Standard Deviation Boundaries for 3 Runs
Training
+ 1 Standard Deviation
- 1 Standard Deviation
Available Online at www.ijpret.com 1174
Figure 3: Specificity, Sensitivity and PACA during training, CV and testing
Figure 4: Percentage ACA of SVM for hybrid feature input
REFERENCES
1. L. Biel, O. Pettersson, L. Philipson, and P. Wide, “ECG analysis: A new approach in human identification,” IEEE Trans. Instrum. Meas., vol. 50, no. 3, pp. 808–812, Jun. 2001.
2. A. K. Jain, A. Ross, S. Prabhakar, “An introduction to biometric recognition,” IEEE Trans. Circuits. Syst. Video 14(0), 4–20 (2004).
3. Fahim Sufi, Ibrahim Khalil, and JiankunHu, “ECG-Based Authentication,” Handbook of information and Communication Security, Springer 2010.
4. Y. Wang, F. Agrafioti, D. Hatzinakos, K. N. Plataniotis,” Analysis of human electrocardiogram for biometricrecognition,” EURASIP Journal on Advances in Signal Process., Volume2008, 148658 (2008).Steven Bowbrick, Alex N. Borg, ECG Complete, Elsevier Limited, 2006.
5. T. W. Shen,W.J. Tompkins, Y.H. Hu, “One-lead ECG for identity verification”, In Second Joint EMBS/BMES Conference Housten, TX USA (2002) pp. 62–63.
6. T. W. Shen, W. J. Tompkins , “Biometric Statistical Study of One-Lead ECG Features and Body Mass Index (BMI)”, Proceedings of the 2005 IEEE Engineering in Medicine and Biology 27th Annual Conference Shanghai, China, September 1-4, 2005, pp. 1162-1165.
7. Y. Wan and J. Yao, “A neural network to identify human subjects with electrocardiogram signals,” in Proc. World Congress on Engineering and Computer Science, San Francisco, CA, 2008.
90 92 94 96 98 100
Training CV Testing
specificity
sensitivity
PACA 6570
75 80 85 90 95 100
1 100 10000
ACA
EPOCHS
TRAINING
CV
TESTING
Available Online at www.ijpret.com 1175
8. Hugo Placido da Silva, Andre Lourenco, Ana Fred and Anil K. Jain, “Finger ECG Signal for user Authentication: Usability and Performance”, IEEE Sixth International Conference on Biometrics: Theory, Applications and Systems (BTAS), 2013.
9. M. M. Tawfik and H. S. T. Kamal, “Human identification using QT signal and QRS complex of the ECG,” Online J. Electron. Elect. Eng., vol. 3, no. 1, pp. 383–387, 2011.
10.Asutosh Kar and Leena Das, “A Technical Review on Statistical Feature Extraction of ECG signal”, 2nd National Conference- Computing, Communication and Sensor Network CCSN, 2011.
11.M. M. Tawfik and H. S. T. Kamal, “Human identification using QT signal and QRS complex of the ECG,” Online J. Electron. Elect. Eng., vol. 3, no. 1, pp. 383–387, 2011.
12.Zhidong Zhao, Lei Yang , Diandian Chen and Yi Luo, “A Human ECG Identification System Based onEnsemble Empirical Mode Decomposition ”, Sensors 2013.