6152 DEVELOPMENT AND VALIDATION OF METHOD OF ANALYSIS FOR A PROPOSED COMBINATION OF AMOXICILLIN AND IBUPROFEN IN ORAL
DOSAGE FORM USING HPLC
Israa Al-Ani, Ashok Shakya and Samira Hassan
Faculty of Pharmacy, Al-Ahliyya Amman University, Amman, Jordan
*Corresponding author E-mail: [email protected]
ARTICLE INFO ABSTRACT
Key Words
HPLC, Amoxicillin, Ibuprofen
The aim of this work is to develop a simple, validated method of analysis using HPLC to be used to measure amount of amoxicillin (AM) and ibuprofen (IB) simultaneously in oral tablets. The method was developed successfully and gave a very good separation of both compounds. The parameters of validation like linearity, precision, accuracy, system suitability were all within specification of EMA. The method was used in evaluation of drug content and dissolution of amoxicillin and ibuprofen from prepared oro-dispersible tablets contain 100 mg ibuprofen and 125 mg amoxicillin for pediatric use.
INTRODUCTION
Pharmaceutical analysis is a branch of practical chemistry that involves
identification, determination,
quantification and purification of a substance. Also, separation of the components of a solution or mixture, or determination of structure of chemical compounds (El-Yazbiet al., 1999). The substance may be a single compound or a mixture of compounds and it may be in any type of the dosage forms (Kolhe et al.,2013, Kawalec et al., 2018). Pharmaceutical preparations contain different types of substances; this makes accurate measurement especially of API(s) very critical for evaluation of the dosage form (KwonandLee,2010). Analytical determination is based on the measurement of one or more physical, chemical or structural property which is related directly
or indirectly to the amount of constituent present in the sample (Ding et al.,2018, Ren et al.,2012). Pharmaceuticals are chemicals mostly of organic, originwhich have some propertiesto be used in qualitative and quantitative measurement (Akshatha et al., 2018, D'Atriet al.,2018). To select a proper analytical method, some criteria are to be taken in consideration, like ; nature of analyte, concentration range in work, possible interference with other materials, time required for analysis and facilities available (Raza et al.,2017, EMA, 2018). Fixed combination therapy is gaining a lot of attention in pharmaceutical industry (Bell, 2013). It serves many advantages in achieving different therapeutic paradigms (Yogendra et al., 2016) However many challenges are to be overcome, among these evaluation of the
An Elsevier Indexed Journal ISSN-2230-7346
6153
product in minimum time and high level of accuracy (Asciertoand Marincola, 2011). Development of suitable method of analysis to measure double or triple API in a pharmaceutical preparation has been highly developed with the development of technology of analysis (Pal et al., 2013). However, high level of accuracy and precision is always required (Chundawat et al.,2011).
The aim of this work is to develop method of analysis of a combination of amoxicillin (AM) and ibuprofen (IB) to be used in evaluation of a proposed combination of these two API in a pediatric oral dosage form contains 125 mg AM and 100 mg IBas ODT using HPLC and according to the specification of EMA.
METHODS
Materials: HPLC grade solvents, API and all tablet additives were kindly gifted by Hikma® Pharmaceutics and Dar Al-Dawa®Pharmaceutics in Jordan.
Development and validation of HPLC method for analysis of AM and IB: High performance liquid chromatography (HPLC) system was used in development and validation of a method that detect qualitatively and quantitatively both AM and IB concomitantly.An HPLC (Finnigan Surveyor) was used in this study and it composes of the following: ChromQuest software 4.2.34 Solvent delivery systems pump (LC Pump Plus), autosampler Plus, UV-VIS Plus Detector, Hypersil Thermo Electron Corporation, BDS C-18 Column (150 mm x 4.6 mm, 5μm) and computer System, Windows XP, SP3.
Chromatographic conditions and Method parameters: Table (1) below shows the chromatographic conditions and instrument settings. Wavelength was chosen to suit both API(s) after trials.
Preparation of standard solutions: In all preparations, 50 mg of AM and 20 mg of IB were taken in a 100-mL volumetric flask, and about 50 mL diluting solution (mobile phase) was added and sonicated for five minutes to dissolve both properly. Then volume was made up to the mark with the same diluent. This was stock solution. Suitable dilutions by same solvent were made to obtain target concentration for each parameter of validation.
Method validation: The method was validated according to the EMA guideline with respect to linearity and range,
precision (repeatability and
reproducibility, inter-day and intra-day), solution stabilityaccuracy and system suitability (Shabir et al., 2013).
Linearity and range:
Linearity was checked onfive different concentrations within 0.1-0.35 mg/ml for AM and 0.1-0.32 mg/ml for IB of the nominal standard concentration. The linearity of the proposed method was evaluated by using calibration curve to calculate coefficient of correlation, slope, and intercept values. The range of analytical procedure is the intervalbetween upper and lower concentration in the analyte in the sample for which it was demonstrated that the analytical procedures was suitable.
Precision
The precision is used to ascertain analysis repeatability by evaluating number of samples containing known amount of analyte. The precision of the assay was assessed with respect to repeatability and reproducibility. The precision of the
proposed method was checked by
repeatability and system suitability, intra- and inter-day repeatability of responses after replicate injections and expressed as
%RSD (percent relative standard
6154
10samples were analyzed for repeatability and system suitability under same operating conditions and for the same solution. Target concentration was equal to 0.25 mg/ml for AM and 0.20 mg/ml for IB. For inter-day precision a solution of 0.2 mg/ml of AM and 0.16 mg/ml for IB were prepared and readings were taken at time zero and after 24 hours. Intera- day precision was performed over 48 hours using the same concentrations above and all10 samples were analyzed at time zero and 48 hours. Each time 3 replicates were taken and average area under the curve (AUC), standard deviation (SD) and percent relative standard deviation(% RSD) were calculated.
Solution stability: Stability of drugs in diluting solvent and mobile phase was checked by rendering the test solution which contained 25 mg AM +20 mg IB /100 ml in tightly capped vials at room temperature for 48 hours. Dilution 1/100 was made to produce concentrations 0.25 mg/ml AM+0.2 mg/ml IB. Two solutions were prepared, solution 1, the readings were taken at time zero and 24 hours. And for solution 2, readings were taken at time zero, 24 hours and 48 hours. The solutionswere analyzed for both drugs and average AUC, SD and RSD were calculated.
Accuracy: The accuracy of an analytical method expresses the nearness between the expected value and the value found. In the present study, successive analysis (n = 3) for three different concentrations of standard mixture ( 10 mg AM+10 mg IB/100 ml , 20 mg AM +20 mgIB/100 ml and 30 mg AM+ 30 mg IB/100 ml) was carried out to determine the accuracy of the proposed method. Serial dilutions were made to obtain concentrations within the calibration curves. The accuracy was expressed as % recovery of each substance from the prepared concentration.
System suitability: The purpose of the system suitability test is to ensure that the complete testing system, including instruments, reagents, columns, analysts etc., is adequate for the intended analysis. The following parameters are usually determined: theoretical plate count, tailing factors, and reproducibility.Those parameters were determined for each run.
6155 Table 1: Chromatographic conditions
Method parameters
Stationary phase C18,250x4.6 mm 5 mµ(Hypersil) Mobile phase Solution A: buffer pH5
Solution B:Acetonitril (gradient system)
Wavelength 220 nm
Flow rate 1.0 ml/min
Concentration range 0.1-0.35 mg/ml Target concentration 0.25 mg/ml
Diluent Acetonitril: phosphate buffer (50:50)
Injection volume 20 µl
Column oven 25Co
Tray Temperature 15 Co
Table 2: Results of Precision Test of AM Test Target
concentration
Average AUC (n=10)
SD %RSD
Repeatability and system
suitability
0.25 mg/ml 5239250 42934 0.819
Intraday precision
0.2 mg/ml 4246172 4.6661.23 0.91 Inter-day
precision
0.2 mg/ml 4216557 58268.4 1.36
Table 3: Results of Precision Test of IB Test Target
concentration
Average AUC (n=10)
SD %RSD
Repeatability and system
suitability
0.2 mg/ml 9452000 23630 0.25
Intraday precision
0.16 mg/ml 7771187 50512.72 0.65 Inter-day
precision
0.16 mg/ml 7858227 86.440.5 1.1
Table 4: Results of Solution Stability of AM for 24 and 48 Hours at Room Temperature. Ibuprofen (prepared
conc.=0.20mg/ml) Amoxicillin (prepared
conc.=0.25mg/ml)
Solution 2(48 hr) N=3 Solution
1(24 hr) N=3 Solution 2(48
hr) N=3 Solution
1(24 hr) N=3 Solution #
9440202 9411179
5301931 5163841
Average AUC Initial reading (time 0)
9425306 9439237
5227649 5301931
Average AUC (24 or 48 hour reading)
10533 19840
87183 97644
SD
0.112 0.210
1.648 1.866
%RSD
99.7 100.1
101.0 100.6
6156 Table 5: Accuracy Results of AM and IB.
RSD% %
Recovery Amount
recovered(mg) Amount
dissolved (mg) Conc.
prepared AM
0.74 101.2%
10.12 10.00
0.1 mg/ml Solution
1(n=3)
0.85 99.7 %
19.94 20.00
0.2 mg/ml Solution
2(n=3)
1.15 100.6 %
30.18 30.00
0.3 mg/ml Solution
3(n=3) IB
0.97 100.9 %
10.09 10.00
0.1 mg/ml Solution
1(n=3)
1.1 101.5%
20.30 20.00
0.2 mg/ml Solution
2(n=3)
1.3 99.86%
29.958 30.00
0.3 mg/ml Solution
3(n=3)
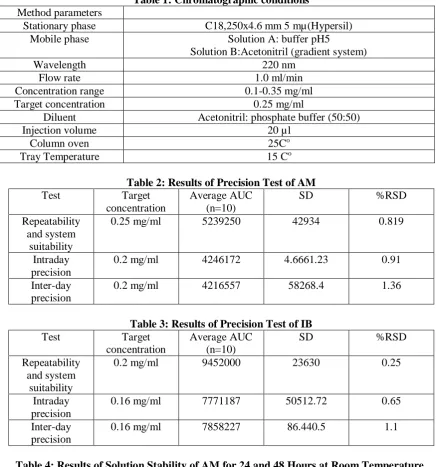
Table 6: Results of System Suitability of AM and IB.
AM
Conc. Retention time (min)
Area Average±SD %RSD Theoretical plates
Tailing factor 0.1 mg/ml 3.2 2602824 2621740±
16508.86
0.63 781968 1.4
3.2 2629156 771130 1.6
3.2 2633241 780500 1.6
0.35mg/ml 3.2 6982715 6971481± 18158.26
0.26 688707 1.4
6981196 685203 1.3
6950532 700923 1.5
IB 0.16 mg/ml 14.6 7781970 7758185± 84359.93
1.08 641935 1.2
14.6 7828099 635780 1.2
14.6 7664486 638283 1.2
0.32 mg/ml 14.7 15020815 14951846± 111104.2
0.74 464371 1.0
14.7 15011045 460833 1.0
14.7 14823678 456227 1.0
6157
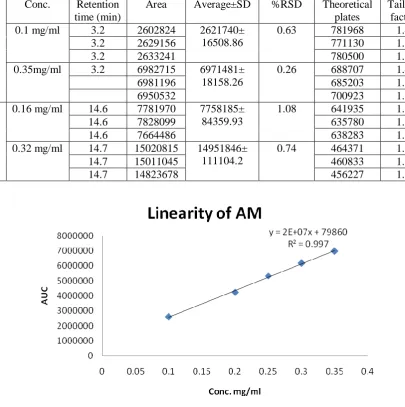
Fig. 2: Calibration curve of AM.
Fig. 3: Chromatogram of standard concentration (0.1 mg/ml AM+0.1 mg/ml)
RESULTS AND DISCUSSION Method validation
Linearity: According to USP, the correlation coefficient (R) for a calibration curve must be >0.995. The correlation coefficient was found to be more than 0.995 for both drugs indicating good linearity of calibration curve. The linearity curves are shown in figure (1) and (2). And chromatograms taken from two samples are shown in figures (1) and(2). Retention time of amoxicillin was equal to 3.2 min. and that of ibuprofen was 14.7 min. the time between the appearance of amoxicillin and ibuprofen was long enough to exclude any interference and overlap between them. The peaks were sharp and clear as shown in figure 1. The range of concentration in all validation
6158 suitability. Retention time, peak area,
theoretical plates and tailing factor of three levels concentration are shown in table 6.
3.2 Evaluation of the optimized formula
Based on the confirmation of the DOE the optimized formula was prepared and it contained the following ingredients per one tablet as ODT: AM 125 mg, IB 100 mg, mannitol 100 mg, aerosil 4 mg, Na stearate 4 mg, Sodium Starch Glycolate43 mg, Avicel 2.8 mg and sucrose 4.7 mg. A batch of 200 tablets was prepared and evaluated using the developed method for drug content and drug dissolution to be used in the production of the tablets. Drug content of both API(s) was equal to 96±5% for AM and 101±3% for IB, and percent drug dissolution at 30 min was equal to 78± 6.5 % for AM and 101±3 % for IB. The method was successful and fast in evaluation the prepared tablets.
CONCLUSION
A simple validated method of analysis was developed to measure amoxicillin and ibuprofen in oro-dispersible tablets contains this combination. The method showed high sensitivity and accuracy according to USP and proved to be practical in the routine evaluation of the proposed combination tablets.
Acknowledgment: The authors would like to thank Smart Labs® in Amman for their kind help in development and validation of the method of analysis. Also, thanks are extended to Hikma®Parmaceutics and Dar Al-Dawa® Pharmaceutics for their kind
support of materials and performing some tests.
REFERENCES:
1. Akshatha HS, Gurupadayya BM, Raikar PP. Validated Method for the Simultaneous Estimation of
Orphenadrine Citrate and
Paracetamol in Tablets by
Simultaneous Equation Method.
Int J Chem tech Res. 2018;11(7): 45-55.
2. Ascierto PA, Marincola FM. Combination therapy: the next opportunity and challenge of medicine. J Transl Med. 2011; 9:115-118.
3. Bell D. Combine and conquer: advantages and disadvantages of fixed‐dose combination therapy. Diab, Obes And Metab.2013; 15(4):291-300.
4. Chundawat RS, Sarangdevot WS, Vyas B, Rathore GS, Rathore US, Sharma P. Analytical method development of montelukeast and
fexofenadine combination
pharmaceutical dosage form by
using HPLC method. Pharm
Methods. 2011; 2(4): 223–228.
5. D'Atri V, Fekete S, Clarke
A, Veuthey JL, Guillarme D.
Recent Advances in
Chromatography for
Pharmaceutical Analysis.Anal Chem. 2018; (in print).
6. Ding X, Yang J, Dong Y.
Advancements in the preparation
of high-performance liquid
chromatographic organic polymer monoliths for the separation of small-molecule drugs. 2018; J Pharm Anal. 2018; 8(2):75-85.
7. El-Yazbi F, Abdine H, Shaalan R.
Spectrophotometric and
spectrofluorometric methods for the assay of lisinopril in single and multicomponent pharmaceutical dosage forms. J Pharm Biom Anal.1999; 19:819-827.
8. Guideline on clinical development of fixed combination medicinal
products/ EMA: on
ents/scientific-guideline/guideline-6159
clinical-development-fixed- combination-medicinal-products-revision-2_en.pdf.
9. Kawalec P, Holko P, Gawin
M, Pilc A. Effectiveness of fixed-dose combination therapy in hypertension: systematic review and meta-analysis. Arch Med Sci. 2018;14(5):1125-1136.
10.Kolhe S, Khose Y, Kale A.
Simultaneous estimation of
Cetirizine hydrochloride,
Phenylpropanolamine
hydrochloride and Paracetamol by RP-HPLC method. Int J of Pharm Life Sci. 2013; 4: 3122-32.
11.Kwon K, Lee C. Analysis of
Fixed-Dose Combination Products
Approved by the US Food and Drug Administration, 2010-2015: Implications for Designing a Regulatory Shortcut to New Drug Application.2016; 51 (1): 111-117.
12.Pal K, BalaramVL, Raju MB. A validated RP-HPLC method for the
simultaneous estimation of
paracetamol and naproxen in bulk and tablet dosage forms. Int J Pharmaceut Anal Res. 2013; 2(4): 184-193.
13.Raza M, Zeid S, Rahman NA.
Analytical techniques in
pharmaceutical analysis: A review. Arab J Chemist. 2017; 10(1): S1409-S1421.
14.Ren W, OngTeng Q, NgSiu T, Weihu CT .Recent Advances in
Chromatography for
Pharmaceutical Analysis. Trends Analyt Chem. 2012; 37: 83-100.
15.Timmerman P, Lowes S, Fast, Garofolo F.Request for Global Harmonization of the Guidance for Bioanalytical Method Validation
and Sample Analysis.
Bioanal.2010; 2(4); 683.
16.Yogendra Kumar
Gupta and Suganthi S.
Ramachandran, Fixed dose drug
combinations: Issues and