ISSN: 1942-9703 / CC BY-NC-ND Abstract—This paper proposes a basic prototype of flood early
warning detection system based on internet of things network. This paper will also explain regarding how the system works (using Arduino and ultrasonic sensor), where the data should be sent (to the cloud server), and who can access the system to get the information about the current water level (involves GSM and GPRS module). The system will give the flood early warning when the water level reaches certain height. The results show that the system was running well, but there are still some drawbacks: less sensitivity of sensor readings (about 20% accuracy) and low responsiveness of GSM and GPRS modules to some commands that effects the Arduino functionality. However, based on our experimental results, this system will be useful as one of solutions in order to reduce the number of flood casualties that might happen in the future.
Index Terms—Early warning detection system, Flood sensor, Internet of Things, Water level, Arduino.
I. INTRODUCTION
LOODSare natural disasters that can happen many times and unpredictable. Many people died and loss of material things. This is confirmed by recent data until the month of November 2016 is declared flood disasters that often occur in Indonesia with 713 incidents and the number of incidents with casualties dead and missing reached 140 people [1]. Take the example of frequent floods in Baleendah region, Bandung District, West Java where two residents of Bandung regency were killed and three others were swept away by floods [2].
One of risk mitigation ways that can be proposed to avoid the catastrophic/detrimental effects of flooding is to build a flood early warning detection system (FEWDS) that can be mounted on a water level monitoring as it has been shown in Ref [3]. Their system uses ultrasonic sensor to do the water measurement and SIM 300C modem to send and receive short message. All data was processed and managed by microcontroller PLCC AT89S51. Their system can also predict the water velocity increase rate and the time of flood.
Manuscript received August 8, 2017. This work is financially supported in part by the Research Institute and Community Service (RICS) of President University through the incentive program for scientific publication.
Joni Welman Simatupang is with Electrical Engineering Study Program of Faculty of Engineering, President University, Cikarang, Bekasi, West Java, 17550, Indonesia. (e-mail: [email protected]).
Faiz Naufal is an alumni of Electrical Engineering Study Program, Faculty of Engineering, President University, Cikarang, Bekasi in July 2017. Currently, he is working with a VIVO smartphone company in Makassar, South Sulawesi (e-mail: [email protected]).
However, we developed the prototype of a water level monitoring system that also uses ultrasonic sensor device to measure the flood waters in real time using Arduino UNO. The information collected is transmitted via SMS based on SIM900 module to the central server (web database), such like a cloud database system in advance.
This paper presents the way how to create a warning detection system using Arduino microcontroller combined with ultrasonic sensors, also GSM (Global System for Mobile) & GPRS (General Packet Radio Service) module where later concerned citizens can find out the latest news about the river water levels in real-time by open the website using their own gadget, called Internet of Things (IoT) network. People can also access directly to the system by sending message to GSM & GPRS in order to find the current water level situation.
The rest of this paper is organized as follows. Section II describes the basic concepts of Internet of Things related to communication model and also literature review. Section III describes the design specification and system implementation. Section IV is dedicated to analyse and discuss the results of the system based on experiments. Section V is conclusion.
II. BASIC CONCEPTS AND LITERATURE REVIEW In this section, this paper starts to describe first the basic concepts of internet of things [4-6], and then will be followed by the literature review [7-11] which shows the different comparison between many FEWDS. We start with some basic concepts of IoT communication models that support the experiments.
A. Internet of Things (IoT) Communications Models
Internet of things (IoT) is the concept of basically connecting any device with an on and off switch to the internet. This includes everything from cell phones to wearable devices and to almost anything else that can think of. From an operational perspective, it is useful to think about how IoT devices connect and communicate in terms of their technical communications models. There are four models of communications:
B. Device to Device Communications
Represent two or more devices that directly connect and communicate between one another, rather than through an intermediary application server. Example: Turn on light command, etc.
C. Device to Cloud Communications
The IoT device connects directly to an internet cloud service like an application service provider to exchange data or control message traffic. Example: Nest Learning Thermostat,
Flood Early Warning Detection System
Prototype Based on IoT Network
Joni Welman Simatupang and Faiz Naufal
the device transmits the data to a cloud database where the data can be used to analyze anything.
D. Device to Gateway Communications
The IoT device connects through an application layer gateway model service as a conduit to reach a cloud service. Example: Smartphone running an application to communicate with a device and relay data to a cloud service (Personal Fitness Trackers), etc.
E. Back End Data Sharing Model Communications
Enables users to export and analyze smart object data from a cloud service in combination with data from other sources.
In the following paragraph, this paper will discuss about some systems that have been built before by other researchers so that we can make such a kind of comparison regarding the strength and weakness of their systems and what makes our system different(the summary comparison is in Table 1)
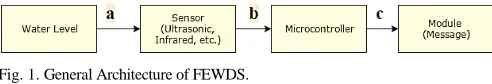
Starting with a very conventional technology that uses buzzer as its alarm then developed using GSM (Global System for Mobile) communications technology as a means of notifications that are sent and received by the monitoring station management. Monitoring station management will store and distribute the data to the people. This is the general flow of early warning detection system as shown in Fig. 1.
(a) Water level will be sensed by the sensor and then (b) the sensor will transmit the data to microcontroller. Microcontroller received, proceed and (c) transmit the data to the module and the module will send the data by message directly to the user.
For example, an experiment conducted by Siva Kumar and his friends [7]. They used PLC as microcontroller for the fiber optic sensor (FOS) which controls the output and input of data from sensors and transmits it to the monitoring station management as programmed. This is also done by S. Izzal and B. Nand [8], emphasizing how users obtain information related flooding via SMS. Their main objective is to be able to read the water level at every second, display it to the supervisor and alert the affected population and relevant authorities by means of an alarm and short message system (SMS) when the level of water surpasses a user defined threshold.
Afterwards, E. Basha and D. Rus [9] in cooperation with Centro Technico San Alonso Rodriguez (CTSAR) mentions a plan to make a flood warning detection system that use sensors and radio frequency. The system consists of four different regimes of operation: sensing, computation, government and office interface, and community interface and also these systems focus on voice communication. River flooding requires information about the state of the river, soil conditions, and meteorological conditions so we measure river level, rainfall, and air temperature at nodes powered by solar panels. In order to minimize failure points, the CTSAR limits the number of computation points, but ensures redundancy at
the same time by using the systems communicating at 144 MHz as computation nodes, providing them with larger microprocessors and more memory. This requires an office with a laptop, some form of storage system, a phone line for the communication, and, while offices tend to have grid power, a reliable backup power system to ensure the office continues to work during the disaster and the community nodes display the river state and prediction. The CTSAR also has a plan to inform a set of city members, elected for this purpose by the community, who then relay the information via centralized radio megaphones to the rest of community. This set of city members will have access to a computer displaying the river state, but most likely will receive individual notification in their homes via a flashing light.
Joel T. de Castro and his colleagues [10] presented discussions on how to create a system that can integrated well and predict what will happen when using a count algorithm. They developed a technology on flash flood warning system using SMS with advanced warning information based on prediction algorithm and use a web based considered as a support to the model because the required real-time data [8]. It is called “future architecture of FEWDS,” as shown in Fig. 2.
Fig. 2. Future development architecture of FEWDS.
(a) Water level will be sensed by the sensor and then (b) the sensor will transmit the data to microcontroller. Microcontroller received, proceed and (c) transmit the data to the module and the module will send the data to cloud server, (d) messgae is put in the website to be accessed by people, while (e) the message is directly sended to the user, and (f) user can also access the cloud server using their gadgets through internet connection.
ISSN: 1942-9703 / CC BY-NC-ND not available. Users can view real-time water condition as well
as the forecasting of the water condition directly from the web via web browser or via WAP and for the emergency situation, the users will get the information through SMS or Email.
As conclusions, from our point of view, the advantages of our prototype compare to others include such as the system can be connected to and input the sensor data into a website (cloud server) where everyone can access to it using their own gadget/smartphone. Users can directly ask the system to get the value of water current level. In [9], they did not use IoT in their system. In [10,11], they need a high price to make and
implemented their system. This applies also for other three references [7-9]. For accuracy, the researcher use an equation to enhance their system accuracy [8]. This applies also for other four references. For strength of hardware [10], they did not mention clearly about this parameter (so that it cannot be concluded), but this was mentioned also in other four references. The last, for security and safety that was stated in reference [7], their system need to be improved to give preventive activity from the other people who do not have an enough responsibility. The summary of above comparison is shown in the Table 1 below.
TABLE 1.
COMPARISON PARAMETERS BETWEEN DIFFERENT FEWDS
Parameters
Elizabeth Basha and Daniela Rus
[9]
Jirapon Sunkpho &
Chaiwat Ootamakorn
[11]
Sheikh Izza Azid and Bibhya Nand
Sharma [8]
Joel T. de Castro, et al.
[10]
Siva Kumar et al. [7]
This Work
IOT
Implementation No Yes No Yes No Yes
Price Low-cost High-cost Low-cost High-cost Low-cost Low-cost
Accuracy Good Good Very Good Very Good Good Good
The strength of
hardware Moderate High Moderate NA Moderate Moderate
Security and
Safety High Less Less Moderate Less Less
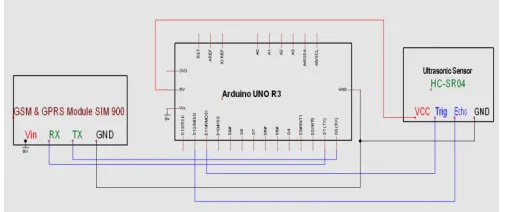
III. DESIGN SPECIFICATION AND IMPLEMENTATION The design of the project is categorized into two classes: hardware and software. There are three important hardware devices that can be introduced. First is Arduino UNOR3, used as the microcontroller of the whole system that receives input signals from ultraso nic sensor [HC-SR04], process it, and t h e n send t h e output signal to GSM & GPRS module [SIM 900]. Schematic diagram is shown in Fig. 3.
Fig. 3. Schematic diagram of the device prototype.
Second is ultrasonic sensor, which is used to measure the current water level inside water reservoirs. In order to know the condition of water level, ultrasonic sensor measures the range from the position of the sensor to the water surface. Using the concept of device to cloud communication which has a meaning that IoT device connects directly to an internet cloud service like website or webserver to exchange and control the data using their own gadget with internet access mode on. In this case, GSM & GPRS module (the third device) as IoT device will get the data from Arduino, send the data into a website which have been prepared and it will send the message for certain level of water to certain number that have been programmed before. The other feature is people can know the condition of water level by sending message with the format which has been determined before to GSM & GPRS module and the people will receive the current water level number.
A. Arduino UNO R3
for this project. Besides, finding Arduino UNO in market is easier than any other Arduino products, since Arduino UNO is the most well-known product of Arduino manufacturer. The picture of Arduino UNO R3 is shown in Fig. 4.
Fig. 4. Arduino UNO R3 development board [12].
B. Ultrasonic sensor HC-SR04
HC-SR04 is a distance measuring sensor module with its range distance measurement 2-500 cm. This sensor has transmitter and receiver which can transmit 40 KHz ultrasonic signal and receives it back after reflected by an object. Ultrasonic sensor is interfaced with microcontroller to measure the range from the sensor to water surface. The circuit implementation of the ultrasonic sensor is shown in Fig. 5. The trigger pin fro m ultrasonic sensor is connected to port 12. Arduino sends high voltage “1” for 10 microseconds via this pin to trigger the ultrasonic wave comes out from the transducer. The receiver will receive the echo from object and send the signal to microcontroller via echo pin 1. The ultrasonic sensor is positioned above the water reservoir to measure the water level.
Fig. 5. Block diagram of ultrasonic sensor of HC-SR04.
C. GSM & GPRS Module SIM900
High quality GPRS Shield is based on SIM900 module from SIMCOM and compatible with Arduino and its clones. The GPRS Shield provides you a way to communicate using the GSM cell phone network. The shield allows you to achieve SMS, MMS, GPRS and Audio via UART by sending AT commands (GSM 07.07 ,07.05 and SIMCOM enhanced AT Commands). The shield also has the 12 GPIOs, 2 PWMs and an ADC of the SIM900 module (2V8 logic) present on board. GSM & GPRS module interfaced with microcontroller to send the data to website and the message to people. The
circuit implemention of GSM & GPRS module is shown in Fig. 6. Microcontroller get and process the data which have been measure by ultrasonic and sent it to SIM 900. SIM 900 received the data and directly sent the data to website by GPRS signal and people by message.
Fig. 6. Fig. 6. Circuit implementation of Module SIM 900.
IV. EXPERIMENTAL RESULTS AND DISCUSSION
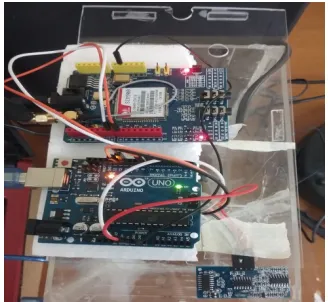
The circuit packaging was done succesfully. Figure 7 shows the top view, while Fig. 8 shows the front view of the proposed device prototype.
Fig. 7. Top view of the proposed flood sensor prototype.
Fig. 8. Front view of the proposed flood sensor prototype.
ISSN: 1942-9703 / CC BY-NC-ND was not included in the system, but the system still can
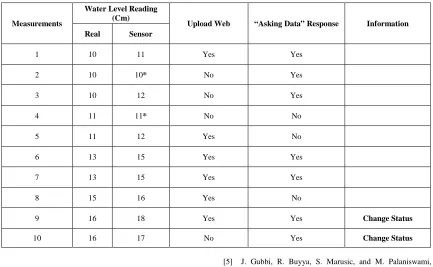
perform smoothly, like when delivers the measurement results of water level into website through GPRS signal. Also, when sending the message about the currently water level to the people who asks to know by sending the format message to GSM & GPRS module through GSM signal. When the sensor ultrasonic senses the level of water in water reservoir, the GSM & GPRS module send the data into the website and in the same loop it sends the status message into the registered number in the system. Using this sensor device, anybody can also directly send the message into the GSM & GPRS module by the format message which given “Asking Data” and the system will replying with the new data of current water level as it is displayed in Table 3 and Table 4 below.
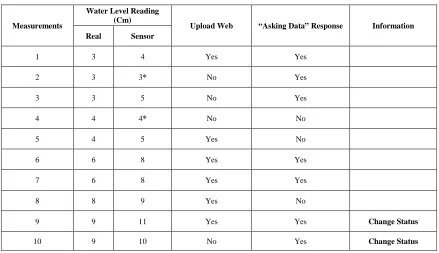
Measurements have been performed 10 times for each status condition of the water level in the water reservoir. Two examples of measurement results are provided for status “SAFE” and status “ALERT” as shown in Table 3 and Table 4, respectively. Parameter that was used as quality indicator of measurements is the difference in water level readings by the sensor with the real situation in the water reservoir. From both tables we can observe that only 2(*) out of 10 measurements are coherent (the same reading between the real and sensor measurements). It means that the highest accuracy of the sensor reading is about 20%. It is such a drawback of this
prototype that could be improved in the future research. Another determined factor is how GSM & GPRS module transmit the data to the website and respond to the incoming messages in accordance with the format as programmed. It can be concluded that the system is running well, but there are still many things need to be improved, for example the less sensitive sensor readings and also the less responsiveness of GSM & GPRS module to some commands that makes Arduino cuts the command.
A range – status explanation that is determined in the system can be seen in Table 2.
TABLE 2.
RANGE-STATUS EXPLANATION
TABLE 3.
EXPERIMENTAL RESULTS for STATUS “SAFE”
Measurements
Water Level Reading (Cm)
Upload Web “Asking Data” Response Information Real Sensor
1 3 4 Yes Yes
2 3 3* No Yes
3 3 5 No Yes
4 4 4* No No
5 4 5 Yes No
6 6 8 Yes Yes
7 6 8 Yes Yes
8 8 9 Yes No
9 9 11 Yes Yes Change Status
10 9 10 No Yes Change Status
Status Distance (Cm)
SAFE 0 – 9
ALERT 10 – 15
STANDBY 16 – 19
TABLE 4.
EXPERIMENTAL RESULTS for STATUS “ALERT”
Measurements
Water Level Reading (Cm)
Upload Web “Asking Data” Response Information Real Sensor
1 10 11 Yes Yes
2 10 10* No Yes
3 10 12 No Yes
4 11 11* No No
5 11 12 Yes No
6 13 15 Yes Yes
7 13 15 Yes Yes
8 15 16 Yes No
9 16 18 Yes Yes Change Status
10 16 17 No Yes Change Status
V. CONCLUSION
In this paper, an implementation of Internet of Things (IoT) network for flood early warning detection system has been described. The device prototype achieves the objective of this project by having the following abilities, such as: first, the system is able to conduct and record the data frequently and post it into a website by received the sensing data from ultrasonic sensor and delivered it through GSM & GPRS module. Second, the system is able to reply the direct message from anybody who has interest in asking/knowing the condition of current water level. From experimental results, it is concluded that this system will be useful as one of solutions that could be implemented in order to reduce the number of flood casualties that might happen in the near future.
Some developments can be made to improve the system in the future, such as enhancing the reliability of the signal by adding some modules to the system which can make the system more stable and secure (Ex: Ethernet shield, etc.). Also the better results will be provided by using the more accurate ultrasonic sensor. It is more advised if the sensor has two in one transducer (transmitter and receiver in only one transducer, not separated) to make it able to measure the water level of reservoir with smaller diameter.
REFERENCES
[1] http://www.antaranews.com/en/news/103706/bandung-floods considered-worst-in-10-years.[Internet access on 16 July 2017] [2]
http://news.detik.com/berita/3163487/banjir-landa-kabupaten-bandung-2-orang-tewas-dan-3-hilang. [Internet access on 16 July 2017]
[3] E. Kuantama and M.A. Saraswati, “Water Level Measurement and Preflood Warning System with SMS Method,” Internetworking Indonesia Journal, Vol. 7, No. 2, 2015, pp. 3-7.
[4] K. Rose, S. Eldridge, and L. Chapin, “The Internet of Things: An Overview: Understanding the Issues and Challenges of a More Connected World,” www.internetsociety.org, October 2015.
[5] J. Gubbi, R. Buyya, S. Marusic, and M. Palaniswami, “Internet of Things (IoT): A vision, architectural elements, and future directions,”
Future Generation Computer Systems, vol. 29, 2013, pp. 1645–1660. [6] “Internet of Things-From Research and Innovation to Market
Deployment,” Editors: Ovidiu Vermesan (SINTEF, Norway) and Peter Friess (EU, Belgium), Rivers Publishers, Denmark, 2014.
[7] S.K. Subraniam, V.R. Gannapathy, S. Subramonian and A.H. Hamidon, “Flood level indicator and risk warning system for remote location monitoring using Flood Observatory System,” WSEAS TRANSACTIONS on SYSTEMS and CONTROL, Issue 3, Volume 5, March 2010.
[8] S.I. Azid, and B.N. Sharma, “SMS Based Flood Level Monitoring System,” Suva Fiji, Faculty of Science Technology and Environment, The University of South Pacific.
[9] E.A. Basha, S. Ravela, and D. Rus,“Model-Based Monitoring for Early Warning Flood Detection,” SenSys’08, November 5–7, 2008, Raleigh, North Carolina, USA.
[10] J.T. de Castro, G.M. Salistre Jr, Y.-C. Byun, and B.D. Gerardo, “Flash Flood Prediction Model Based on Multiple Regression Analysis for Decision Support System,” Proceedings of the World Congress on Engineering and Computer Science 2013 Vol II, WCECS 2013, 23-25 October, 2013, San Francisco, USA.
[11] J. Sunkpho and C. Ootamakorn, “Real-time flood monitoring and warning system,” Songklanakarin J. Sci. Technol., vol. 33, no. 2, Mar-Apr. 2011, pp. 227-235.
[12] A. Kadir, Buku Pintar Pemrograman Arduino, Yogayakarta: MediaKom Indonesia, 2014.
Joni Welman Simatupang received B.Sc in Electrical Engineering from University of Indonesia (UI) in 2003. In 2014, he finished his Ph.D from National Taiwan University of Science and Technology (NTUST), Taipei, Taiwan. Currently, he is a faculty lecturer of Electrical Engineering Study Program of President University, Cikarang, Bekasi - West Java, Indonesia. His research interests are bidirectional WDM-PONs, biophotonics, light emitting diodes (LEDs), fiber optic sensors (FOS), power electronics, and internet of things (IoT) network. He is a member of IEEE.