Available online at www.JGTPS.com
Research Article
ISSN:2230-7346
Journal of Global Trends in Pharmaceutical Sciences
Vol.3, Issue 3, pp-714-722, July–September 2012
DEVELOPMENT AND VALIDATION OF ANALYTICAL METHODS FOR THE ESTIMATION OF MEDICINAL COMPOUNDS HAVING
HYDROXYL GROUP
PHANI KUMAR.A*1, B.ANBARASI1, E. VENKATA RAMAYYA2
1. Department of Pharmaceutical Analysis, JKKMMRF College of Pharmacy,
Kumarapalayam, Tamil Nadu, INDIA.
2. Department of Pharmaceutical Analysis, JSS College of Pharmacy,
Mysore, Karnataka, INDIA.
*Corresponding Author E-mail:[email protected]
ABSTRACT
A Simple, Rapid, Reliable, Precise, Linear method was developed and validated for the estimation of medicinal compounds having Hydroxyl group. Hydroxyl group present in any drug molecule offer development of number of spectroscopic methods. Hydroxyl group renders sufficient polarity to the molecule. The work deals with development and validation of four UV-Visible spectrophotometric methods by NBS as a chromogenic reagent, four UV-Visible spectrophotometric methods by FeCl3as reducing reagent in bulk and pharmaceutical
dosage form. RP-HPLC method was developed and validated for the estimation of carvedilol in bulk and pharmaceutical dosage forms. All the methods were found to be linear, precise, accurate, specific and all proved to be sensitive, convenient and effective for the determination of carvedilol, lumefantrine, alendronate sodium and simvastatin in bulk and pharmaceutical dosage forms.
Key Words:Hydroxyl group, NBS reagent, RP-HPLC, Carvedilol.
INTRODUCTION: 1. Materials Used
1.1 Preparation of Mobile phase
The mobile phase was prepared by filtered and degassed mixture of formic acid, acetonitrile and water in the ratio of 1:45:55.
1.2 Instrument Specification:
HPLC : LC 2010
SHIMADZU AHT.
Software :LC Solutions
Phani Kumar et al/JGTPS/Volume 3, Issue 3 2012 Page715
Preparation of standard solution:
Accurately weighed 10.0 mg of carvedilol (bulk drug) was dissolved in 5.0 ml of mobile phase in 10 ml volumetric flask and sonicated for five minutes until it dissolves the material and the volume was made up with mobile phase. From this 1.0 ml of solution was taken and diluted to 10 ml (stock solution). Solution was filtered through 0.45 µm filter paper.
Preparation of sample solution:
Twenty carvedilol tablets were taken and finely powdered. The accurate quantity of powder equivalent to 10.0 mg of active ingredient was dissolved in 50.0 ml of mobile phase and sonicated for about 10.0 min with occasional shaking by maintaining sonicator bath temperature below 28
0C. The solution was cooled and the
volume was made up with the mobile phase in 100 ml volumetric flask. From this 2.0 ml was taken and diluted to 10 ml and filtered through 0.45 µm filter paper.
Preparation of calibration curve:
Aliquots of carvedilol ranging from 1.7 – 2.1 ml were pipetted into as series of 10 ml volumetric flask and diluted to the mark with mobile phase. The linearity range of carvedilol was found to be 17.0 – 21.0 µg/ml. The calibration curve was constructed by
plotting peak area against
concentration. The column was
equilibrated for at least 30 min, with the mobile phase flowing through the system with a flow rate of 0.5 ml/min. Detector was set at a wavelength of 280 nm. First, blank injection was given to show mobile phase does not
account for any impurities. Six
standard drug solutions were prepared as per the procedure mentioned in the preparation of calibration curve and injected in to the column in order to establish the linearity. The sample
solution prepared as per the procedure mentioned above and was injected in order to know the percentage purity.
UV-Visible Spectrophotometric Methods the Estimation of
carvedilol, lumefantrine, alendronate sodium and simvastatin by NBS in Bulk and Pharmaceutical
Dosage Form1-4
Carvedilol, lumefantrine,
alendronate sodium and simvastatin are having hydroxyl group at different positions. An attempt has been made to determine these drugs by reacting hydroxyl group with NBS. The
reaction involves oxidation of
hydroxyl group. Here NBS acts as an oxidizing agent which oxidizes the drugs. Residual NBS reacts with methyl orange, when fixed amount of methyl orange was added it reacts with decreasing amount of NBS, a constant increase in the dye concentration occurred. As a results absorbance increases linearly.
MATERIALS USED
NBS Solution (90 µg/ml): 9.0 mg of NBS was weighed, dissolved in distilled water in 100 ml volumetric flask and volume was made up to mark with distilled water. The solution was freshly prepared and protected from light during the use.
Hydrochloric acid (1.0M):
8.5 ml of concentrated
hydrochloric acid was measured and transferred into a 100.0 ml volumetric flask and made up to the mark with distilled water.
Methyl orange solution (50.0 µg/ml)
Preparation of standard stock solution:
Accurately weighed 10.0 mg of
carvedilol, lumefantrine and
simvastatin (bulk drugs) were
dissolved in 40.0 ml of methanol and alendronate sodium was dissolved in 40 ml of double distilled water in 100 ml volumetric flask and sonicated for about 15 min to enhance the solubility and volume was made up to the mark with methanol and double distilled water respectively to obtain a final concentration of 100 µg/ml (Stock solution).
ANALYSIS OF TABLET DOSAGE FORM:
Ten Carvedilol (Carlac 25 mg),
lumefantrine, alendronate sodium
(Denfos 35 mg) and simvastatin tablets (Simvas 10 mg) were taken and finely powdered separately.
The accurate quantity of powder equivalent to 10 mg of active ingredient was dissolved in distilled water and then passed through the whatman filter paper, followed by adding double distilled water up to 100.0 ml to get the stock solution of 100 µg/ml.
From the 100.0 ml solution 0.4 ml, 0.6 ml, 1.2 ml and 4.0 ml solutions of Carvedilol, alendronate sodium and simvastatin respectively were pipetted into a 10.0 ml volumetric flask and then the resultant solutions were also analysed as per the procedure described under calibration graph.
Preparation of calibration curve:
Aliquots of Carvedilol,
lumefantrine, alendronate sodium and simvastatin ranging from 0.1 – 0.5 ml, 0.2 – 1.0 ml, 0.6 – 1.8 and 2.0 – 6.0 ml respectively were pipetted into as series of 10 ml volumetric flask from above stock solution. To each flask, 1.5 ml of 1.0 M hydrochloric acid followed by 1.0 ml of NBS solutions were added and diluted to volume with distilled water.
The reaction was allowed to proceed at room temperature. The flasks were stoppered and allowed to stand for 20 min with occasional shaking. Finally, 1.0 ml of methyl orange solution was added to each flask, volumes diluted to the mark with distilled water. The absorption spectra
of Carvedilol, lumefantrine,
alendronate sodium and simvastatin were taken at 508 nm respectively (Fig.4-7).
Phani Kumar et al/JGTPS/Volume 3, Issue 3 2012 Page717
RESULTS AND DISCUSSION:
Table No.1: Optical characteristics for RP HPLC Method for carvedilol
PARAMETER Carvedilol
Wavelength (nm) 280
Linearity range (μg/ml) 17 – 21
Correlation coefficient (R) 0.998
Regression equation (y) y = 65823x + 3742
Slope, b 65823
Intercept, c 3742
Relative standard deviation 0.00013
Limit of detection (g/ml) 6.5 x 10⁻⁵
Limit of quantification (g/ml) 1.98 x 10⁻⁴
Table No.2: System suitability parameters for Carvedilol
Parameter Result
Retention time (min) 5.38
Tailing factor 1.331
Theoretical plates 3641.236
HETP 41.195
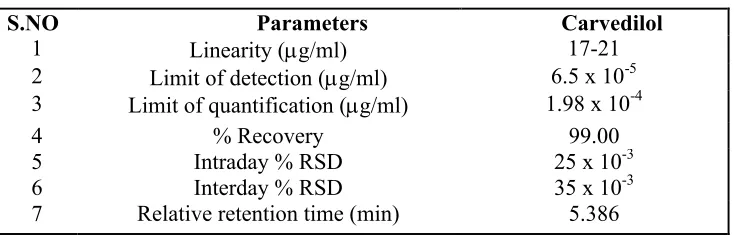
Table No.3: Validation Parameters of Carvedilol
S.NO Parameters Carvedilol
1 Linearity (g/ml) 17-21
2 Limit of detection (g/ml) 6.5 x 10⁻⁵
3 Limit of quantification (g/ml) 1.98 x 10⁻⁴
4 % Recovery 99.00
5 Intraday % RSD 25 x 10-3
6 Interday % RSD 35 x 10-3
1000000 1200000 1400000 1600000
15
P
ea
k
ar
ea
Table No.4: Optical characters of Carvedilol,
Sodium and Simvastatin for NBS method
Graph 1: Calibration graph of carvedilol
Graph 2:
S.NO Parameter
1 Limit of detection (g/ml)
2 Limit of quantification (g/ml)
3 % Recovery
4 Intraday % RSD
5 Interday % RSD
6 SEM
20
carvedilol
Concentration
Optical characters of Carvedilol, Lumefantrine, Alendronate odium and Simvastatin for NBS method
Graph 1: Calibration graph of carvedilol
Graph 2: Standard graph of Carvedilol standard
Carvedilol Lumefantrine Alendronate sodium
g/ml) 0.0200 0.060 0.10423
g/ml) 0.0606 0.183 0.34744
98.06 97.9 99.36
0.35 0.65 0.37
0.76 0.71 0.47
0.0004282 0.0005774 0.0006687
25
Lumefantrine, Alendronate
Alendronate
sodium Simvastatin
0.10423 0.325
0.34744 1.083
99.36 98.66
0.37 0.30
0.47 0.53
Phani Kumar et al/JGTPS/Volume 3, Issue 3 2012 Page719 0
0.2 0.4 0.6 0.8
0 100 200 300 400 500 600 700
Carvedilol
A
bs
or
ba
nc
e
wave length (nm)
0 0.1 0.2 0.3 0.4 0.5
0 100 200 300 400 500 600 700
Lumefantrine
A
bs
or
ba
nc
e
wave length (nm)
0 0.1 0.2 0.3 0.4 0.5 0.6 0.7
0 100 200 300 400 500 600 700 800 Alendronate sodium
wave length (nm)
A
bs
or
ba
nc
e
Graph 3: Absorption spectra of NBS with carvedilol against the reagent blank at 508 nm
Graph 4: Absorption spectra of NBS with lumefantrine against the reagent blank at 508 nm
0 0.2 0.4 0.6 0.8 1
0 100
A
bs
or
ba
nc
e
0 0.2 0.4 0.6 0.8 1
0 1
A
bs
or
ba
nc
e
0 0.2 0.4 0.6 0.8 1
0 2
Graph 6: Absorption spectra of NBS with simvastatin against the reagent blank
Graph 7:
Graph 8:
200 300 400 500 600
Simvastatin
wave length (nm)
2 3 4 5
carvedilol
Concentration (g/ml)
4 6 8 10
lumefantrine
Absorption spectra of NBS with simvastatin against the reagent blank at 508 nm
Graph 7: Calibration graph of carvedilol by NBS
Graph 8: Calibration graph of lumefantrine by NBS
700
6
12
Phani Kumar et al/JGTPS/Volume 3, Issue 3 2012 Page721
Validation parameters by NBS method for selected drugs
SUMMARY AND CONCLUSION:
In the current project work attempts were made to develop
simple spectrophotometric and
chromatographic methods for selected drugs. The hydroxyl group present in
the selected drugs (carvedilol,
lumefantrine, alendronate sodium and
simvastatin) was exploited for
development of spectrophotometric methods. The hydroxyl group was oxidised with many oxidising agents and best results were seen on oxidising the drugs with N- bromo succinamide and ferric chloride. Also, RP HPLC method was developed for quantitative estimation of carvedilol.
It explains the methodology of HPLC. It briefly explains about instrument specifications, selection of mobile phase, reagents and materials used, and their optimization followed
by validation of developed method following ICH guidelines and also gives information regarding the spectrophotometric methods developed
for Carvedilol, Lumefantrine,
Alendronate sodium and Simvastatin using NBS reagent. The selected drugs possess hydroxyl groups at different positions. The hydroxyl group of the drug reacts with NBS reagent and get oxidized and residual NBS reacts with methyl orange and produces colored
product which is determined
spectrophotometrically. All the
methods were found to be linear, precise, accurate, specific and all proved to be sensitive, convenient and effective for the determination of carvedilol, lumefantrine, alendronate sodium and simvastatin in bulk and pharmaceutical dosage forms.
S.NO Parameter Carvedilol Lumefantrine Alendronate
Sodium Simvastatin
1 λmax(nm) 508 508 508 508
2 Beers law limits
(µg/ml) 1-5 2-10 6-18 20-60
3 Molar absorptivity
(litre /mol/cm)
0.08536 0.05236 0.0143052 5.2111 x 10⁻³
4 Correlation coefficient 0.997 0.996 0.999 0.998
5 Sandell’s sensitivity
(g/ml 0.001 abs unit)
4.7619 x 10⁻³ 0.0101 0.02272 0.08032
6 Regression equation Y=0.173x+0.
0017 Y=0.077x+0.01 Y=0.047x+0.009 Y=0.012x+0.008
7 Slope, b 0.0173 0.077 0.047 0.012
8 Intercept, a 0.017 0.016 0.009 0.008
9 Relative standard deviation
REFERENCES:
1. Reynolds JEF. Martindale- The Extra Pharmacopoeia. 28th Edn.
The Pharmaceutical Press.
London. 198.
2. David Watson G.
Pharmaceutical analysis.
Harcourt Publishers Ltd. UK. 2000.
3. Ashutosh Kar. Pharmaceutical analysis.1st Edn. Vol. 1. CBS Publishers and Distributers. New Delhi. 2007.
4. John A. Adamoules.
Chromatographic analysis of
pharmaceuticals. Marcel
Dekker. Inc. New York. 1990.
5. Raymond Scott PW. Gas
Chromatography. Library 4 Science. UK. 2003.
6. Riley CM and Rosanske TW. Development and validation of analytical Methods. Elsevier.