Electronic Health Care Monitoring System (EHCMS)
Musab Nur-Elhuda Mohammed*, Faisal Mohammed Abd-Allah
Dept. Computer Science, Karary University, Khrtoum, Sudan
Abstract
We have developed offline & a real-time algorithms for detection of Q,R,S wave of ECG & PPG signals, monitoring patient continousley by doctor and rapidly increase of patient full health care (EHCMS) and suggest precautions to the patient before entering critical case, and classification of some disease that is faced patient depend on vital signs that is capturing from patient like bradycardia and tachycardia by analysis of Q,R,S wave, this work is part of M.I.C.U.Keywords
Q,R,S wave, EHCMS electronic health care monitoring system, Vital signs, PPG photoplethysmograph, Bradycardia, Tachycardia, M.I.C.U mobile intensive care unit1. Introduction
An electrocardiogram, also called ECG or EKG, reflects the electrical activity of the heart. Every heart contraction produces an electrical impulse that is caught by electrodes placed in the skin, This paper proposed a system that is work in two way: Firstly designed HW device to capturing data from patient using arduino microcontroller and PPG sensor and draw ppg. Secondly analysis and processing of that data capturing to determine if this patient normal or abnormal [1]. Thirdly work offline of ECG data to analysis of it. Finally detection and classification.
Furthermore (1) To enhancement in telemedicine applications, patient monitoring (2) reduce the cost of electromedical devices (3) manipulate patient disease before become critical case (4) Improve quality of health care (5) reduce time for meeting doctor to diagnosis patient and reduce frequently meeting.
This information extraction from this work (app) is benefits to get critical decision about care of patient.
Important of this work based on decrease the cost of health care rising in world and improve effictient of diagnosies to some disease that is related to heart. Continously monitoring to patient at home and provide some advice to it. The system includes a circuit which communicates to Arduino Uno R3 board. Matlab was used to analyze the data coming from the Arduino Uno R3 by using PPG sensor to capturing data from finger, read signal comes from sensor and transfer to Matlab to complete analysis of data and show it in LCD.
* Corresponding author:
mu_sab2010@hotmail.com (Musab Nur-Elhuda Mohammed) Published online at http://journal.sapub.org/ajsp
Copyright©2018The Author(s).PublishedbyScientific&AcademicPublishing This work is licensed under the Creative Commons Attribution International License (CC BY). http://creativecommons.org/licenses/by/4.0/
We calculate heart rate and defined that zone patient on it depending on:
Patient age
Max heart rate (MHR).
2. Methdology
ECG is a register of the heart’s electrical activity & PPG is register of heart activity based on absorbtion of light. The frequency range of ECG is from (0.1-150) Hz. It is widely used routine for cardiac diagnostic tools. Arduino is a simple microcontroller board and an open source development environment that helps users build digital devices and interactive objects. It is used as the basic component to connect the pulse sensor sensor etc. finger placed on it and detects the flow of blood in the vessels and gets the pulse rate in the body and then send data data to MATLAB software for processing.
Steps used:
data acquisition
ECG signals were downloaded from the MIT-BIH arrhythmia database
pre processing
ECG signal was first normalized to remove the DC and passed to derifed and squaring filter
feature extraction QRS detection
Determine Q,R,S wave for each beats of patient and classification of ECG.
3. Design & Implementation
n=length(sig); fs=100;
t = [0:n-1]/fs; % time
fax_sample=[0 : n-1]; Figure(1)
subplot(2,1,1)
plot(t,sig,'r');grid on
legend('ECG signals');
xlabel('times [S]');
ylabel('electrical activity [V]');
title('ECG signals [time domain]');
xlim([0 10]) subplot(2,1,2)
plot (fax_sample,abs(fft(sig)));
legend('frequency of signal');
xlabel('frequency [Hz]');
ylabel('magnitude');
title('Frequency Domain');
axis tight
Figure 1. Architecture of proposed system
Remove DC from Electrocardiograph signal and normalization.
sig = sig - mean (sig); % cancel DC
conponents
sig = sig/ max( abs(sig)); % normalize to
one
Figure(2) subplot(2,1,1) plot(t,sig) xlim([1 7])
grid on;
xlabel('second');ylabel('Volts');title('
ECG Signal after cancellation DC and
normalization')
subplot(2,1,2)
plot(t(200:600),sig(200:600))
xlabel('second');ylabel('Volts');title('
ECG Signal 1-3 second')
xlim([1 3])
grid on;
There are many noise occurs when ECG obtained from heart like:
Power line interference
Electrode contact noise, baseline drift and motion artifacts
EMG from the chest Instrumentation noise Electrosurgical noise
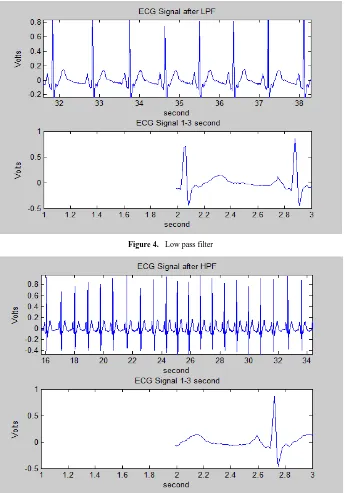
For that to avoid that is noise we use two types of filtering (FIR):
A low-pass filter passes low frequencies fairly well A high-pass filter passes high frequencies fairly well That is mean used band pass filter to determine range of ECG frequenciy captured from patient and increase the accurate of ECG signal, Figures explained signal format after LPF & HPF.
Ecg signal after low path filter by canceling out the noise by high pass filtering and baseline wander by low pass Snapshot:
[b a]=cheby2(8,0.001,0.08);
h_LP=filter(b,a,[1 zeros(1,12)]);
% transfer function of LPF
x2 = conv (sig ,h_LP);
x2 = x2 (6+[1: n]); %cancle delay
x2 = x2/ max( abs(x2 ));
% normalize , for convenience .
Figure(3) subplot(2,1,1)
plot([0:length(x2)-1]/fs,x2)
xlabel('second');ylabel('Volts');title('
ECG Signal after LPF')
xlim([0 max(t)]) subplot(2,1,2)
plot(t(200:600),x2(200:600))
xlabel('second');ylabel('Volts');title('
ECG Signal 1-3 second')
xlim([1 3])
Figure 4. Low pass filter
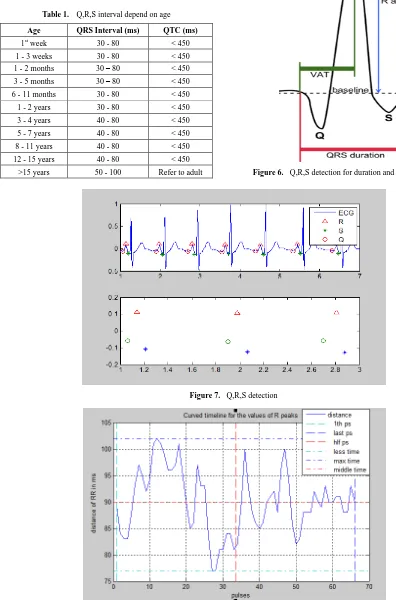
In this Figure determine Q,R,S wave in ecg signal, It corresponds to the depolarization of the right and left ventricles of the human heart. In adults, it normally lasts 0.06–0.10 s; in children and during physical activity, it may be shorter. The Q, R, and S waves occur in rapid succession.
Table 1. Q,R,S interval depend on age
Age QRS Interval (ms) QTC (ms)
1st week 30 - 80 < 450 1 - 3 weeks 30 - 80 < 450 1 - 2 months 30 – 80 < 450 3 - 5 months 30 – 80 < 450 6 - 11 months 30 - 80 < 450 1 - 2 years 30 - 80 < 450 3 - 4 years 40 - 80 < 450 5 - 7 years 40 - 80 < 450 8 - 11 years 40 - 80 < 450 12 - 15 years 40 - 80 < 450
>15 years 50 - 100 Refer to adult Figure 6. Q,R,S detection for duration and amplitude for one beat
Figure 7. Q,R,S detection
Figure 9. PPG signal of patient in real time
Work on ppg signal by capturing signal from patient in real time that is another aspect of this paper to reduce the cost of patient monitoring this method depending on absorbtion of light.
4. Conclusions
The results obtained using MATLAB for ECG analysis and detection of some disease like arrhythmia is very fast and useful, as the ECG can be easily read, saved in a file and the filtering, derivation, squaring, thresholding, applying the moving window integration, peak detection can be done accurately and determining heart rate and some vital signs that is related and depended on HR. That will help us to improve the accuracy.
REFERENCES
[1] L. Cromwell, Medical Instrumentation for Health Care, Prentice Hall, 1976I. S. Jacobs and C. P. Bean, “Fine particles, thin films and exchange anisotropy,” in Magnetism, vol. III,
G. T. Rado and H. Suhl, Eds. New York: Academic, 1963, pp. 271–350.
[2] R.J.Traister, Principles of Biomedical Instrumentation and Monitoring, Reston Publishing, 1981.
[3] THE BEER-LAMBERT LAW http://www.chemguide.co.uk /analysis/uvvisible/beerlambert.htm.
[4] Beer’s Lawhttp://teaching.shu.ac.uk/hwb/chemistry/tutorials /molspec/beers1.htm.
[5] MIT/BHI arrhythmia database-Tape directory and format specification. Database is available from Bioengineering Avenue, Boston, MA 02215.
[6] F. Biloon, Medical Equipment Service Manual: Theory and Maintenance Procedures, Prentice Hall, 1978.
[7] Analysis and Interpretation of the Electrocardiogram https://meds.queensu.ca/central/assets/modules/ts-ecg.
[8] Automated ECG interpretation https://en.wikipedia.org/wiki/ Automated_ECG_interpretation.
[9] Cardiac emergencies
http://clinicalgate.com/cardiac-emergencies.