5235
HPLC METHOD DEVELOPMENT AND VALIDATION FOR THE SIMULTANEOUS ESTIMATION OF METFORMIN AND SITAGLIPTIN IN BULK AND
PHARMACEUTICAL DOSAGE FORM
L.Satyanarayana1 and T.Padmini2*
1Omega College of Pharmacy, Ghatkesar, Hyderabad
2*Megha Institute of Engineering and Technology for Women, Ghatkesar, Hyderabad
*Corresponding author E-mail: [email protected]
ARTICLE INFO ABSTRACT
Key Words
Metformin ,Sitagliptin, system suitability, linearity, precession,
assay, LOD, LOQ.
A simple, precise, rapid and accurate reverse phase HPLC method was developed for the estimation of metformin and sitagliptin in bulk and formulation dosage.A column of ODS(250mm 4.6mm; i.d and 5µ particle size) was used. The mobile phase comprises of 0.02M di potassium hydrogen orthophosphate buffer (pH adjusted to 3.3) and acetonitrile in the ratio of 40:60 (v/v). The flow rate was 1.0 ml/min and the effluents were monitored at 260 nm. The retention time for metformin was 3.0 min and sitagliptinwas 3.9min.The detection concentration was linear over 125-750ppm for metformin and 12.5-75ppm for sitagliptin. Regression equationsof metformin and sitagliptin were found to be y = 25883x + 19711 and y = 27696x + 6046 respectively with regression co-efficient 0.999. The developed method was successfully validated in accordance to ICH guidelines. Hence, this method can be conveniently adopted for the routine analysis in quality control laboratories.
INTRODUCTION:
Metformin is an oral antidiabetic drug in thebiguanide class. It is the first-line drug of choice for the treatment of type 2 diabetes, in particular, in overweight and obese people and those with normal kidney function. Its use in gestational diabetes has been limited by safety concerns although at least one study has been conducted which showed no concerns for children prenatally exposed to Metformin up to 2 years of age. It is also used in the treatment of polycystic ovary syndrome, and has been investigated for other diseases where insulin resistance
may be an important factor. Metformin works by suppressing glucose production from three-carbon molecules (like propionic acid, a byproduct of dietary fibre fermentation in the large intestine and pyruvate, a byproduct of glucose breakdown in the muscles) by the liver[1,2]. Chemically metformin is N,N-dimethylbiguanide with chemical formula C4H11N5and molecular
weight 129.16 g/mol.
5236
Figure 1: Structure of metformin
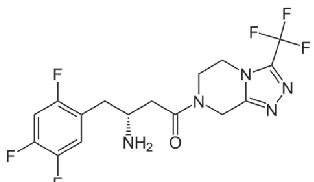
Sitagliptin (previously identified as MK-0431 and marketed as the phosphate salt under the trade name Januvia) is an oral antihyperglycemic (antidiabetic drug) of the dipeptidyl peptidase-4 (DPP-4) inhibitor class. It was developed and marketed byMerck & Co. This enzyme-inhibiting drug is used either alone or in combination with other oral antihyperglycemic agents (such as Metformin or a Thiazolidinedione) for treatment of diabetes mellitus type 2. The benefit of this medicine is its fewer side effects (e.g., less hypoglycemia, less weight gain) in the control of blood glucose values. While safety is its advantage, efficacy is often challenged as it is often recommended to be combined with other agents such as Metformin[1,2]. Sitagliptin is chemically (2R)-4-Oxo-4-[3-(trifluoromethyl)-5,6- dihydro[1,2,4]triazolo[4,3-a]pyrazin-7(8H)-yl]-1-(2,4,5-trifluorophenyl)butan-2-amine with molecular formula C16H15F6N5O and
molar mass 407.31 g/mol.
Figure 2: Structure of sitagliptin
Few HPLC methods were developed for estimation of metformin and sitagliptin[3-12]. The present developed method was successfully validated in accordance to ICH
guidelines [13].The results of the study showed that the proposed RP-HPLC method is useful for the routine determination of metformin and sitagliptin in bulk drug and in its pharmaceutical dosage form.
MATERIALS AND METHODS:
Metformin and sitagliptinwere obtained as a gift sample from Hetero Drugs Ltd. Hyderabad. Acetonitrile, methanol, potassium dihydrogen phosphate and ortho-phosphoric acid used were of analytical grade. Commercially available metformin capsules (Act Metformin®-500 mg) and sitagliptin (Janvia®-100mg) were procured from local market.
INSTRUMENTS:
Quantitative HPLC was performed on Waters Alliance 2695 Separations Module is a high performance liquid chromatographic system with a quaternary, low-pressure mixing pump and inline vacuum degassing powered with Empower-2 Software. An ODC column of 250mm 4.6mm: i.d and 5µ particle size was used.PG Instruments T60 with special bandwidth of 2mm and 10mm and matched quartz was be used for UV measurements.
Preparation of standard solution:
Accurately weighed and transferred 50mg of Metformin and 5mg of Sitagliptin working Standards into 10ml clean dry volumetric flasks, add 3/4 ml of diluent, sonicated for 5 minutes and make up to the final volume with diluents. 1ml from the above two stock solutions was taken into a 10ml volumetric flask and made up to 10ml and made up to 10ml and final concentration is 500 µg/ml and 50 µg/ml.
Preparation of working standard:
5237 tablets was found and crushed to a fine
powder. From the triturate of ten tablets, an amount equivalent to 2500mg was accurately weighed and transferred in to 100ml volumetric flask and make up to the mark with diluent. The solution was sonicated for 25 min and filtered through whattman filter paper No.41.From the clear solution pipette out 0.2ml and transfer into a 10 ml volumetric flask and made up to the mark with diluent and final concentration is 500 µg/ml and 50 µg/ml.
Preparation of mobile phase:
Prepare a mixture of 40ml buffer and 60ml acetonitrile, degas in ultrasonic water bath for 5min.Filter through 0.45m under vaccumfiltration.
Preparation of Buffer (0.01 KH2PO4):
Accurately weigh 1.36gm of Potassium di-hydrogen ortho phosphate in a 1000ml of volumetric flask, add about 900ml of milli-Q water and degas to sonicate. Finally make up the volume with water and pH adjusted to 3.3 with ortho phosphoric acid solution.
EXPERIMENTATION:
System Suitability:
The system suitability studies were evaluated by comparing with standard chromatogram and by obtaining the parameters retention time, column efficiency and tailing factor. All the system suitability parameters are within range and satisfactory as per ICH guidelines [13].
Linearity:
Accurately weighed 50mg of Metformin and 5mg of Sitagliptin working standards transferredinto 10ml clean dry volumetric flasks, added 3/4 ml of diluent,
sonicated for 5 minutes and make up to the final volume with diluents to obtain final concentration of 5000 µg/ml and 500 µg/ml.Six linear concentrations of Metformin and Sitagliptin (125ppm to 750ppm) were prepared and injected. Regression equation of Metformin and Sitagliptin are found to be, y = 25883x + 19711 and y = 27696x + 6046.The regression co-efficient was 0.999.
Assay studies:
Six homogeneous samples of both sample and standard were injected. Percentage assay of the drug in the formulation was estimated. The average %assay was calculated and found to be 99.87% and 100.16% for metformin and sitagliptin respectively. The assay data was tabulated in Table 3.
Precision:
Interday precision was performed with 24 hrs time lag and the %RSD obtained for Metformin and sitagliptin were 1.92% and 1.76 %.(Table 5)
Limit of Detection (LOD) and Limit of Quantification (LOQ):
LOD* and LOQ** of the drug were calculated using the following equations designated by International Conference on Harmonization (ICH) guideline [13] .
* LOD = 3.3 × /S and **LOQ = 10 × ҡS
Where ҏ= the standard deviation of the response * S = Slope of calibration curve
5238 Table 1: System suitability data
Property Metformin Sitagliptin Retention time (tR) 3.0± 0.3 min 3.9±0.3min Theoretical plates(N) 6477 ± 163.48 7979± 163.48
Tailingfactor (T) 0.86 ± 0.117 1.34± 0.117
Figure 3: Optimized Chromatogram of Metformin and Sitagliptin
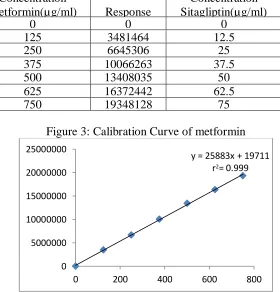
Table 2: Calibration data of metformin and Sitagliptin S.No Concentration
Metformin(µg/ml) Response
Concentration Sitagliptin(µg/ml)
Response
1 0 0 0 0
2 125 3481464 12.5 352868
3 250 6645306 25 689638
4 375 10066263 37.5 1052360
5 500 13408035 50 1405358
6 625 16372442 62.5 1753133
7 750 19348128 75 2059078
Figure 3: Calibration Curve of metformin
y = 25883x + 19711
r2= 0.999
0 5000000 10000000 15000000 20000000 25000000
5239 Figure 4: Calibration Curve of sitagliptin
Table 3: Assay data metformin and sitagliptin:
S. No. Metformin %Assay
Sitagliptin %Assay
1 99.24 100.13
2 100.61 99.55
3 99.61 100.92
4 100.53 99.50
5 100.16 100.54
6 99.07 100.31
AVG 99.87 100.16
STDEV 0.66 0.56
% RSD 0.66 0.56
Figure 6: Standard assay chromatogram
y = 27696x + 6046 r² = 0.999
0 500000 1000000 1500000 2000000 2500000
5240 Table 5: Inter day precision studies
S. No. Metformin Sitagliptin
1 13541278 1387585
2 13515981 1412087
3 13030796 1353382
4 12991186 1350963
5 13056331 1357619
6 13087151 1362676
Mean 13203787 1370719
Std. Dev. 253708 24178.3
%RSD 1.92 1.76
Table 6: LOD Results for Metformin and Sitagliptin
Figure 7: LOD Chromatogram of metformin and sitagliptin
Figure 8: LOD Chromatogram of metformin and sitagliptin S.No Drug Name Conc. (g/ml) RT(min)
Area (V* sec)
1 Metformin 2.51 3.047 56211
5241
LOQ: Limit of Quantification was calculated by Metformin and Sitagliptin method and LOQ for
Metformin and Sitagliptin were found to be 7.62 and 2.18 respectively.
Table 7: LOQ Results for Metformin and Sitagliptin
Figure 9: Chromatogram of Limit of Quantification
Table 8:Robustness results for Metformin and Sitagliptin
S.No Robustness condition
Metformin %RSD Sitagliptin %RSD
1 Flow minus 0.3 0.0
2 Flow Plus 0.5 0.6
3 Mobile phase minus 0.0 0.1
4 Mobile phase Plus 0.3 0.2
5 Temperature minus 0.2 0.1
6 Temperature Plus 0.5 0.1
Table 6: Detection characteristics of metformin and sitagliptin:
Parameters Metformin sitagliptin
Calibration range (µg / ml) 125-750ppm 12.5-75ppm
Optimized wavelength 260nm 260nm
Retention time 3.0min 3.9min
Regression equation (Y) y = 25883x + 19711 y = 27696x + 6046 Correlation coefficient(r2) 0.999 0.999
Precision (% RSD) 1.92% 1.76%
% Assay 99.87% 100.16%
Limit of Detection (µg / ml) 2.51ppm 0.72ppm Limit of Quantitation (µg / ml) 7.62ppm 2.18ppm
S.No Drug Name Conc. (g/ml) RT(min) Area (V* sec)
1 Metformin 7.62 3.047 56211
5242 Figure 10: Typical chromatogram of metformin and sitagliptin:
ROBUSTNESS:
Small deliberatechanges in method like Flow rate, mobile phase ratio, and temperature are made but there were no recognized change in the result and are within range as per ICH Guide lines [13].
RESULTS AND DISCUSSION:
From the typical chromatogram of drugs as shown in Figure 10, the retention time for metformin is 3.004min and sitagliptin is 3.992min. The mobile phase comprises of 0.02M di potassium hydrogen orthophosphate buffer (pH adjusted to 3.3) and acetonitrile in the ratio of 40:60 (v/v). The flow rate was 1.0 ml/min and the effluents were monitored at 260nm.Over 1.0 ml/min gradient mode of separation which was found to be most suitable to obtain a peak well defined and free from tailing. In the present developed HPLC method, the standard and sample preparation required less time and no tedious extraction were involved. A good linear relationship (r=0.9999) was observed between the concentration range of 125-750 ppm for metformin and 12.5-75ppm for sitagliptin. Low values of standard deviation are indicative of the high precision of the method. (Table 6). The assay of metformin was 99.87% and sitagliptin was 100.16%
(Table 3). The absence of additional peaks in the chromatogram indicates non-interference of the common excipients used in the formulation. The limit of detection (LOD) and limit of quantification (LOQ) for metformin were found to be 2.51 and 7.62 ppm; for sitagliptin were 0.72 and 2.18ppm respectively.(Table 6, Table 7). This demonstrates that the developed HPLC method is simple, linear, accurate, sensitive and reproducible. Thus, the developed method can be easily used for the routine quality control of bulk and tablets dosage form of the drugs within a short analysis time.
REFERENCES:
1. Hardmen J, Goodman Gilman A and Limbird L, 1996. Goodman and Gilman The Pharmacological Basis of Therapeutics.
2. KD Tripathi. Essentials of Medical Pharmacology 4th Edition
3. Shyamala, Mohideen, Satyanarayana Validated rp-hplc for simultaneous estimation of sitagliptin phosphate and metformin Hydrochloride in tablet dosage form. American j pharm res., 2011; 1(2): 94-101.
5243 sitagliptin phosphate monohydrate
and metformin hydrochloride in tablets by a validated uplc method. Sci pharm, 2012; 80: 139–152.
5. Ghazala, Dinesh, Agrawal, Neetu, Avnish and Gupta; Simultaneous Estimation of Metformin and SitagliptinIn Tablet Dosage Form. Asian J Biochem Pharma Res, 2011; 1(2): 352-358.
6. Narendra, Jeyabalan; method development of simultaneous estimation of Sitagliptin and metformin hydrochloride in pure and Tablet dosage form by uv-vis spectroscopy. World J of pham and pharmaceutical sci., 2012; 1(4): 1392-1401.
7. Govindaswamy; Simultaneous estimation of sitagliptin phosphate monohydrate and metformin hydrochloride in bulk and pharmaceutical formulation by RP-HPLC. J Pharm Educ Res., 2012; Vol. 3(2): 24-28.
8. Raja, Lakshmana; Validated rp-hplc method for simultaneous estimation of Metformin hydrochloride and sitagliptin phosphate in Bulk drug and pharmaceutical formulation. Ijpcbs 2012, 2(4), 696-702.
9. Sumithra, Shanmugasudaram, Sankar, Niharika; Devolopment of RP-HPLC method and it’s validation for simultaneous estimation of Sitagliptin and metformin. Ijpcs, 2012; 1(1): 360-364.
10.Ashutosh, Manidipa and Seshagiri; Development of stability indicating RP- HPLC method for simultaneous estimation of metformin hydrochloride and sitagliptin phosphate monohydrate in bulk as well as in pharmaceutical formulation. Der Pharmacia Sinica, 2013; 4(4):47-61.
11.Karimulla, Vasanth, Ramesh, Ramesh; Method development and
validation of Sitagliptin and metformin using
reverse phase HPLC method in bulk and tablet dosage form. Der Pharmacia Lettre, 2013, 5 (5):168-174.
12.Ramanjaneyulu, Dhanalakshmi,
Ramesh; A new analytical method development and Validation for
simultaneous estimation of Sitagliptin and Metformin hydrochloride in tablet dosage form By RP-HPLC. IJPS, 2013; vol. 3(5): 3 360-364