Patron: Her Majesty The Queen Rothamsted Research Harpenden, Herts, AL5 2JQ Telephone: +44 (0)1582 763133 Web: http://www.rothamsted.ac.uk/
Rothamsted Research is a Company Limited by Guarantee
Rothamsted Repository Download
A - Papers appearing in refereed journals
Chambers, W. E. 1953. Nutrient composition of the produce of the
Broadbalk continuous wheat experiment II. Changes occurring during one
season's growth. The Journal of Agricultural Science. 43 (4), pp.
479-484.
The publisher's version can be accessed at:
•
https://dx.doi.org/10.1017/S0021859600057956
The output can be accessed at:
https://repository.rothamsted.ac.uk/item/96y0w/nutrient-
composition-of-the-produce-of-the-broadbalk-continuous-wheat-experiment-ii-changes-occurring-during-one-season-s-growth
.
© Please contact [email protected] for copyright queries.
[479 ]
NUTRIENT COMPOSITION OF THE PRODUCE OF THE
BROADBALK CONTINUOUS WHEAT EXPERIMENT
II. CHANGES OCCURRING DURING ONE SEASON'S GROWTH
BY W. E. CHAMBERS Rothamsted Experimental Station, Harpenden, Herts*
(With One Text-figure)
The changes in the nutrient composition of Broad-balk wheat at harvest were discussed in Part 1 of this paper. Knowles & Watkin (1931), Chambers & Gardner (1951), and other workers, have found that the composition of wheat changes during growth, and that as the crop matures nutrients, particularly potassium, are lost from the aerial parts of the plant. It has been suggested that these losses might be larger when wheat is grown with an adequate nutrient supply, and the nutrient com-position might become less dependent on nutrient supply as the crop matured. In this paper analyses are given of samples taken from eight Broadbalk plots during the summer of 1945. These analyses were all obtained by the Lundegardh flame method of spectrographic analysis as described in Part 1 of this paper.
METHOD OF SAMPLING
One-fifth of each Broadbalk plot has been fallowed each year since 1931. In 1945 samples were taken on eight plots from section 1 (4th crop after fallow) and section 2 (3rd crop after fallow). The samples from these two sections were bulked for analysis. An estimate of the plant population was obtained by counting the number of tillers in 1 m. of row at five places, chosen at random, along each side of each section. At every site a known number of tillers were uprooted, the roots cut off just above ground-level, and the tops and roots kept separately. After ear emergence the tops were subdivided into ears and stems. The stem fraction included all the aerial parts of the plant except the ears; for con-venience this fraction will be referred to as stems.
The samples of the tops were dried and weighed, and the dry matter per acre was calculated. An analysis of variance gave a standard error for the mean yield of two sections of ± 3-5 cwt./acre or 12-5 % of the general mean.
The samples of the roots from each section were washed free from soil, dried, and weighed. The total root weight was not estimated by this procedure since only part of the root system could be removed * Now at Royal Agricultural College. Cirenceater, Gloucestershire.
without damage to the rest of the crop. Analyses of this material may have given low values due to nutrients being leached when the soil was washed from the roots. Incomplete washing might have resulted in high calcium values as Broadbalk soil contains large amounts of calcium.
The first samples were taken on 3 May, and after-wards samples were taken at 3-weekly intervals until 25 July. The last samples were taken on 7 August just before the crop was harvested.
PRODUCTION OF DRY MATTER
The estimates of dry matter at each sampling time are shown in Fig. 1. The mean yields of dry straw and grain for the years 1901-21 are included. The estimated yields at harvest in 1945 were very similar to the mean yield. On every plot the esti-mated yield of ears at the last sampling was greater than the mean yield of grain because the ear fraction included chaff and offal corn. The difference was greatest on the NP plot where the proportion of offal corn had always been high.
Dry matter was produced on all plots from May until the beginning of July, but the rate of produc-tion varied from plot to plot. Later in the season very little dry matter was produced and on some plots the dry matter per acre decreased. During this later period there was considerable transloca-tion of dry matter from the stems into the ears. The weight of the part of the root system which was collected increased to a maximum in June and then declined. This might have been due to the surface roots dying back as the crop matured, or to the drier soil reducing the amount of the roots which were collected.
480
The Broadbalk continuous wheat experiment
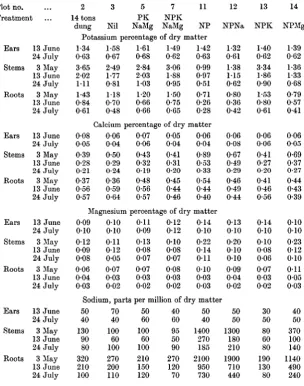
Table 1. Changes in nutrient concentrations during growth
Plot no. Treatment Ears Stems Roots Ears Stems Roots Ears Stems Roots Ears Stems Roots 13 June 24 July 3 May 13 June 24 July 3 May 13 June 24 July 13 June 24 July 3 May 13 June 24 July 3 May 13 June 24 July 13 June 24 July 3 May 13 June 24 July 3 May 13 June 24 July 13 June 24 July 3 May 13 June 24 July 3 May 13 June 24 July 2 14 tons dung 3 Nil 5 P K NaMg Potassium percentage 1-34 0-63 3-65 202 111 1-43 0-84 0-61 1-58 0-67 2-49 1-77 0-81 118 0-70 0-48 1-61 0-68 2-84 2 0 3 1-03 1-20 0-66 0-66 7 NPK NaMg 11 NP of dry matter
1-49 0-62 3-06 1-88 0-95 1-50 0-75 0-65
Calcium percentage of dry i 0-08 0-05 0-39 0'28 0-21 0-37 0-56 0-57
0 0 6 0-04 0-50 0-29 0-24 0-36 0-59 0-64 Magnesium 0-09 0-10 0-12 0-09 0-08 0-06 0-04 0 0 3
0 1 0 0-10 0 1 1 0 1 2 0-05 0-07 0 0 3 0'02
0-07 0-06 0-43 0-32 0 1 9 0-48 0-56 0-57 0-05 0-04 0-41 0-31 0-20 0-45 0-44 0-46
percentage of dry 0 1 1
0-09 0-13 0-08 0-07 0-07 0 0 3 0-02 0-12 0-12 0-10 0-08 0-07 0-08 0 0 3 0-02 1-42 0-63 0-99 0-97 0-51 0-71 0-26 0-28 natter 0 0 6 0 0 4 0-89 0-53 0-33 0-54 0-44 0-40 r matter 0 1 4 0 1 0 0-22 0 1 4 0-11 0 1 0 0-03 0 0 3
Sodium, parts per million of dry matter 50 40 130 90 80 320 210 100 70 40 100 60 100 270 200 110 50 60 100 60 100 210 150 120 40 60 95 50 90 270 120 70 50 40 1400 270 185 2100 950 730 12 NPNa 1-32 0-61 1-38 115 0-62 0-80 0-36 0-42 0-06 0-08 0-67 0-49 0-29 0-46 0-49 0-44
0 1 3 0 1 0 0-20 0-10 0-10 0-09 0 0 4 0-02 50 50 1300 180 210 1900 710 440 13 NPK 1-40 0-62 3-34 1-86 0-90 1-53 0-80 0-61 0-06 0-06 0-41 0-27 0-20 0-41 0-46 0-56
0 1 4 0-10 0 4 0 0-08 0-06 0-07 0 0 3 0-02 30 50 80 60 80 190 130 80 14 NPMg 1-39 0-62 1-36 1-33 0-68 0-79 0-57 0-41
0 0 6 0 0 5 0-69 0-37 0-27 0-44 0-43 0-39 0-10 0-10 0-23 0 1 2 0 4 0 0-11 0 0 5 0 0 3
40 50 370 100 140 1140 490 240
CONCENTRATION OF NUTRIENTS IN THE PLANT
Many of the changes in nutrient concentration during growth were similar on all plots. The highest concentrations of nutrients in stems and roots occurred at the first sampling and the highest con-centration in the ears occurred at emergence. As the crop grew the concentration of nutrients in the plant decreased. The concentration of nutrients in the stems and roots varied with fertilizer treatment, but the concentrations in the ears were nearly independent of fertilizer treatment even when they were first formed.
Analytical results for three or the six sampling times are given in Table 1. The ears had formed on most tillers by 13 June.
Potassium concentrations
Fertilizer potassium increased the percentage of potassium in both stems and roots. In the early stages the stems and roots from the PKNaMg plot contained a lower percentage of potassium than the stems and roots from the plots which received nitrogen in addition to phosphorus and potassium. Later in the season this was reversed, due probably to a dilution effect which resulted from the extra growth when nitrogen was supplied.
and magnesium sulphates had the same effect on the growing crop as they had on the crop at harvest (Part 1 of this paper).
The concentration of potassium in the ears was not related to potassium supply. On 13 July, when the ears had just formed, the potassium concentra-tions were on some plots higher and on other plots lower than the concentrations in the stems. As the ears matured the potassium concentration decreased on all the plots. This agreed with Lawes & Gilbert's (1884) conclusion that the composition of the grain at harvest varied more with degree of maturity than with fertilizer supply.
Calcium concentrations
The calcium concentrations in the roots did not vary with fertilizer treatment and tended to increase as the crop developed. This was probably due to the large amounts of calcium in Broadbalk soil. The calcium concentrations in the stem fractions were apparently controlled by the potassium supply at all stages of growth. The plots which received potassium produced stems with low concentrations of calcium; the calcium concentrations were higher on the plots which did not receive potassium. The highest calcium concentrations in the stems occurred on the NP plot; the NPNa and NPMg plots produced stems with lower but almost equal calcium concentrations.
The ears always contained very little calcium, and the concentrations were always smaller than in the stems. Fertilizer treatment did not affect the concentration of calcium in the ear.
Magnesium concentrations
The magnesium concentration in the stems and, to a lesser extent, in the roots, appeared to be con-trolled by the potassium supply and not the magnesium supply. During the early stages of growth the NP, NPNa, and NPMg plots produced plants containing nearly twice the concentration of magnesium found on the other plots. At all times the composition of the plants from the NPMg plot were very similar to the plants from the NPNa plot, although the soil on the NPMg plot contained considerably more exchangeable magnesium.
Sodium concentrations
On every plot the roots contained .higher centrations of sodium than the stems, but the con-centrations in both roots and stems appeared to be controlled mainly by the potassium supply, although the sodium concentration only reached very high levels on the NP and NPNa plots. The sodiiun concentrations in the plants from these two plots were very similar at all times, and the sodium sulphate supplied on the NPNa plot did not appreciably increase sodium uptake.
THE TOTAL UPTAKE OF NUTRIENTS
BY THE PLANT
The uptake of nutrients was never as rapid as the assimilation of carbon, and early in the season the nutrient concentrations declined although there was considerable nutrient uptake. As the crop matured nutrient uptake ceased and the amounts of nutrients in the stems decreased on all plots. These changes are illustrated in Fig. 1.
Potassium
The content of potassium in the aerial parts of the plant reached a maximum on all plots on 13 June. Afterwards, the total potassium in the crop decreased on all plots except the NP plot. This loss of potassium came almost entirely from the stem fraction; even on the NP plot the potassium content of the stems was reduced but on this plot the loss was due entirely to translocation into the ears. It can be seen from Fig. 1 and from Table 2 that the potassium content of the stems varied similarly on all plots and was always related to the mean value of the harvested crop. The relationship might have been closer than these figures indicate as, at any sampling date, there must have been differences in the state of development of the crops on the various plots.
These results indicated that the nutrient status of the crop did not affect the changes which occurred during growth. On the plots where potassium was lost from the aerial parts of the plant, the potassium must either have been leached from the plant or translocated to the deeper parts of the root system. Analysis of the portion of the root system which •was sampled did not indicate translocation to the roots.
Calcium
The total calcium in the crop also increased to a maximum and then decreased. This maximum occurred rather later than with potassium (3 July) and was not so pronounced. The variations in stem composition were also much smaller than with potassium, partly because the total losses were smaller, but also because there was very little translocation of calcium to the ear.
Magnesium
482
The Broadbalk continuous wheat experiment
Cwt. of dry matter per acre
HI n
Dung
Ib. calcium per acre
ABcDEF G Dung
Ib. magnesium per acre
A B C D E F G ABCDEF G ABCDEF G ABCDEF G ABCDEF G ABCDEF G Nit PKNaMg NPKNaMg NP NPNa NPK
Ib. s o d i u m p e r acre
VF G AlC~bEF G A B C D E F G A B ^ D E ^
Ears R3 Stems and leaves
NPMg
ABCDE F G
NPMg
A B ^ E F G ABCDEF G ABCDEF °
Surface roots
G: Mean values harvested crop 1901-21
Fig. 1. Yield and total nutrient content of broadbalk wheat at various sampling times.
A: 3 May ": 23 May
C: 13 June D: 3 July
Sodium
Appreciable uptake of sodium occurred on the NP, NPNa, NPMg, and dung plots. On the dung plot this was due to the high yield, but on the other three plots it was due to high concentrations of sodium in the steins and roots. On both the NP and the NPNa plots the total sodium content of the stems was highest at the first sampling. On these plots sodium was lost from both stems and roots between 3 and 23 May but by 13 June the total sodium content had increased again.
The NPNa and NPMg treatments also had very similar effects on plant composition. It has been suggested in Part 1 of this paper that the differences between these plots and the NP plot were due to increased availability of soil potassium. The present results show that throughout the growing season the plants on these two plots always con-tained higher concentrations of potassium than the plants on the NP plot.
Nutrients were lost from stems and leaves as the crop matured. Some of these nutrients were trans-located into the ears, but this did not always
Table 2 Plot no.... Treatment Total Sampling date: 3 May 23 May 13 June 3 July 24 July 6 Aug. 2 14 tons dung 3 Nil 5 P K NaMg 7 NPK NaMg 11 N P
potassium content of the stem fraction, lb.
43-8 98-0 101-0 71-2 38-6 54-4 7-8 16-2 20-4 18-9 7-7 8-4 11-6 18-6 29-9 20-2 1 5 1 12-3
32-5 66-1 66-2 50-0 3 2 0 27-8 6 1 12-9 22-9 17-9 116 11-2 12 NPNa per acre 101 16-5 33-4 21-6 14-0 15-1 13
N P K
27-6 34-5 49-5 42-1 26-6 22-9 14 NPMg 9-7 24-6 33-8 21-7 17-2 17-2
Total potassium content of harvested straw, lb. per acre, mean value 1901-21 46-5 6-9 10-7 31-7 7-7 12-3 32-2 13-2
Potassium content of stem fraction as percentage of maxima 3 May 23 May 13 June 3 July 24 July 6 Aug. 44 98 100 71 39 55 DISCUSSION 38 79 100 88 38 41 39 62 100 68 50 41 49 99 100 75 48 42 account 27 54 100 78 51 49 for 30 49 100 65 42 35 the whole 56 70 100 85 54 46 of the 29 73 100 64 51 51 loss.
The relation between plant composition and nutrient supply is complicated by the changes in plant com-position which occur during growth. Analysis of Broadbalk produce in 1945 showed that the con-centration of nutrients in the plant, and particularly in the stems, varied with fertilizer treatment in the same way at every sampling time. In 1945 there was no indication that conclusions drawn from analyses of the harvested crop would differ from conclusions drawn from analyses of the crop at any other time during the growing season. Even the total nutrient contents of the stems and leaves were related at every sampling date to the contents of the crop at harvest.
At any particular date, the plants on the plots receiving potassium contained higher concentra-tions of potassium and lower concentraconcentra-tions of calcium, magnesium and sodium than the plants growing on the plots which did not receive potas-sium. Throughout the growing season the nil and the PKNaMg plots produced very similar plants.
that the other losses were due to leaf fall because the potassium losses started while dry matter was still increasing and before the losses of calcium. The potassium losses were also very much greater than the calcium losses and there were no net losses of magnesium from the aerial parts of the plants. There was no evidence of movement of nutrients into the roots; at the time when nutrients were being lost from the stems and leaves the con-centrations of these nutrients in the roots were decreasing. Nutrients might have been excreted from the roots as rapidly as they were moved into the roots or they may have been concentrated in some part of the root system which was not collected.
484
The Broadbalk continuous wheat experiment
roots would seem less improbable than that summer rain in 1945 leached 30 lb. of potassium per acre from the crop on the dung plot and none from the plot on the NP plot.
SUMMARY
1. In the summer of 1945 samples of the growing crop were taken from eight Broadbalk plots. On all the plots the concentrations of nutrients in all parts of the plants decreased during growth. The compositions of the roots and stems and leaves varied with fertilizer treatment at all times of the season. The nutrient composition of the ears was only slightly affected by fertilizer treatment.
2. The total uptake of nutrients by the crop increased to a maximum and then decreased. The
losses of potassium and magnesium from the stems and leaves were particularly large, due to trans-location into the ear but there were also net losses of potassium and calcium from the whole plant.
3. The changes which occurred were similar on all plots and the effect of fertilizer treatment on plant composition was always related to the effect at harvest. There was no evidence that the composi-tion of the crop at harvest differed radically from the composition earlier in the season.
The author wishes to express his indebtedness to Dr E. M. Crowther for much help and many valuable discussions. Also to the late Dr J. B. Hale at whose suggestion this work was undertaken. This paper is based on a portion of a thesis approved for a Ph.D. degree of London University.
BEFEKENCES
CHAMBEBS, W. E. & GARDNER, H. W. (1951). J. Soil LAWES, J. B. & GILBERT, J. H. (1884). J. Ghem. Soc. 45,
Sci. 2, 246. 305. KNOWLES, F. & WATKIN, J. E. (1931). J. Agric. Sci. 21,
612.