Demographic Research a free, expedited, online journal of peer-reviewed research and commentary
in the population sciences published by the Max Planck Institute for Demographic Research
Doberaner Strasse 114 · D-18057 Rostock · GERMANY www.demographic-research.org
DEMOGRAPHIC RESEARCH
VOLUME 2, ARTICLE 2
PUBLISHED 15 MARCH 2000
www.demographic-research.org/Volumes/Vol2/2/
DOI: 10.4054/DemRes.2000.2.2
Mortality Statistics for the Oldest-Old:
An Evaluation of Canadian Data
Robert Bourbeau
André Lebel
Mortality Statistics for the Oldest-Old:
An Evaluation of Canadian Data
Robert Bourbeau, Ph.D. 1
André Lebel, M.Sc. 2
Abstract
The main purposes of this paper is to evaluate the quality of Canadian data among the
oldest-old (80+) over the 1951-1995 period, and to compare estimations of Canadian
probabilities of death based on the extinct generation method with those of other developed
countries in order to ascertain whether Canada experiences a distinct low mortality profile. The
evaluation of the data quality suggests that Canadian data are quite good up to the age of 100,
and that the main problems concern the centenarians (overstatement of age at death and errors in
census age declarations). International comparisons on the basis of two mortality indicators for
the 80-99 age-interval lead to the same conclusion: Canadian mortality is lower than in most
European countries. The best match is still with the United States.
1
Associate Professor, Department of Demography, Interuniversity Center for Demographic Studies, Université de Montréal, Canada; Tel: (514) 343-5870; [email protected]
2 Research Assistant, Department of Demography, Interuniversity Center for Demographic Studies,
1 Background
In Canada, as in many other industrialised countries, half of all female deaths and a third of
male deaths occur at advanced ages (80 years and over) [35]. The evolution of this phenomenon
thus plays a significant role with respect to increases in life expectancy and the intensity of
population aging. Our paper stems from the wider debate regarding the possible limits of human
longevity and the evolution of mortality among the oldest-old [36] [37].
For a number of reasons, certain researchers are doubtful that survival probabilities at
advanced ages can go on rising and expect life expectancy at birth to reach a ceiling at 85 years.
They consider death over the age of eighty to be an inevitable, and natural, consequence of the
aging process [4] [13] [14] [31] [32]. More optimistic writers have demonstrated, using
simulation techniques, that life expectancy at birth could reach much higher levels; a mortality
reduction of 2% at all ages over a long period of time would lead to a life expectancy at birth of
100 years for women and of 95 years for men [1]. This optimism is shared by other researchers
who speculate that risk factors could gradually be eliminated by adopting more healthy lifestyles
and by advances in medical biotechnology [28] [40].
Their hypotheses were not necessarily based on observed data due to imperfections in
mortality statistics at advanced ages. These shortcomings have been partly overcome by
researchers at the University of Odense (Denmark), who created a large database of mortality
statistics at advanced ages from thirty-one countries known to have reliable data
(Kannisto-Thatcher Oldest-Old Database); nonetheless, even in this sample of developed countries with
fairly low levels of general mortality, data quality was relatively variable. In their study, still
quoted in recent papers (such as [39]), Canadian and American data were classified as being of
inferior quality, both in terms of their availability, and because of false declarations of age – in
death registration and in census data [20] [21]. We must add that for Canada, the data used in the
European study were limited to those published (data with an open age group at 90+, for
example), which did not give the real picture in terms of quality of data and measurement of
Other groups of researchers closely examined data on mortality at advanced ages from
countries with reliable data sources, though with particular reference to the United States [7] [8]
[9] [23] [24] [42]. These researchers established the following results:
• Mortality at advanced ages has decreased since the beginning of the century, and most
notably since 1950 [21].
For the majority of countries investigated, i.e. countries with high quality data, mortality
rates at 80-99 years fell dramatically between 1960 and 1980. The annual improvement in
mortality levels was more pronounced for the female population than for males, between 1 and
2%, and 0.5 and 1.5%, respectively.
• The rate of increase of mortality above age 80 declines with age [7] [18] [19].
• Mortality rates among the oldest-old are often understated in countries where death
registration is imprecise and, in general, these age-at-death errors explain a large part of the
mortality crossover [7].
In other respects, studies of North American data show that the United States has lower
mortality levels than those of most European nations. The reason for this is not obvious, though
three possible sources are worthy of mention: the inferior quality of the data [7] [8] [12]; the
greater homogeneity of the elderly population in the USA with respect to health status [7] [17];
and a relative advantage for the elderly in terms of income, education and health-care [2] [17].
These studies have led to the introduction of the idea of a “North American profile”,
specific to the mortality patterns of the oldest-old. Canada has been assimilated into this profile
without any real knowledge of the Canadian situation. However, a study has demonstrated that
Canadian data had errors of age declaration similar to those of other English-speaking nations
(United Kingdom, Australia and New-Zealand) [9].
In fact, the Canadian life tables are the source of almost all we know about Canadian
mortality at advanced ages [3]. But do these life tables reflect accurately the mortality of the
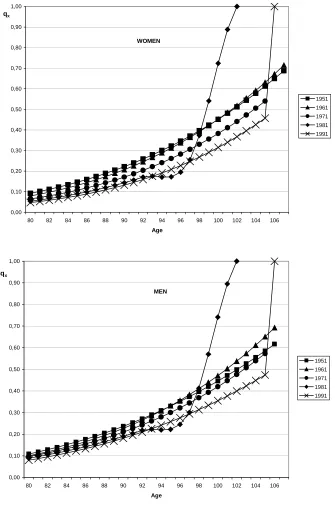
oldest-old in Canada? Figure 1 shows the probabilities of dying (qx) for men and women between
age 80 until the end of the life table for each census year from 1951 to 1991 (Canadian Life
Tables). First, it is clear that probabilities of dying at advanced ages rise smoothly with age; this
is not surprising since they are produced by graduation methods that generate very smooth
although there are some crossovers explained by changes in the method of estimation employed
(as in 1980-1982) which may produce fairly surprising results. These probabilities of dying,
however, cannot be compared to data from other countries since the methods are not the same.
We propose, therefore, to apply the method of extinct generations to Canadian data in order to
reconstitute a population that will provide us with a more precise denominator for calculating
probabilities of death at old and extreme ages.
FIGURE 1
In this paper, our aim is to assess the Canadian situation, by evaluating the quality of
mortality and population statistics, by estimating mortality levels with the aid of methods
employed by Kannisto [21] (Kannisto-Thatcher Oldest-Old Database) and by Wilmoth [43]
(Berkeley Mortality Database), and by clarifying the debate on the existence or otherwise of a
North-American mortality profile [Note 1].
More precisely, we will try to answer the following questions: Are Canadian data really
bad in measuring oldest-old mortality? And is Kannisto [20] right about the quality of Canadian
data? We will use some indicators suggested by Coale and Kisker [8] and by Kannisto [22] to
evaluate the quality of data in Canada, using more detailed data. If the various indicators show
the same problems as previously found in other studies, it will confirm the bad quality of
2 Data: Population and Deaths
Quantitative data for our analysis is mainly derived from two sources from Statistics
Canada [33]: the Canadian Censuses provide population counts by sex and age and the Annual
Vital Statistics provide deaths by sex, age, and year of birth.
2.1 Population
We obtained unpublished population data from the Canadian censuses from 1971 to 1991,
with details on population up to 121 years old by single year of age and sex, against which to
evaluate and compare our estimated population. On the whole, Statistics Canada’s published
population counts are of a high quality. When it comes to the elderly and very elderly population,
however, certain problems of coverage and of age and birth date declarations emerge. We will
broach these problems in detail in the course of our presentation of results.
2.2 Deaths
Data on deaths were obtained from the Health Statistics Division of Statistics Canada for
the calendar years 1951 to 1995 by sex, single year of age (up to 119 years old), and year of birth.
Deaths are organized by individual triangles of the Lexis diagram. This classification of deaths is
essential when applying Vincent’s method of extinct generations [38] to the reconstitution of the
population at advanced ages. It is generally recognized that the quality of vital statistics
declarations of deaths at advanced ages is superior to that of census declarations. Nevertheless,
registration of deaths can suffer from the overestimation of age at death, and from age and
generation heaping. Moreover, men have a greater tendency than women to overestimate their
age [22]. Overestimating age at death leads to an underestimation of mortality at advanced ages.
As numbers of individuals decrease rapidly at extreme ages, this overestimation has a more
To give an idea of the importance of the oldest-old in Canada, there were 2.12 millions
deaths of persons aged 80 and over, between 1951 and 1995. More women than men died at
these old ages: 1 171 707 women (55%) and 947 453 men (45%). Among deaths over the age of
80, 81% of men were aged between 80 and 89 compared to 72 % for women. Deaths of
centenarians were 5 471 for men and 16 010 for women and for the super-centenarians (110 +),
3 Method
3.1 Method of Extinct Generations
An important part of our paper thus consists of evaluating the quality of Canadian mortality
data for those aged 80 years and over. Drawing on mortality statistics, which generally offer
greater coverage, we reconstitute the population with the help of the method of extinct
generations [6] [38]. This method has been used by many researchers to study mortality at age 80
and above and is useful to estimate the population at advanced ages using only mortality statistics
classified by year of birth and age at death. The principle of the method is very simple; when a
cohort has died out, its size for any past year (and, consequently, at any given age) is simply
calculated by summing the deaths, beginning with the oldest. Obviously, this method assumes
the absence of international migration - a safe assumption at these extreme ages.
Although the extinct generation method can account for the problem of age misreporting in
census data, there are still problems of age misreporting at death in vital statistics, mainly net age
overstatement in particular at very old ages (100 and over). Depending on the degree of error,
this problem may affect estimates of mortality at older ages. In a recent paper, Preston et al. [30]
have examined this problem and have shown that the extinct generation method, as well as four
other methods, produce the same effect on mortality, a downward bias. However, the degree of
error related to the patterns of age misreporting chosen in that study (pattern for African
American decedents) was quite extreme, which is not the case for Canada. In fact, the Canadian
situation is more comparable to that of white Americans for which the quality of data is
sufficiently high that extinct generation methods of estimating mortality produce reliable results
[16] [17] [29].
These considerations suggest that the extinct generation method is a sound method to
estimate mortality for the oldest-old in Canada. Another consideration is a matter of consistency,
since the purpose of our study is to compare mortality of oldest-old in Canada to results from
Graduation methods are not necessary in the context of our study, though they are still very
useful. In fact, official life tables (like the Canadian or the U.S. Life Tables) will always require
some graduation because of small numbers of deaths at very old ages (above 100 years old).
3.2 Estimating the Deaths of Non Extinct Generations: The Survival Ratio Method
One drawback of the method of extinct generations is the need to wait until all members of
the same cohort have died before being able to fully estimate the population at a given age.
However, the Survival Ratio method can be used to estimate population figures for non-extinct
cohorts at a given moment in time [20] [34] [43]. Depoid [10] claims to obtain very adequate
results based on the assumption that the deaths of non-extinct cohorts are distributed by age until
extinction in the same way as deaths of earlier, already extinct, cohorts; in other words, it
assumes that mortality is invariable. In this study, we have chosen 110 years as the age at which
cohorts become extinct; for the cohorts born between 1841 to 1884, very few deaths reportedly
4 Findings
4.1 Data Quality of Deaths and Population
Using a variety of measures of reliability, we first evaluate the quality of mortality data. We
then attempt to assess whether or not the censuses provide accurate figures for the population
aged eighty and over by comparing these figures with those of populations calculated from
deaths.
4.1.1 Age Heaping and Generation Heaping for Deaths
We tested the quality of Canadian data on deaths at advanced ages for the problems of age
heaping at ages 80, 85, 90 years and so on, by calculating the Whipple’s index used to measure
this type of attraction; results revealed no significant signs of age heaping either for the
population aged 80 years and above or among centenarians.
It was also possible to verify an attraction for the younger generation at death, often
resulting from calculating the year of birth as the difference between the date of the current year
and the age at death. For instance, a person dying at 100 years in 1995 was not necessarily born
in 1895 (1995-100=1885); he might just as easily have been born in 1884. We would expect
deaths to be distributed equally between the younger (1885) and older (1884) cohorts [Note 2].
We used the Generation Heaping Indicator (GHI) - the ratio of deaths attributed to the older
cohort to deaths attributed to the younger one - to estimate the accuracy of cohort declaration.
Canadian mortality statistics on deaths of centenarians for the periods 1951-1960 and
1961-1970 are subject to a strong attraction for the younger cohort. The quality of death
declarations for the year of birth appears to improve at extreme ages, although the number of
deaths attributed to the older cohort are still underestimated. Moreover, an improvement over
time meant that for the 1991-1995 period, the GHI was close to unity for octogenarians and is
comparable to those of France, Sweden and Japan (countries with high quality data) over the age
4.1.2 Highest Age at Death Comparison
The reliability of mortality statistics in Canada can be estimated by comparing the number
of registered deaths at oldest ages to the equivalent figures for other countries known to have
high quality data (countries where age at death is carefully scrutinized and accurately recorded).
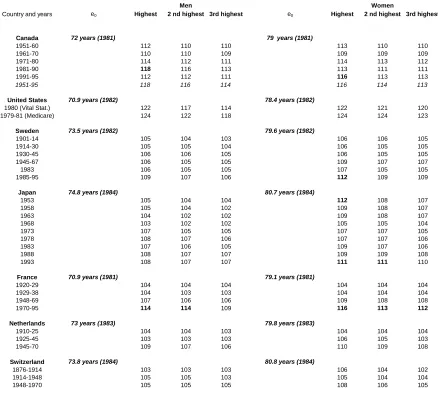
Table 1 shows that the highest age at death reported in Canada exceeds that recorded in all
countries except the United States. The highest age at death among the European countries and
Japan over a long period of observation rarely exceeded 110 years. There were, in fact, only few
cases on record: one woman who died aged 112 in Sweden (1985-1995); two others aged 112
and 111 in Japan (1953 and 1993) and a few who died between age 112 and 116 in France
(1970-1995). For men, the highest reported age at death was 114 years old in France during the period
1970-1995 [Note 3]. In Canada, the highest age of registered deaths for the period 1951-1995
was substantially higher, at 118 years for men and 116 years for women.
TABLE 1
In these reference countries, the maximum age at death tended to increase over time, with
growing numbers of individuals surviving to old ages. In Canada, this trend is absent, even
though, according to the Canadian life tables, 25% more women and 15% more men survived
until 80 years in 1991 than in 1951. Moreover, the oldest age at death in Canada was observed in
the male population, an unexpected finding given the mortality patterns it shares with other
industrialized nations: higher mortality at advanced ages for men than women, and a lower
number of male than female centenarians. Finally, this table also shows that the second and third
highest ages at death were considerably higher for Canada than for all other countries except the
United States, confirming that the highest reported age at death was not a unique case of
4.1.3 Overstatement of Age at Death among Centenarians
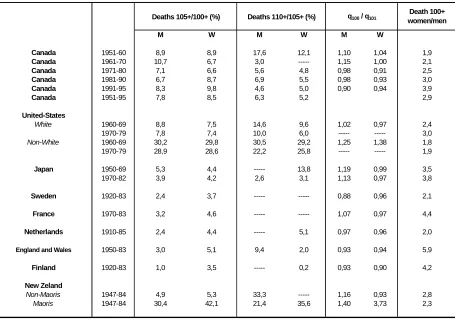
Kannisto [22] has demonstrated the utility of other indicators developed to measure the
reliability of data on centenarians. Those pertaining to age overstatement, age heaping and sex
selection have been tested in countries with reliable data. In those countries, the rapid depletion
of the population at these ages, on the one hand, and the increasing size of successive cohorts of
centenarians, on the other, mean that the proportion of those aged 105 and over among all
centenarians is expected to be less than 5 %, and to be smaller for men than women (table 2).
Reference countries with population registers judged to have a high standard of mortality
statistics, such as Sweden, Finland, France, England and Wales, adhere to this norm. The ratio
for Canadian data, however, exceeds it, at 7.8 % for men and 8.5 % for women during the
1951-1995 period, indicating overstatement of age at death in Canadian data.
TABLE 2
The second indicator expects that the percentage aged 110 and over among those aged 105
and over will be smaller than the first indicator (105 years + / 100 years +). This condition was
respected only among the female populations of Japan, England and Finland. On this point,
Canadian data fulfills the assumption, except during the fifties when data reliability was lower.
Nonetheless, there is evidence of some overstatement of age in the fact that the first criterion was
not respected.
The third indicator is based on the observation that the probability of death at age 101 is
higher than at age 100, and thus that the ratio of mortality risks at 100 and 101 years should be
below unity (q100 / q101 < 1). An indicator significantly higher than 1 signals an attraction towards
declaring death at the exact age of 100 years. This type of error is absent in the majority of
reference countries. To verify this indicator for Canadian data, the probabilities from the
population estimated by the method of extinct generations were preferred to those published by
Statistics Canada. Our tests showed that, at least during the fifties and sixties, Canadian data was
however, the problem disappears, pointing to a gradual improvement in Canadian mortality
statistics at advanced ages over the last half of the twentieth century.
The final indicator is the ratio of women’s deaths to those of men. For Canada, this ratio
remained stable at around 2 for the decades 1951-1960 and 1961-1970, but had doubled by the
period 1991-1995. This provides further evidence of an age overstatement in death declarations
among males over 100 years old in earlier decades. The improvement in data quality has raised
this ratio to levels that are probably more accurate for Canada and comparable to those of France,
Japan and Finland, in recent years.
In summary, Canadian data on deaths do indeed suffer from age overstatement at extreme
ages, over 100 or 110 years old, and more so for men than women. The comparison does suggest,
however, that Canadian data are more reliable than US mortality statistics that show an even
stronger tendency to overestimate age at death. Moreover, since 1951, the quality of death data
seems to have improved in Canada.
4.1.4 Overestimation of Centenarians in Canadian Censuses
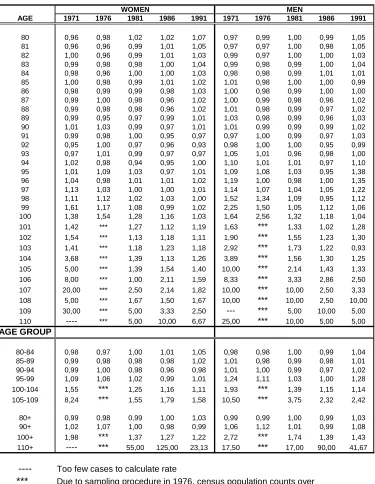
Table 3 presents the ratio of enumerated population (census population) to population
calculated from deaths (population estimates) for Canada by single year of age or age group, sex,
and census year. A ratio superior to 1 indicates that the census figures are higher than the
estimated population. The accuracy of the figures varies from one census to another but in
general, the ratio oscillates around unity between the ages of eighty and one hundred years for
women and ninety-five years for men. From then on, however, census counts clearly
overestimate the population. Nonetheless, this problem has decreased over the period 1971-1991
by one third for female centenarians (from 1.98 to 1.22) and by half for males (from 2.72 to
1.43).
The evolution of population estimates at advanced ages, by age group, for Canada and for a
group of industrialized countries with high quality data are compared in Table 4. Kannisto’s
database [20] is the source of information for these reference countries. The proportion of
individuals aged 90-99 years to those aged 80 years and over is clearly higher in Canada in 1950
and 1990. In 1991, the proportion of centenarians to the population aged 80 years and over in
Canada was five times that in the other industrialized nations: one centenarian for 200, compared
with one for 1000 in the reference countries. It is possible that overestimating the age of the
oldest-old in Canada may have caused this discrepancy.
TABLE 4
The highest proportion of centenarians in Europe, in 1990, reached between 60-70 per
million in the total population, in countries where the demographic transition occurred early and
where mortality at advanced ages had been low for some time [20]. According to the estimated
populations, Canada had 2884 centenarians in 1991: 106 centenarians per million of the total
population [Note 4]. This is twice the average level known in the reference countries, at 45
centenarians per million of population. Thus, although the population estimation has reduced the
overestimation of the number of centenarians, the number still appears quite high compared to
4.2 Canadian Mortality and International Comparison
4.2.1 Canadian Mortality at Advanced Ages
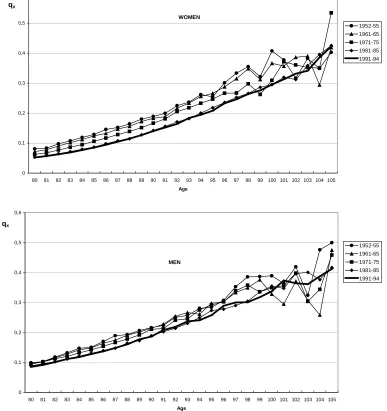
Figure 2 illustrates the evolution of estimated probabilities of dying (qx) at advanced ages
for Canada, by age and sex, for certain five-year periods in the last half of the twentieth century.
These probabilities, rising gradually with age, display a pattern similar to that found in the
official life tables; nonetheless, from 100 years onwards, important fluctuations appear, linked to
the absence of smoothing, to the small number of deaths at extreme ages, and to the complete
absence of deaths at some ages.
FIGURE 2
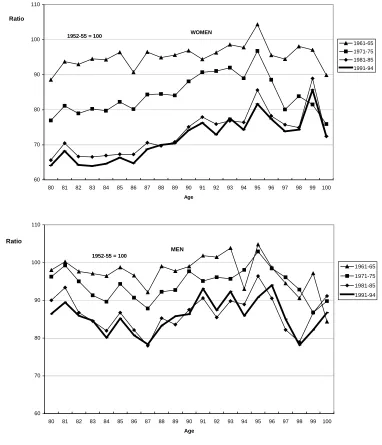
Figure 3 makes it easier to appreciate the recent development of mortality estimated at
advanced ages, by presenting a series of ratios relating probabilities for more recent periods to
those for the period 1952-1955, which becomes therefore the point of comparison, and takes the
value of 100. Female mortality between 80 and 100 years dropped sharply during the period
(35%: 80-89 years, 25 % and less: 90+). For males, it is more difficult to distinguish a clear
pattern in mortality decline over time because of great fluctuations from one age to another; but it
has clearly declined much less markedly since the fifties than has female mortality. The greatest
progress for men has been among octogenarians for whom mortality has declined between 10%
and 20% during the period. For each decade, male mortality up to 95 years was substantially
higher than that of females, and this difference has increased in magnitude over the last forty
years, passing from 20% for octogenarians in the fifties to 40% for the period 1991-94.
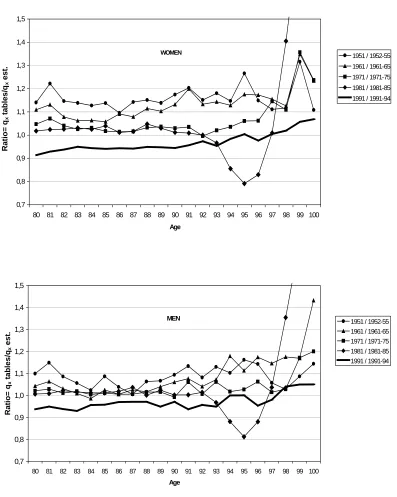
4.2.2 Canadian Life Tables and estimated probabilities of dying
The ratios of the official life table probabilities of dying (1950-1952 to 1990-1992) to our
estimated ones (1952-1955 to 1991-1994), by age and sex, are presented in Figure 4. A ratio
inferior to 1 indicates that estimated mortality is higher than that published in the official life
tables. With the improved quality of mortality data, we expected our estimated measures for
more recent periods to be higher, as Statistics Canada’s tables are likely to underestimate
mortality at advanced ages. The results were not as obvious as predicted: in 1991 only, the
estimated probabilities exceeded those published by Statistics Canada and the difference is not
very large, less than 10%.
FIGURE 4
In 1991, for instance, the probability that individuals reaching the age of 80 survive to 100
years is slightly overestimated in the official life tables. For a woman, the estimated probability
was 40 ‰ compared with 43 ‰ in the official life tables; the equivalent probabilities for men are
13 ‰ and 15 ‰, respectively.
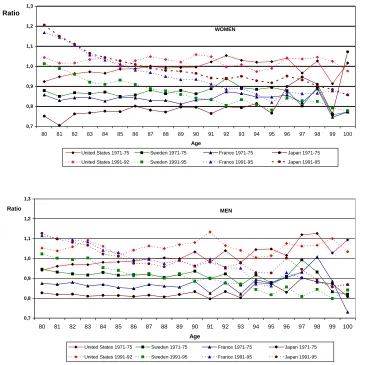
4.2.3 International comparisons on the basis of estimated probabilities of dying
In this section, estimated probabilities of dying for Canada are compared with other
countries for which these probabilities, calculated by the same method, are available in the
Berkeley Mortality Database [43]. Figure 5 illustrates the relationship between Canadian
probabilities and those of the USA, France, Sweden and Japan, by age (from 80 to 100 years),
sex, and time period (1971-1975 and 1991-1995). A ratio inferior to 1 signifies that Canadian
mortality is lower than that of the country under comparison.
Canadian probabilities of dying resemble those observed in the United States; both
countries stand out as having distinctly lower levels than those of Sweden, France and Japan, at
all ages over 80 years in 1971-1975 and, more particularly, over 90 years in 1991-1995. During
the earlier period, female mortality in Canada was, on average, 15 to 20% lower than that
observed in the other countries at that time. For the 1991-1995 period, mortality is lower in
France and in Japan from age 80 to 85; then, the gap between Canada and the other countries
widens gradually, in Canada’s favor, up to 95 years old where, as for the period 1971-75, the
mortality of Canadian women is about 10 to 20% lower. For men, the small numbers at each age
lead to greater fluctuations in the mortality ratios, making it more difficult to perceive a distinct
profile. However, the mortality of American males is still lower than that estimated for Canada.
For the first period, Swedish, French and Japanese probabilities of dying are clearly higher than
Canadian ones, from 10% to 20%. For the 1991-1995 period, Canada shows a lower mortality
above age 85 only. These results hint at the possibility of a profile peculiar to North American
mortality.
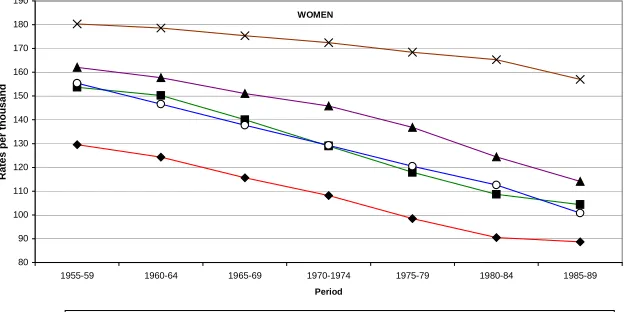
4.2.4 International comparisons on the basis of age-standardized death rates
Kannisto [20] has suggested using Age-Standardized Death Rates for individuals aged
between 80 and 99 years [Note 5]. Out of a pre-selected sample of countries with high quality
data, four groups were created according to the level and evolution of mortality: low (Denmark,
The Netherlands, Norway and Sweden), medium (Austria, Belgium, England, Finland and West
Germany), high (Czechoslovakia, East Germany and Hungary), and rapid decline (France and
Switzerland).
In Figure 6, Canadian data indicate a very low level of mortality, inferior to that of the
countries categorized as having low mortality. This difference lessens during the period, in
particular for the female population. In 1985-1989, for example, Canadian rates stood at 89 ‰
countries with low and medium mortality levels and slightly lower than that of countries with
sharply declining mortality. For the high mortality nations, grouped geographically in Eastern
Europe, the reduction in mortality rates at advanced ages during the period was of - 9%.
Mortality decreased at a faster pace from the period 1970-74 onwards for all four groups of
countries, and for Canada. On average, the speed of decline for those aged over 80 years was
twice as fast for Canada and the reference countries. Female mortality at advanced ages for the
low mortality group, for example, declined by 8.9% between 1955 and 1969, and by 19.1%
between 1970 and 1989. Advances in Canadian female mortality during the latter period were
also higher than during the first, at 11% and 18% respectively.
FIGURE 6
For the period 1985-89, Canada, with an age-standardized death rate for the age range
80-99 of 103.5 ‰, rated before Iceland (105.0 ‰), Japan (111.2 ‰), and before the two countries
classed as having rapidly declining mortality, Switzerland (114.0 ‰) and France (115.9 ‰).
Iceland, like Japan, has been classified among the countries with excellent data quality, and is
even recognized as the country with the most reliable mortality statistics at advanced ages in the
world. In the light of these results, therefore, Canada does indeed have exceptionally low
5 Conclusion
The evaluation of the data quality in Canada suggests that there are some problems
concerning deaths and population counts over the age of 80 years, confirming at least in part the
conclusions of the study made by Kannisto [20]. However, results in section 4.1 show that
Canadian data are quite good up to the age of 100 (generation heaping and age misstatement are
at levels similar to those found in comparable countries) and that the main problems concern the
centenarians (overstatement of age at death and errors in census age declarations).
International comparisons on the basis of two mortality indicators for the age 80 to 100
lead to the same conclusion: Canadian mortality is lower than most European countries. The best
match is still with the United States.
So, we can conclude that, although there are some problems with the data, there is some
strong evidence of a lower mortality at older ages in Canada. In fact, the main comparisons
shown in section 4.2 concern the 80-99 age interval where Canadian data are quite good.
Can we also conclude that a North American mortality profile exists, as suggested by some
authors [2] [17] [29]? This profile is characterised by relatively high mortality rates below age
65 and relatively low mortality rates above age 80, when compared to other low-mortality
countries. According to our results, Canadian mortality corresponds to the latter part of this
definition; however, mortality below age 65 in Canada is much lower than in the United States
and more comparable to many European countries. Although Canada and the United States share
the same low mortality level for the oldest-old, their mortality profiles are probably different.
Our results show that Canada and the United States also share the same types of error in
their data for the oldest-old. This is not a totally surprising result, because in the two countries it
is very difficult to ascertain the date of birth due to the absence of birth registers (before 1921 in
Canada). However, recent findings from a record linkage study by Hill et al. [16] show that the
American data concerning the age at death of older persons are quite reliable, giving more
support to the lower level of U.S. mortality rates above age 80 (at least among native whites).
not easy. However, some reconciliation can be done with administrative files (health records, for
example). Another avenue would be to estimate mortality using only data from the Province of
Quebec, where death registration is very good and age at death can be verified against baptism
register before 1926 [5] [11]. Quebec has the added advantage of a universal health insurance
program (Medicare) with a file on all beneficiaries. This would enable us to compare data from
vital statistics and from the census to this file. These procedures would lead to a better
6 Acknowledgements
This research is supported by a grant from SSHRCC (Social Science and Humanities
Research Council of Canada), Grant 410-97-1090. The authors are very grateful to Statistics
Canada for providing the data set. This paper has benefited from useful comments by Jacques
Notes
1. First results of this research were presented at the 1998 Canadian Population Society Annual
Meeting [26]; more detailed results are available in [25].
2. The hypothesis about equal distribution of deaths between the younger and the older cohort is
a simplification. In fact, because of rapidly declining numbers of persons with age, combined
with a slow increase in the death rate, we would expect more deaths in the younger cohort
(lower triangle of the Lexis diagram). However, there is a compensating effect because the
upper triangle (older cohort) contains more winter months, and thus deaths at older ages tend
to be distributed almost equally between the two cohorts.
3. The exceptional case of Jeanne Calment, a French woman who died in 1997 at the age of 122
years and 5 months is not mentioned in this paper. Other validated cases of exceptional
longevity are also omitted: Marie Louise Meilleur, a French Canadian woman who died in
1998 at age 117 and Christian Mortensen, an American man who died in 1998 at age 115.
4. According to the census figures, Canada had 3685 centenarians in 1991: 135 centenarians per
million of the total population.
5. To reduce annual fluctuations, death rates were smoothed twice through a moving average,
over three and five years, between 1955-59 and 1985-1989. To cancel the effect of structural
variations in calculating the rates, Sweden’s population distribution by five-year age groups
was used for all countries (Sweden: 80-84 years: 0,6360; 85-89 years: 0,2743; 90-94 years:
0,0774 and 95-99 years: 0,0123). Given that fewer men die over the age of 80 years, rates for
References
1. Ahlburg, D. A. and J. W. Vaupel. "Alternative Projections of the U.S. Population."
Demography, 1990, 27 (4): 639-652.
2. Bennett, N. G. and S. J. Olshansky. "Forecasting US Age Structure and Future of Social
Security: The Impact of Adjustments to Official Mortality Schedules." Population and
Development Review, 1996, 22 (4): 703-727.
3. Bourbeau, R., J. Légaré and V. Émond. New Birth Cohort Life Tables for Canada and Quebec,
1801-1991. 1997, Ottawa, Demographic Document, Current Demographic Analysis, no. 3,
Statistics Canada, catalogue no. 91F0015MPE.
4. Carnes, B. A. and S. J. Olshansky. "Evolutionary Perspectives on Human Senescence."
Population and Development Review, 1993, 19 (4): 793-806.
5. Charbonneau, H. "La Rubrique du P.R.D.H. : Les centenaires officiels du XIXe siècle",
Mémoires de la Société généalogique canadienne-française, 1991, 42 : 219-226.
6. Coale, A. J. and G. Caselli. "Estimation of the Number of Persons at Advanced Ages from the
Number of Deaths at Each Age in the Given Year and Adjacent Years." Genus, 1990, 66(1-2):
1-23.
7. Coale, A. J. and E. E.Kisker. "Defect in Data on Old-Age Mortality in the United-States: New
Procedure for calculating Mortality Schedules and Life Tables at the Highest Ages." Asian and
Pacific Population Forum, 1990, 4 (1): 1-31.
8. Coale, A J. and E. E. Kisker. "Mortality Crossovers: Reality of Bad Data?" Population Studies,
1986, 40: 389-401
9. Condran G. A., C. L. Himes and S. H. Preston. "Old Age Mortality Patterns in Low Mortality
Countries: An Evaluation of Population and Death Data at Advanced Ages, 1950 to Present."
Population Bulletin of the United Nations, 1991, 30: 23-60.
11.Desjardins, B. "Validation of Extreme Longevity Cases in the Past: the French-Canadian
Experience ", 1999, in: Jeune, B. and Vaupel, J. (Eds). Validation of Exceptional Longevity.
Odense University Press, Odense Monographs of Population Aging 6, 65-73.
12.Elo, I.T. and S.H. Preston. "Estimating African-American mortality from inaccurate data."
Demography, 1994, 31 (3): 427-458.
13.Fries, J. F. "Aging, Natural Death, and the Compression of Morbidity." New England Journal
of Medicine, 1980, 303: 130-135.
14.Fries, J. F. "The Compression of Morbidity: Near or Far?" Milbank Quarterly, 1989, 67 (2):
208-231.
15.Heligman, L. and J. H. Pollard. "The Age Pattern of Mortality." Journal of Institute of
Actuaries, 1980, 107: 49-75.
16.Hill, M.E., S.H. Preston and I. Rosenwaike. "Age Reporting among White Americans Aged
85+: Results of a Record Linkage Study". 1999, Paper presented at the 1999 PAA Annual
Meeting, New York, 23-25 March 1999.
17.Himes, C. L. "Age Patterns of Mortality and Cause-of-Death Structures in Sweden, Japan, and
the United States." Demography, 1994, 31 (4): 633-50.
18.Horiuchi, S. and J. R. Wilmoth. "Deceleration in the Age pattern of Mortality at Older Ages."
Demography, 1998, 35 (4): 391-412.
19.Horiuchi, S. and J. R. Wilmoth. "Age Patterns of the Life Table Aging Rate for Major Causes
of Death in Japan, 1951-1990. " Journal of Gerontology: Biological Sciences, 1997, 52 (1):
67-77.
20.Kannisto, V. Development of Oldest-Old Mortality, 1950-1990: Evidence from 28 Developed
Countries. 1994, Monographs on Population Aging No 1. Odense, Denmark, Odense
University Press, 108.
21.Kannisto, V., J. Lauritsen, R. Thatcher and J. W. Vaupel. "Reductions in Mortality at Advanced
Ages: Several Decades of Evidence from 27 Countries." Population and Development Review,
22.Kannisto, V. "On the Survival of Centenarians and the Span of Life." Population Studies, 1988,
42: 389-406.
23.Kestenbaum, B. "Recent Mortality of the Oldest Old, from Medicare Data", 1997, Paper
presented at 1997 PAA Meeting, New Orleans, May 9-11.
24.Kestenbaum, B. "A Description of the Extreme Aged Population Based on Improved Medicare
Enrollment Data." Demography, 1992, 29 (4 ), 565-580.
25.Lebel, A. Évolution de la mortalité canadienne aux âges avancés de 1951 à 1995. 1999,
Montréal, Département de démographie, Université de Montréal, M.Sc. Thesis.
26.Lebel, A. and R. Bourbeau. "Mortality Among the Oldest-Old in Canada: Differential Mortality
Patterns of Poor Data?", 1998, Paper presented to the Annual Canadian Population Society
Meeting, Ottawa, June 4-6, 1998.
27.Manton, K.G. "Mortality and Life Expectancy Change Among the Oldest Old." In: Suzman,
R.M., Willis, D.P. and Manton, K.G. editors, The Oldest Old. 1992. New York, Oxford
University Press, p.157-182.
28.Manton, K.G., E. Stallard and H. D. Tolley. "Limits to Human Life Expectancy: Evidence,
Prospects and Implication.", Population and Development Review, 1991, 17 (4): 603-637.
29.Manton, K. G. and J. W. Vaupel. "Survival After the Age of 80 in the United States, Sweden,
France, England and Japan.", The New England Journal of Medicine, 1995, 333 (18):
1232-1235.
30.Preston, S.H., I. Elo and Q. Stewart. "Effects of Age Misreporting on Mortality Estimates at
Older Ages", Population Studies, 1999, 53: 165-177.
31.Olshansky, S. J. "Estimating the Upper Limits to Human Longevity." Population Today, 1992,
20 (1): 6-8.
32.Olshansky, S.J., Carnes, B. A. and C.K. Cassel. "In Search of Methuselah: Estimating the
34.Thatcher, A.R. "Trends in Number and Mortality at High Ages in England and Wales."
Population Studies, 1992, 46: 411-426.
35.United Nations. United Nations Demographic Yearbook, 1991, New York : United Nations.
36.Vaupel, J. and B. Jeune. "The Emergence and Proliferation of Centenarians" in Exceptional
Longevity: From Prehistory to Present, 1995, Odense University Press, p. 109 –116.
37.Vaupel, J. and B. Jeune. "The Future of Mortality at Older Ages in Developed Countries" in:
Wolfgang Lutz, Editor. The Future Population of the World: What Can we Assume Today?,
1994, International Institute for Applied Systems Analysis, Earthscan Publications Ltd.,
London, p. 295-315.
38.Vincent, P. "La mortalité des vieillards". Population, 1951, 6 (2): 181-204.
39.Wang, Z., Y. Zeng, B. Jeune and J. W. Vaupel. "Age Validation of Han Chinese
Centenarians.", Genus, 1998, LIV (1-2):123-141.
40.Wilmoth, J. R. " The Future of Human Longevity: A Demographer’s Perspective." Science,
1998, 395-397.
41.Wilmoth, J. R. "Mortality projections for Japan: a comparison of four methods. In: Graziella
Caselli and Alan D. Lopez, editors, Health and mortality among elderly populations, 1996.
Clarendon Press: Oxford, England; International Union for the Scientific Study of Population
[IUSSP], pp. 266-287.
42.Wilmoth, J.R. and H. Lundström. "Extreme Longevity in Five Countries: Presentation of
Trends with Special Attention to Issues of Data Quality." European Journal of
Population/Revue Européenne de Démographie, 1996, 12 (1): 63-93.
43.Wilmoth, J.R. The Berkeley Mortality Database. 1999.
Table 1:
Highest ages at death by sex, and life expectancy at birth, for differents periods in Canada and
other countries
Country and years e0 Highest 2 nd highest 3rd highest e0 Highest 2 nd highest 3rd highest
Canada 72 years (1981) 79 years (1981)
1951-60 112 110 110 113 110 110
1961-70 110 110 109 109 109 109
1971-80 114 112 111 114 113 112
1981-90 118 116 113 113 111 111
1991-95 112 112 111 116 113 113
1951-95 118 116 114 116 114 113
United States 70.9 years (1982) 78.4 years (1982)
1980 (Vital Stat.) 122 117 114 122 121 120
1979-81 (Medicare) 124 122 118 124 124 123
Sweden 73.5 years (1982) 79.6 years (1982)
1901-14 105 104 103 106 106 105
1914-30 105 105 104 106 105 105
1930-45 106 106 105 106 105 105
1945-67 106 105 105 109 107 107
1983 106 105 105 107 105 105
1985-95 109 107 106 112 109 109
Japan 74.8 years (1984) 80.7 years (1984)
1953 105 104 104 112 108 107
1958 105 104 102 109 108 107
1963 104 102 102 109 108 107
1968 103 102 102 105 105 104
1973 107 105 105 107 107 105
1978 108 107 106 107 107 106
1983 107 106 105 109 107 106
1988 108 107 107 109 109 108
1993 108 107 107 111 111 110
France 70.9 years (1981) 79.1 years (1981)
1920-29 104 104 104 104 104 104
1929-38 104 103 103 104 104 104
1948-69 107 106 106 109 108 108
1970-95 114 114 109 116 113 112
Netherlands 73 years (1983) 79.8 years (1983)
1910-25 104 104 103 104 104 104
1925-45 103 103 103 106 105 103
1945-70 109 107 106 110 109 108
Switzerland 73.8 years (1984) 80.8 years (1984)
1876-1914 103 103 103 106 104 102
1914-1948 105 105 103 105 104 104
1948-1970 105 105 105 108 106 105
Men Women
SOURCES:
Death Data:
Countries other than Canada:
Coale et Kisker, 1990; table 1: Official vital statistics of USA and demographic yearbooks of the individual countries. Berkeley Mortality Database: Japan, 1988,1993; France, 1970-95; Sweden, 1985-95.
Canada:
Deaths Data, Vital statistics, Statistics Canada
Life Expectancy at Birth Data:
Countries other than Canada:
World Health Organisation from Manton (1992), Mortality and Life Expectancy Changes Among the Oldest Old, table 8-1. Canada:
Table 2:
Indicators of data reliability for deaths of centenarians, by sex, in Canada and other countries
M W M W M W
Canada 1951-60 8,9 8,9 17,6 12,1 1,10 1,04 1,9
Canada 1961-70 10,7 6,7 3,0 --- 1,15 1,00 2,1
Canada 1971-80 7,1 6,6 5,6 4,8 0,98 0,91 2,5
Canada 1981-90 6,7 8,7 6,9 5,5 0,98 0,93 3,0
Canada 1991-95 8,3 9,8 4,6 5,0 0,90 0,94 3,9
Canada 1951-95 7,8 8,5 6,3 5,2 2,9
United-States
White 1960-69 8,8 7,5 14,6 9,6 1,02 0,97 2,4
1970-79 7,8 7,4 10,0 6,0 --- --- 3,0
Non-White 1960-69 30,2 29,8 30,5 29,2 1,25 1,38 1,8
1970-79 28,9 28,6 22,2 25,8 --- --- 1,9
Japan 1950-69 5,3 4,4 --- 13,8 1,19 0,99 3,5
1970-82 3,9 4,2 2,6 3,1 1,13 0,97 3,8
Sweden 1920-83 2,4 3,7 --- --- 0,88 0,96 2,1
France 1970-83 3,2 4,6 --- --- 1,07 0,97 4,4
Netherlands 1910-85 2,4 4,4 --- 5,1 0,97 0,96 2,0
England and Wales 1950-83 3,0 5,1 9,4 2,0 0,93 0,94 5,9
Finland 1920-83 1,0 3,5 --- 0,2 0,93 0,90 4,2
New Zeland
Non-Maoris 1947-84 4,9 5,3 33,3 --- 1,16 0,93 2,8
Maoris 1947-84 30,4 42,1 21,4 35,6 1,40 3,73 2,3
--- Too few cases to calculate rate
Death 100+ women/men Deaths 105+/100+ (%) Deaths 110+/105+ (%) q100 / q101
SOURCES:
For countries other than Canada: Table 1 from Kannisto (1988)
Table 3:
Ratio of census population to population estimated from deaths, by age and sex,
census years 1971-1991, Canada
WOMEN MEN
AGE 1971 1976 1981 1986 1991 1971 1976 1981 1986 1991
80 0,96 0,98 1,02 1,02 1,07 0,97 0,99 1,00 0,99 1,05 81 0,96 0,96 0,99 1,01 1,05 0,97 0,97 1,00 0,98 1,05 82 1,00 0,96 0,99 1,01 1,03 0,99 0,97 1,00 1,00 1,03 83 0,99 0,98 0,98 1,00 1,04 0,99 0,98 0,99 1,00 1,04 84 0,98 0,96 1,00 1,00 1,03 0,98 0,98 0,99 1,01 1,01 85 1,00 0,98 0,99 1,01 1,02 1,01 0,98 1,00 1,00 0,99 86 0,98 0,99 0,99 0,98 1,03 1,00 0,98 0,99 1,00 1,00 87 0,99 1,00 0,98 0,96 1,02 1,00 0,99 0,98 0,96 1,02 88 0,99 0,98 0,98 0,96 1,02 1,01 0,98 0,99 0,97 1,02 89 0,99 0,95 0,97 0,99 1,01 1,03 0,98 0,99 0,96 1,03 90 1,01 1,03 0,99 0,97 1,01 1,01 0,99 0,99 0,99 1,02 91 0,99 0,98 1,00 0,95 0,97 0,97 1,00 0,99 0,97 1,03 92 0,95 1,00 0,97 0,96 0,93 0,98 1,00 1,00 0,95 0,99 93 0,97 1,01 0,99 0,97 0,97 1,05 1,01 0,96 0,98 1,00 94 1,02 0,98 0,94 0,95 1,00 1,10 1,01 1,01 0,97 1,10 95 1,01 1,09 1,03 0,97 1,01 1,09 1,08 1,03 0,95 1,38 96 1,04 0,98 1,01 1,01 1,02 1,19 1,00 0,98 1,00 1,35 97 1,13 1,03 1,00 1,00 1,01 1,14 1,07 1,04 1,05 1,22 98 1,11 1,12 1,02 1,03 1,00 1,52 1,34 1,09 0,95 1,12 99 1,61 1,17 1,08 0,99 1,02 2,25 1,50 1,05 1,12 1,06 100 1,38 1,54 1,28 1,16 1,03 1,64 2,56 1,32 1,18 1,04 101 1,42 *** 1,27 1,12 1,19 1,63 *** 1,33 1,02 1,28 102 1,54 *** 1,13 1,18 1,11 1,90 *** 1,55 1,23 1,30 103 1,41 *** 1,18 1,23 1,18 2,92 *** 1,73 1,22 0,93 104 3,68 *** 1,39 1,13 1,26 3,89 *** 1,56 1,30 1,25 105 5,00 *** 1,39 1,54 1,40 10,00 *** 2,14 1,43 1,33 106 8,00 *** 1,00 2,11 1,59 8,33 *** 3,33 2,86 2,50 107 20,00 *** 2,50 2,14 1,82 10,00 *** 10,00 2,50 3,33 108 5,00 *** 1,67 1,50 1,67 10,00 *** 10,00 2,50 10,00 109 30,00 *** 5,00 3,33 2,50 --- *** 5,00 10,00 5,00 110 ---- *** 5,00 10,00 6,67 25,00 *** 10,00 5,00 5,00
AGE GROUP
80-84 0,98 0,97 1,00 1,01 1,05 0,98 0,98 1,00 0,99 1,04 85-89 0,99 0,98 0,98 0,98 1,02 1,01 0,98 0,99 0,98 1,01 90-94 0,99 1,00 0,98 0,96 0,98 1,01 1,00 0,99 0,97 1,02 95-99 1,09 1,06 1,02 0,99 1,01 1,24 1,11 1,03 1,00 1,28 100-104 1,55 *** 1,25 1,16 1,11 1,93 *** 1,39 1,15 1,14 105-109 8,24 *** 1,55 1,79 1,58 10,50 *** 3,75 2,32 2,42
80+ 0,99 0,98 0,99 1,00 1,03 0,99 0,99 1,00 0,99 1,03 90+ 1,02 1,07 1,00 0,98 0,99 1,06 1,12 1,01 0,99 1,08 100+ 1,98 *** 1,37 1,27 1,22 2,72 *** 1,74 1,39 1,43 110+ ---- *** 55,00 125,00 23,13 17,50 *** 17,00 90,00 41,67
---- Too few cases to calculate rate
*** Due to sampling procedure in 1976, census population counts over 100 years old are not reliable
Table 4:
Proportion of the oldest-old and centenarians (estimated), by sex, in Canada and other
industrialised countries
Canada O ther countries (1) Age Sex
Num ber % 80+ Num ber % 80+ Num ber % 80+ Num ber % 80+
80-89 M en 68.321 92,6% 195.747 89,4% 1.164.309 95,9% 3.633.110 91,7%
W om en 80.436 90,6% 351.981 83,6% 1.850.361 94,2% 7.654.426 88,4%
T otal 148.757 91,5% 547.728 85,6% 3.014.670 94,8% 11.317.736 89,7%
90-99 M en 5.394 7,3% 22.647 10,3% 49.577 4,1% 297.407 7,5%
W om en 8.211 9,3% 66.815 15,9% 113.855 5,8% 988.886 11,4%
T otal 13.605 8,4% 89.462 14,0% 163.432 5,1% 1.286.293 10,2%
100+ M en 63 0,1% 567 0,3% 173 0,0% 2.945 0,1%
W om en 112 0,1% 2.317 0,6% 636 0,0% 14.890 0,2%
T otal 175 0,1% 2.884 0,5% 809 0,0% 17.835 0,1%
80+ M en 73.778 100% 218.961 100% 1.214.059 100% 3.963.662 100%
W om en 88.759 100% 421.113 100% 1.964.852 100% 8.658.202 100%
T otal 162.537 100% 640.074 100% 3.178.911 100% 12.621.864 100%
Canada O ther countries (2 and 3)
Num ber Proportion Num ber Proportion Num ber Proportion Num ber Proportion
80+ M en 106.980 1,2% 218.961 1,6
(% T ot. Pop.) W om en 132.493 1,5% 421.113 3,0
T otal 239.473 1,3% 640.074 2,3 6.139.172 1,4 15.783.777 3,0
(0.92-2.00) (2,17-4,19)
100+ M en 106 11,5 567 42,1
(per m illion W om en 150 16,6 2.317 167,4
inhabitants) T otal 256 14,0 2.884 105,7 1.753 5,3 18.394 45,1
Max (60-70)
T otal Pop. M en 9.218.893 100,0% 13.454.580 100,0%
W om en 9.019.354 100,0% 13.842.280 100,0%
T otal 18.238.247 100,0% 27.296.860 100,0% 431 828 000 2 100,0% 518 649 000 2 100,0%
330 754 717 3 100,0% 407 849 224 3 100,0%
Population on January 1st
(1) Austria, Belgium , Denm ark, England and W ales, Finland, France, G erm any (W est), Italy, Japan, Norway, Sweden and Switzerland.
(2) 80+ and T otal Population: Austria, Netherlands, New Zealand, Denm ark, England and W ales, Finland, France, G erm any, Italy, Japan, Norway, Sweden, Switzerland, Belgium , Chili, Czechoslovakia, Estonia, Hungary, Iceland, Latvia, Luxem burg, Portugal, Scotland, Spain.
(3) 100+ and Total Population: Austria, Iceland, Netherlands, New Zealand, Denm ark, England and W ales, Finland, France, G erm any (W est), Italy, Japan, Norway, Sweden and Switzerland.
1952 1991 1950 1990
1990 1960
1991 1961
SOURCES:
Industrialised countries: Kannisto, 1994.
Canada: Estimated Population on July 1st
Figure 1:
Probabilities of dying by single year of age between ages 80 and 106, and by sex,
Canadian Life Tables, 1951-1991.
0,00 0,10 0,20 0,30 0,40 0,50 0,60 0,70 0,80 0,90 1,00
80 82 84 86 88 90 92 94 96 98 100 102 104 106
Age qx 1951 1961 1971 1981 1991 WOMEN 0,00 0,10 0,20 0,30 0,40 0,50 0,60 0,70 0,80 0,90 1,00
80 82 84 86 88 90 92 94 96 98 100 102 104 106
Figure 2:
Estimated probabilities of dying by single year of age between 80 and 105,
and by sex, periods 1952-1955 to 1991-1994, Canada.
0 0,1 0,2 0,3 0,4 0,5 0,6
80 81 82 83 84 85 86 87 88 89 90 91 92 93 94 95 96 97 98 99 100 101 102 103 104 105
Age qx
1952-55 1961-65 1971-75 1981-85 1991-94
WOMEN
0 0,1 0,2 0,3 0,4 0,5 0,6
80 81 82 83 84 85 86 87 88 89 90 91 92 93 94 95 96 97 98 99 100 101 102 103 104 105
Age qx
1952-55 1961-65 1971-75 1981-85 1991-94
MEN
Figure 3:
Variation of estimated probabilities of dying at advanced ages by sex and age
since period 1952-1955, Canada (Base 100 = 1952-55).
60 70 80 90 100 110
80 81 82 83 84 85 86 87 88 89 90 91 92 93 94 95 96 97 98 99 100
Age
Ratio
1961-65 1971-75 1981-85 1991-94
1952-55 = 100 WOMEN
60 70 80 90 100 110
80 81 82 83 84 85 86 87 88 89 90 91 92 93 94 95 96 97 98 99 100
Age
Ratio
1961-65
1971-75
1981-85
1991-94
1952-55 = 100
MEN
Figure 4:
Ratio of Canadian Life Tables probabilities of dying to estimated probabilities of dying,
by age and sex, 1952-1955 to 1991-1994 (Ratio = qx tables / qx estimated)
0,7 0,8 0,9 1,0 1,1 1,2 1,3 1,4 1,5
80 81 82 83 84 85 86 87 88 89 90 91 92 93 94 95 96 97 98 99 100
Age Ra ti o= q x t a b les/q x est .
1951 / 1952-55 1961 / 1961-65 1971 / 1971-75 1981 / 1981-85 1991 / 1991-94 MEN 0,7 0,8 0,9 1,0 1,1 1,2 1,3 1,4 1,5
80 81 82 83 84 85 86 87 88 89 90 91 92 93 94 95 96 97 98 99 100
Age Rat io= q x t a b les/q x est .
1951 / 1952-55
1961 / 1961-65
1971 / 1971-75
1981 / 1981-85
1991 / 1991-94 WOMEN
Figure 5:
Ratio of estimated probabilities of dying by age and sex, Canada compared to other countries, for
periods 1971-1975 and 1991-1995 (Ratio = Canada / Other country)
0,7 0,8 0,9 1,0 1,1 1,2 1,3
80 81 82 83 84 85 86 87 88 89 90 91 92 93 94 95 96 97 98 99 100
Age Ratio
United States 1971-75 Sweden 1971-75 France 1971-75 Japan 1971-75 United States 1991-92 Sweden 1991-95 France 1991-95 Japan 1991-95
WOMEN
0,7 0,8 0,9 1,0 1,1 1,2 1,3
80 81 82 83 84 85 86 87 88 89 90 91 92 93 94 95 96 97 98 99 100
Age Ratio
United States 1971-75 Sweden 1971-75 France 1971-75 Japan 1971-75 United States 1991-92 Sweden 1991-95 France 1991-95 Japan 1991-95
MEN
Source: Lebel (1999)
Note: Data for Canada are for periods 1971-1975 and 1991-1994
Figure 6:
Age-standardized death rates at 80-99 years, by sex, for Canada and four groups of countries,
1955-1959 to 1985-1989.
80 90 100 110 120 130 140 150 160 170 180 190
1955-59 1960-64 1965-69 1970-1974 1975-79 1980-84 1985-89
Period Rat es p e r t h o u san d
Canada Low Mortality Medium Mortality High Mortality Rapid Mortality Decline
WOMEN 130 140 150 160 170 180 190 200 210 220
1955-59 1960-64 1965-69 1970-1974 1975-79 1980-84 1985-89
Period Rat es p e r t h o u san d
Canada Low Mortality Medium Mortality High Mortality Rapid Mortality Decline
MEN
Source: Canada: Lebel (1999)