AGRONOMY & SOILS
Effect of Differential Irrigation on Accumulation of
Canopy Temperature-Based Heat Units in Cotton
James R. Mahan*, Andrew Young, Paxton Payton, Michael Bange, and John Stout
J.R. Mahan*, P. Payton, and J. Stout, USDA/ARS Plant Stress and Water Conservation Laboratory, 3810 4th St, Lubbock, TX 79415; A. Young, Department of Plant and Soil Sciences, Texas Tech University, Lubbock, TX 79409; and M. Bange, CSIRO Plant Industry, Locked Bag 59 , Narrabri NSW 2390, Australia
*Corresponding author: [email protected] ABSTRACT
Agricultural management decisions are often timed on the basis of accumulated air tempera-ture heat units (AT-heat unit) to coincide with crop growth and development. The relationship between AT-heat unit accumulation and crop
de-velopment is affected by water deficits that alter
the relationship between air and plant canopy temperature. Improved technology for monitor-ing canopy temperatures makes it possible to continuously monitor canopy temperature in production settings. The utility of cotton canopy temperature heat units (CT-heat unit) was as-sessed by comparing decadal (2000-2009) AT-heat unit variation with variation in CT-heat unit accumulation due to variable irrigation in 2009. Irrigation-induced variation in CT-heat units (1198-1416) was similar to the decadal variation in AT-heat units (1270-1508). Two heat unit-based management tools: 1) the assignment of
irriga-tion crop coefficients and 2) the identificairriga-tion of a fiber thickening period were both found to be
sensitive to irrigation-induced changes in CT-heat unit accumulation. The inclusion of CT-heat units resulted in variability in both indicators that
re-flected effects of irrigation and climate on plant
performance. Inclusion of canopy temperature measurements in heat unit accumulation might improve the utility of heat units.
C
rop development is incremental and cumulative. At each moment in time crop developmentis a reflection of its environmental history up to
that point. At the end of the season, yield is the cumulative product of plant metabolism over the
course of many days, some optimal, some not. The seasonal progression of temperature from planting through harvest is a major driver of crop growth and development. Keeping track of the growth and development of the crop in real time over the season remains a challenge for many producers. In production agriculture, the relationship between temperature and crop development is often described in terms of heat units, which are widely used to help manage cotton production. More than 50 yr ago Wang reviewed 230 yr of heat unit theory and application in a critique of heat unit approaches and made recommendations for improving the utility of heat units (Wang, 1960). The practical utility of heat unit approaches in agriculture is evidenced by the continued interest and innovation in heat unit approaches that span decades (Arnold, 1960; Forrest and Miller-Rushing, 2010; Hearn and Constable, 1984; Huberman,1941; Idso et al., 1978; Lomas
and Mandel, 1977; Unruh and Silvertooth, 1997; Viator et al., 2005; Yfoulis and Fasoulas, 1978). In spite of many attempts to improve the heat unit theory, most on-farm use in cotton still uses average daily air temperature calculated from maximum and minimum values with a comparison to a single base temperature (generally 15.5°C).
It has been reported that heat unit assessments in cotton are most reliable when water is adequate
and become less useful under water deficit conditions
(Peng et al., 1989). The relationship between air and canopy temperature becomes more variable under
water deficits (Gates, 1968; Jackson et al., 1981;
Recent improvements in equipment for monitoring plant canopy temperatures (Mahan and Yeater, 2008; Mahan et al., 2010, 2012) have reduced the complex-ity and cost of monitoring canopy temperature. It is proposed here that a canopy temperature-based heat unit (CT-heat unit) will more accurately describe the relationship between the thermal environment and the growth and development of crops than an air temperature-based heat unit (AT-heat unit).
The approach in this study was to compare the seasonal patterns of AT-heat units and CT-heat units in cotton under differential irrigation that resulted in differences in canopy temperature over the growing season. The practical value of CT-heat units was as-sessed with respect to two heat unit-based
manage-ment tools: 1) the assignmanage-ment of crop coefficients for irrigation management and 2) the identification of periods of fiber development. The objective of this
study stated in the form of a hypothesis is: canopy temperature-based heat units will be a better and more mechanistic predictor of crop growth and development than air temperature-based heat units, particularly under variable irrigation.
MATERIALS AND METHODS
Study Interval. The climate analysis portion of the study was based on air temperature data col-lected at Lubbock, TX during the decade from 2000 to 2009. The irrigation experiment in the study was carried out in Lubbock during the summer of 2009. Data for analysis, in both the 2000 to 2009 decadal study and the 2009 irrigation study, were collected during the period from DOY 134 through DOY 273, which for Lubbock represents the interval between a typical mid-May planting date for the region and the end of the cotton season in September.
Cotton Growth. Cotton variety DP147RF (Gossypium hirsutum L.) was planted at the Texas Tech Lubbock Research Farm on DOY 134 (14 May 2009). The crop was managed in accord with standard practice for the region including nitrogen application, insect and nematode control, growth regulators, and harvest aids. The seeding rate was 13 seeds per meter on a 1-m row spacing. The row
orientation was east to west on raised beds.
Irrigation Regimes. Cotton was grown in 2009 under rainfed and irrigated conditions. Rainfall over the interval from planting to harvest was 193 mm, which occurred in 21 events ranging from 3 mm to 23 mm. There were 11 irrigation regimes ranging from
1 mm/d to 5.5 mm/d at 0.5-mm/d increments and a rainfed treatment that received no irrigation.
Irriga-tion amounts for each regime were based on flow
meter readings. Irrigation water was applied to the
fields once each day with a subsurface drip irrigation
system with drip lines at 36 cm below the soil surface of each row. Each irrigation treatment consisted of one 8-row zone. Irrigation was initiated on DOY 188
and continued on a daily basis with the final irriga -tion applied on DOY 264. There were 76 irriga-tion events during the season for each irrigation treatment. Crop evapotranspiration (ETc) was calculated using the CROPWAT system (Allen et al., 1998). The ETc of the crop was calculated on a daily interval where the daily crop evapotranspiration (ETc) is equal to the product of reference evapotranspiration (ETo) and a locally calibrated crop factor (KC). ETo was calculated using on-site weather station data and the Penman-Monteith equation (Allen et al., 1998).
Air and Canopy Temperatures. Air temperature was measured at the USDA/ARS Plant Stress and Water Conservation meteorological tower at Lubbock. Canopy temperatures were monitored during the growing season using a SmartCrop wireless infrared
thermometer (IRT) system (Smartfield Inc., Lubbock, TX; smartfield.com). The SmartCrop system has been
described previously (Mahan and Yeater, 2008; Ma-han et al., 2010). Wireless IRT sensors were installed on the south side of east-west rows and viewed the canopy from the south. Sensors were positioned ap-proximately 20 cm above the canopy at an angle of approximately 60° from the horizontal with the height adjusted at least weekly. The area of canopy monitored was approximately 20 cm in diameter.
Canopy temperature was measured at 1-min intervals with 15-min averages calculated by the remote sensors for automated transmission to the base unit once every 15 min over each 24-hr day. One remote IRT sensor was placed in each of the
12 water levels. Sensors remained in the same field
location during the entire measurement period. Air temperature was measured at 2 m above ground level with the SmartCrop remote base station on the
edge of the field at the same measurement interval as
canopy temperature. Air temperatures were collected for 139 d from DOY 134 through DOY 273. Differ-ential irrigation was initiated on DOY 188 when the
plant canopy filled the IRT field of view and canopy
temperatures were collected for 85 d from DOY 188 through DOY 273. Prior to DOY 188 (DOY 134 to
IRT sensor’s field of view and the measured canopy
temperature thus included a mixture of leaf and bare soil. The canopy temperature dataset consisted of approximately 8160 measurements per irrigation treatment. Four of the irrigation treatments were se-lected for detailed analysis and Table 1 demonstrates data quality and canopy temperature variation during the 2009 season.
Air Temperature-Based Heat Units. AT-heat units were calculated daily from the daily maximum and minimum air temperatures using a base tempera-ture of 15.5°C.
Daily AT-heat unit = ((Tmax + Tmin)/2) − 15.5°C
Daily heat units were calculated over the interval DOY134 to DOY 273 for the 10-yr interval begin-ning in 2000 and ending in 2009. In all instances heat units were constrained by recording a value of 0 when air or canopy temperatures (discussed below) resulted in negative values for heat units.
Canopy Temperature-Based Heat Units.
CT-heat units were calculated from 15-min cotton canopy temperatures and summed over the 24-hr period (96/d).
Daily CT-heat unit =
∑(15-min canopy temperature − 15.5°C)/96 Prior to the development of sufficient canopy for
measurement on DOY 188 in 2009, air temperatures were used in the calculation of the CT-based heat units, thus heat unit accumulations were the same for all irrigation treatments during the interval from DOY 134 to DOY 187.
Fiber Development and Heat Units. Bange et al. (2010) postulated that the interval between the accumulation of 926 and 1112 heat units (15.5°C
base) represents a period of fiber thickening (Fiber
Window) during which temperature has its
great-est effect on fiber micronaire. The effect of air and
canopy temperature variability on the starting date
and duration of Fiber Window was assessed using 10 yr (2000-2009) of AT-heat units and the CT-heat units from the 2009 irrigation regimes. The date on which the heat unit accumulation reached 926 heat units indicated the start of the Fiber Window and accumulation of 1112 heat units indicated the end of the Fiber Window.
Crop Coefficients and Heat Units. Crop
coef-ficients are an integral component of evapotranspira -tion-based irrigation management strategies and are
typically modified, based on heat units, during the
season as the crop grows (Hunsaker, 1999; Sammis et al., 1985). In Bushland, TX, Howell et al. (2004)
assigned the highest value of crop coefficient to cotton
during the interval between the accumulation of 534 and 891 AT-heat units (Kc Window). The effect of air and canopy temperature variability on the starting date and duration of Kc Window was assessed using 10 yr (2000-2009) of AT-heat units and the CT-heat units from the 2009 irrigation regimes. The date on which the heat unit accumulation reached 534 heat units in-dicated the start of the Kc Window and accumulation of 891 heat units indicated the end of the Kc Window. For this analysis, four of the 13 water treatments were used: rainfed, 1 mm, 3 mm, and 5.5 mm on a daily irrigation basis. Irrigation-induced variation in the accumulation of CT-heat units was noted in the four irrigation regimes from 2009 indicating that the Kc Window and Fiber Window are affected by ir-rigation. Irrigation-induced variation for both the Kc Window and the Fiber Window across the irrigation regimes was of a similar magnitude to that observed in the climate-induced variation analysis.
For the initial 53 d of the irrigation treatments in 2009, until the crop canopy developed, AT-heat units were used in place of CT-heat units. Thus all the irrigation regimes heat unit accumulation was the same from planting to the start of the Kc Window. CT-heat units were the basis of accumulation begin-ning on DOY 188.
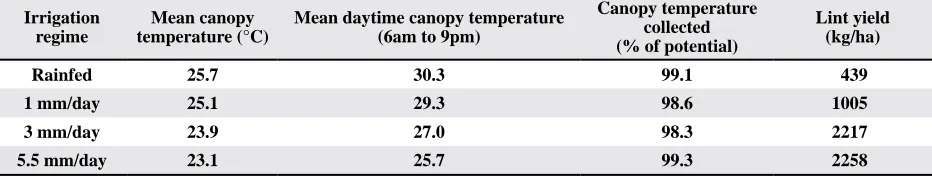
Table 1. Canopy temperature, and yield for four irrigation treatments during the interval DOY 188 through DOY 273. Data collected indicates the percent of 15-min periods (8160 possible) for which canopy temperature was successfully transmitted from the field by the thermometry system.
Irrigation regime
Mean canopy temperature (°C)
Mean daytime canopy temperature (6am to 9pm)
Canopy temperature collected (% of potential)
Lint yield (kg/ha)
Rainfed 25.7 30.3 99.1 439
1 mm/day 25.1 29.3 98.6 1005
3 mm/day 23.9 27.0 98.3 2217
RESULTS AND DISCUSSION
Heat Unit Variation; Climate Induced and Irrigation Induced. In this study, we analyzed vari-ability in heat unit accumulation from 2 sources: 1) AT-heat unit variation over a 10-yr period that was used to determine the extent of climate-related heat unit accumulation and 2) CT-heat unit variation produced by differential irrigation in a single sea-son (2009) that was used to determine the extent of irrigation-induced heat unit accumulation.
The seasonal accumulation of AT-heat units during the 2000 to 2009 period (Fig. 1) shows the climate-induced heat unit variation for Lubbock. During the 2000 to 2009 decade, year-to-year climate-induced variation in AT-heat unit accumulation is evident (Table 2) with the minimum accumulation of 1270 in 2007 and the maximum of 1508 in 2001. The seasonal average AT-heat unit accumulation was 1393 across the decade.
Table 2. Variation in heat unit accumulation resulting from climate variability during the decade 2000 to 2009 and that due to variable irrigation in 2009 at Lubbock, TXZ.
Treatment Lowest Highest Mean Difference
Air Temp-Based Heat Units (climate-induced variation 2000-2009)
1270 (2007)
1508
(2001) 1393 238 (17% of mean)
Canopy Temp-Based Heat Units (irrigation-induced variation 2009)
1195 (5.5 mm)
1450
(rainfed) 1286 208 (16% of mean)
Z Climate-induced variation refers to heat units calculated from daily mean air temperature. Irrigation-induced variation
refers to heat units calculated from 15-min measurements of canopy temperature in a series of irrigation regimes in Lubbock, TX. All heat units were calculated using a base temperature of 15.5°C.
0 200 400 600 800 1000 1200 1400 1600
130 150 170 190 210 230 250 270 290
Day of Year
Air temperature-based heat units
(15.5° base)
2001-1499 heat units
2007-1258 heat units
Z Heat units were calculated from daily mean air temperature
(maximum-minimum/2) using a base temperature of 15.5°C. The years of the maximum and minimum accumulations and the total accumulated heat units are
noted on the figure.
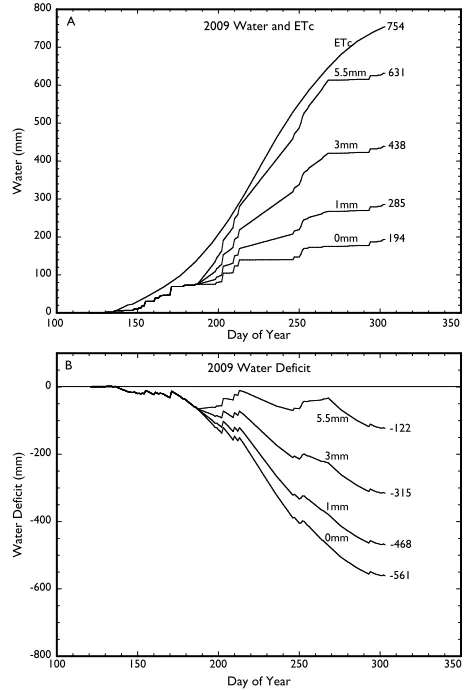
Figure 2 shows the pattern of irrigation and rainfall during the study period in four of the water levels that span the range of the treatments. Canopy temperature-based heat units were calculated from canopy temperatures collected from 11 irrigation regimes and a rainfed plot. The seasonal patterns of CT-heat units under differential irrigation in 2009 (Fig.
3) shows the irrigation-induced heat unit variation as-sociated with canopy temperature variation. During the summer of 2009, irrigation-induced variation in the accumulation of CT-heat units was evident rang-ing from a low of 1195 in the 5.5-mm treatment to a high of 1450 in the rainfed treatment with a seasonal average accumulation of 1286 across all treatments.
0 100 200 300 400 500 600 700 800
100 150 200 250 300 350
2009 Water and ETc
Water (mm)
Day of Year
ETc
5.5mm
3mm
1mm
0mm 194 285 438 631 754
A
Figure 2. Water and environmental demand for 2009 season. A. Irrigation, rain, and estimated crop evapotranspiration (ETc) during the 2009 growing season for four irrigation treatments selected to indicate the range of water treatments. B. Difference between ETc and irrigation and rain during 2009 for four irrigation treatments selected to indicate the range of water treatments. The zero line indicates condition of water applied equal to ETc. Negative values indicate an estimate of the crop water deficit over the season.
-800 -600 -400 -200 0
100 150 200 250 300 350
2009 Water Deficit
Day of Year
5.5mm
3mm
1mm
0mm
Water Deficit (mm)
-122
-315
-468
-561
B Figure 1. Seasonal pattern of AT-based heat unitZ
The variation in the seasonal heat unit accumula-tion during the decade in Lubbock is an indicaaccumula-tion of climate variability that has been reported to be an im-portant source of variation in seasonal cotton growth and development (Esparza et al., 2007; Wanjura and Supak, 1985). The observed accumulation of CT-heat units across the 12 irrigation treatments in 2009 suggests that within a given season, irrigation could produce variation in heat units that is similar to that of
a decade of climate variation. Given that the observed
variation in AT-heat unit accumulation is considered to affect cotton yield and quality, the similarly scaled variation in CT-heat unit accumulation might be im-portant as well. In the following section the potential importance of CT-heat unit variation will be assessed.
Assessment of the Utility of CT-Heat Units.
Although the calculation of CT-heat units is simple in concept and practice, the question remains as to their potential utility. The utility of CT-heat units was assessed in terms of two heat unit-based indicators of plant performance: 1) the assignment of irrigation
related crop coefficients and 2) the characterization
of a period of fiber development. This analysis is
intended to investigate the effect of assessing cotton development using CT-heat units in place of AT-heat units. The assessment of CT-heat unit utility was carried out using AT-heat units calculated from the 2000 to 2009 decade and CT-heat units calculated from four irrigation treatments in 2009.
The accumulation of AT-heat units is the basis
for the assignment of crop coefficients in ET-based
irrigation (Howell et al., 2004; Hunsaker, 1999; Sam-mis et al., 1985). The timely assignment of
appro-priate crop coefficients serves to balance irrigation
with crop water use and optimizes the relationship between yield and water use. In a system using
various crop coefficient values in cotton, Howell et
al. (2004) assigned the maximum value of the crop
coefficient for cotton during the interval between the
accumulation of 534 and 891 AT-heat units, which we refer to as the Kc Window.
Fiber development in cotton has been shown to be affected by temperature (Bradow and Bauer, 1997; Davidonis et al., 2004; Yeates et al., 2010). Bange et al. (2010) modeled the effect of temperature on
fiber quality based on the interval between 926 and
1112 accumulated AT-heat units, which we refer to as the Fiber Window.
The starting dates and durations of the Kc
Win-dow and Fiber WinWin-dow were identified from the
accumulation of AT-heat units during the growing season for each year from 2000 to 2009. In a similar manner, the starting dates and durations of the Kc
Window and Fiber Window were identified from the
accumulation of CT-heat units in selected irrigation treatments from 2009. Table 3 and Figs. 4 and 5 show that the developmental windows vary year to year and in response to crop water status.
Z Heat units were calculated from canopy temperature measured on a 15-min
interval throughout the day using a base temperature of 15.5°C. The daily irrigation amount for the maximum and minimum accumulations and the
total accumulated heat units are noted on the figure.
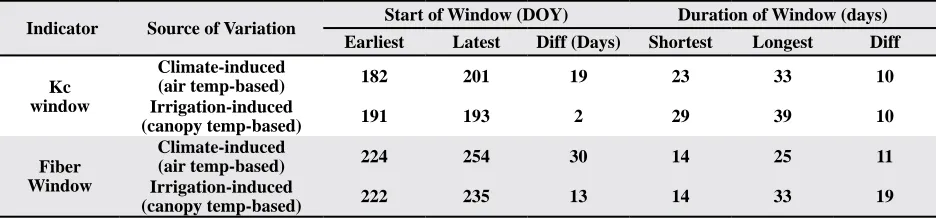
Table 3. Comparison of air temperature-based heat units and canopy temperature-based heat units with respect two heat unit-based indicators of the growth and development of cottonZ.
Indicator Source of Variation Start of Window (DOY) Duration of Window (days)
Earliest Latest Diff (Days) Shortest Longest Diff
Kc window
Climate-induced
(air temp-based) 182 201 19 23 33 10
Irrigation-induced
(canopy temp-based) 191 193 2 29 39 10
Fiber Window
Climate-induced
(air temp-based) 224 254 30 14 25 11
Irrigation-induced
(canopy temp-based) 222 235 13 14 33 19
Z Climate-induced variation is based on AT-based heat units during the 2000 to 2009 interval in Lubbock, TX.
Irrigation-induced variation is based on CT-based heat units for 12 irrigation levels during 2009 in Lubbock, TX. For each of the heat unit-based indicators, Kc Window and Fiber Window (see text) start date and duration was calculated based on the accumulation of heat units derived from air temperatures or canopy temperatures. The earliest and latest starting dates for the windows and the shortest and longest durations of the windows were calculated.
0 200 400 600 800 1000 1200 1400 1600
130 150 170 190 210 230 250 270 290 0mm/day (rainfed) 1450 heat units
5.5mm/day 1195 heat units
Day of Year
Cumulative heat units (15.5° base)
Irrigation Regimes Initiated
Figure 3. Seasonal pattern of CT-based heat unitZ accumulation
Variation in Kc Windows and Fiber Windows.
With respect to AT-heat units, based on the decade of measurements (2000-2009), the start and duration of the Kc Windows and Fiber Windows varied. The start
date of the Kc Window (at 534 heat units) varied by 19 d (from DOY 182 to DOY 201) and its duration varied by 10 d (from 23 d to 33 d). The start date of the Fiber Window (at 926 heat units) varied by 30 d (from DOY 224 to DOY 254) and its duration varied by 11 d (from 14 d to 25 d). This decadal variation in Kc Windows and Fiber Windows based on AT-heat units is an indicator of season-to-season variation in crop/environment interactions.
With respect to the accumulation of CT-heat units during the 2009 growing season, the start and duration of the Kc Windows and Fiber Windows varied. The start date of the Kc Window (at 534 heat units) varied by only 2 d (from DOY 191 to DOY 193) and its dura-tion varied by 10 d (from 29 d to 39 d). The start date of the Fiber Window (at 926 heat units) varied by 13 d (from DOY 222 to DOY 235) and its duration varied by 19 d (from 14 d to 33 d). Prior to canopy development, (roughly the initial 53 d of the 2009 season), AT-heat units were used in place of CT-heat units. This meant that virtually all the heat units used in the calculation of the start of the Kc Window were AT-heat units with CT-heat units contributing only to the duration of the Kc Window. With respect to the Fiber Window, CT-heat units comprised about 40% of the CT-heat units used in determining its start date. This lack of early season CT-heat unit data limits the advantage of their use when “triggers” are based on the accumulation of small
frac-tions of the seasonal accumulafrac-tions.
The use of canopy temperature to monitor the development of the cotton crop indicated differences in Kc Windows and Fiber Windows that would not have been detected using AT-heat units alone. These results indicate that differential irrigation, during a single growing season, can produce differences in CT-heat unit accumulation similar to variation in AT-heat unit accumulation that results from year-to-year climate variability. With respect to the Kc Window for
irrigation crop coefficients, the use of CT-heat units
might enhance the ability of a producer to establish
appropriate crop coefficients and possibly improve irrigation management. In terms of fiber development,
the observed variation in the onset and duration of the Fiber Window, the use of CT-heat units might better
account for variation in fiber characteristics in cotton
under differential irrigation.
CONCLUSION
Worldwide, declining water resources are in-creasing the fraction of agricultural crops that are
160 180 200 220 240 260 280 Day of Year
5.5 mm/day 3 mm/day 1 mm/day 0 mm/day
Air 2009 2008
2007 2006
2005 2004 2003 2002 2001
2000
Kc window
Climate-induced variation 2000-2009 Irrigation-induced variation
2009
Z Climate-induced variation refers to heat units calculated from daily
mean air temperature. Irrigation-induced variation refers to heat units calculated from 15-min measurements of canopy temperature in a series of irrigation regimes in Lubbock, TX. All heat units were calculated using a base temperature of 15.5°C. The horizontal boxes indicate the starting date, ending date, and duration of the Kc Window, a period during which
the assigned irrigation crop coefficient would be at its maximum. Text in the box identifies the year of the decade (2000 to 2009) for the climate-induced
variation or the daily irrigation amount for the irrigation regimes in 2009.
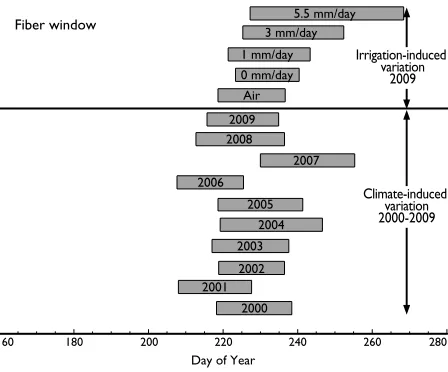
160 180 200 220 240 260 280 Day of Year
5.5 mm/day
2009 Air 0 mm/day
3 mm/day
2004 2003 2002 2001
2000 2005 2006
2007 2008
Fiber window
Climate-induced variation 2000-2009 Irrigation-induced
variation 2009
1 mm/day
Z Climate-induced variation refers to heat units calculated from daily mean
air temperature. Irrigation-induced variation refers to heat units calculated from 15-min measurements of canopy temperature in a series of irrigation regimes in Lubbock, TX. All heat units were calculated using a base temperature of 15.5°C. The horizontal boxes indicate the starting date,
ending date and duration of the Fiber Window. Text in the box identifies
the year of the decade (2000 to 2009) for the climate-induced variation or the daily irrigation amount for the irrigation regimes in 2009.
Figure 4. Variation in the start, duration, and end of a period of a crop coefficient assignment (Kc Window) for cotton resulting from a decade of climate variation and differential irrigationZ.
grown under less-than-optimal water conditions. Because heat unit approaches in cotton are most useful in irrigated production and less useful under
water deficit conditions (Peng et al., 1989), CT-heat
units might be particularly useful under variable and limited irrigation. Under such conditions, CT-heat units might reduce irrigation-related variability of heat unit based predictions of plant performance.
The ultimate utility of CT-heat approaches will be assessed in terms of their ability to more ac-curately predict and account for changes in plant performance particularly in the presence of in-season variation in plant water status. The practical implementation of a CT-heat unit approach will require additional research to more fully develop the relationships between CT-heat units and crop development.
ACKNOWLEDGMENT
Supported by Ogallala Aquifer Program USDA/ ARS and Cotton Incorporated funds.
DISCLAIMER
The U.S. Department of Agriculture (USDA) prohibits discrimination in all its programs and ac-tivities on the basis of race, color, national origin, age disability, and where applicable, sex, marital status, familial status, parental status, religion, sexual orien-tation, genetic information, political beliefs, reprisal, or because all or part of an individual’s income is derived from any public assistance program. (Not all prohibited bases apply to all programs.) Persons with disabilities who required alternative means for communication of program information (Braille, large print, audiotape, etc.) should contact USDA’s
TARGET Center at (202) 720-2600 (voice and TDD). To file a complaint of discrimination, write to USDA, Office of Civil Rights, 1400 Independence Avenue,
S.W., Washington, D.C. 20250-9410, or call (800) 795-3272 (voice) or (202) 720-6382 (TDD). USDA is an equal opportunity provider and employer.
LITERATURE CITED
Allen, R.G., L.S. Pereira, D. Raes, and M. Smith. 1998. Crop
evapotranspiration. FAO Irrigation and Drainage, Paper 56. Rome, Italy: Food and Agricultural Organization of the UN.
Arnold, C.Y. 1960. Maximum-minimum temperatures as a basis for computing heat units. Proc. Am. Soc. Hortic. Sci. 76:682–92.
Bange, M.P., G.A. Constable, D.B. Johnston, and D. Kelly.
2010. A method to estimate the effects of temperature on cotton micronaire. J. Cotton Sci. 14:164–172.
Bradow, J., and P.J. Bauer. 1997. Fiber-quality variations re-lated to cotton planting date and temperature. p. 1491– 1495 In Proc. Beltwide Cotton Conf., New Orleans, LA. 7-10 Jan. 1997. Natl. Cotton Counc. Am., Memphis, TN .
Davidonis, G., A. Johnson, J. Landivar, and C. Fernandez. 2004. Cotton fiber quality is related to boll location and
planting date. Agron. J. 96:2–47.
Esparza, A., P. Gowda, R. Baumhardt, T. Marek, and T.
Howell. 2007. Heat unit availability for cotton produc-tion in the Ogallala Aquifer region of the United States. J. Cotton Sci. 11:110–117.
Forrest, J., and A. Miller-Rushing. 2010. Toward a synthetic understanding of the role of phenology in ecology and evolution. Philos. Trans. R. Soc. B: Biol. Sci. 365(1555):3101–3112.
Gates, D. 1968. Transpiration and leaf temperature. Ann. Rev.
Plant Physiol. 19: 211–238.
Hearn, A.B, and G.A. Constable. 1984. Cotton. p. 495–527 In
P.R. Goldsworthy and N.M. Fisher (eds.) The Physiol -ogy of Tropical Field Crops. John Wiley and Sons Ltd., Chichester, UK.
Howell, T.A., S.R. Evett, J.A. Tolk, and A.D. Schneider. 2004.
Evapotranspiration of full-, deficit-irrigated, and dryland
cotton on the northern Texas High Plains. J. Irrig. Drain. Eng. 130:277–285.
Huberman, M.A. 1941. Why phenology. J. For. 39:1007– 1013.
Hunsaker, D. 1999. Basal crop coefficients and water use for
early maturity cotton. Trans. ASAE. 24:27–936. Idso, S., R. Jackson, and R. Reginato. 1978. Extending the
“degree day” concept of plant phenological development to include water stress effects. Ecology. 59:431–433. Jackson, R.D., S.B. Isdo, R.J. Reginato, and P.J. Pinter. 1981.
Canopy temperature as a crop water stress indicator. Water Resour. Res. 17:1133–1138.
Kimball, B.A., J.W. White, G.W. Wall, and M.J. Ottman.
2012. Infrared-warmed and unwarmed wheat vegetation indices coalesce using canopy-temperature-based grow-ing degree days. Agron. J. 104:114–118.
Mahan, J.R., W. Conaty, J. Neilsen, P. Payton, and S.B. Cox. 2010. Field performance in agricultural settings of a wireless temperature monitoring system based on a low-cost infrared sensor. Comput. Electron. Agric. 71:176–181.
Mahan, J.R., and K.M. Yeater. 2008. Agricultural applications of a low-cost infrared thermometer. Comput. Electron. Agric. 64:262–267.
Mahan, J.R., A.W. Young, and P. Payton. 2012. Deficit irriga -tion in a produc-tion setting: canopy temperature as an adjunct to ET estimates. Irrig. Sci. 30:127–137. Peng, S., D. Krieg, and S. Hicks. 1989. Cotton lint yield
response to accumulated heat units and soil water supply. Field Crops Res. 19:253–262.
Reddall A.A., L.J. Wilson, P.C. Gregg, and V.O. Sadras. 2007.
Photosynthetic response of cotton to spider mite damage: interaction with light and compensatory mechanisms. Crop Sci. 47:2047–2057.
Sammis, T.W., C.L. Mapel, D.G. Lugg, R.R. Lansford, and J.T. McGuckin. 1985. Evapotranspiration crop coef
-ficients predicted using growing-degree-days. Trans.
ASAE. 28:773–780.
Unruh, B., and J. Silvertooth. 1997. Planting and irrigation termination timing effects on the yield of Upland and Pima cotton. J. Prod. Agric. 10:74–79.
Viator, R., R. Nuti, K. Edmisten, and R. Wells. 2005. Predict-ing cotton boll maturation period usPredict-ing degree days and other climatic factors. Agron. J. 97:494–499.
Wang, J. 1960. A critique of the heat unit approach to plant response studies. Ecology. 41:785–790.
Wanjura, D.F., and J.R. Supak. 1985. Temperature methods for monitoring cotton development. p. 369–372 In Proc. Beltwide Cotton Prod. Res. Conf., New Orleans, LA. 6-11 Jan. 1985. Natl. Cotton Counc. Am., Memphis, TN.
Yeates, S.J., G.A. Constable, and T. Mccumstie. 2010. Ir -rigated cotton in the tropical dry season. III: Impact of
temperature, cultivar and sowing date on fibre quality.
Field Crops Res. 116:300–307.