Print ISSN: 2383-451X Online ISSN: 2383-4501 Web Page: https://jpoll.ut.ac.ir, Email: jpoll@ut.ac.ir
Aerobic degradation of methylene blue from colored effluents by
Ralstonia eutropha
Habibi, A.* andMehrabi, Z.
Faculty of Petroleum and Chemical Engineering, Razi University, Kermanshah, Iran
Received: 23 Nov. 2016 Accepted: 30 Jan. 2017
ABSTRACT: The present paper has examined the degrading ability of phenol-oxidizing
bacterium, Ralstonia eutropha, for biological removal of methylene blue (MB) from aqueous solutions under aerobic conditions. Results show that MB has been extensively eliminated as a co-metabolism in the presence of supplementary carbon (glucose) and nitrogen (yeast extract and peptone) sources and the experimental observations indicate that MB is initially adsorbed on the cell‟s surface, in accordance to Langmuir Theory, then to be degraded by the cell. The type of nitrogen source, initial pH, aeration rate, and the presence of CaCl2 are all influential factors in the process of MB removal. The
biodegradation kinetics modeling has determined that while playing an uncompetitive role, MB inhibits its biodegradation at high concentrations. According to the best fit Han-Levenspiel Model, the maximum MB specific biodegradation rate (rmax), half-saturation
concentration of MB (KS), maximum allowable MB concentration (Sm), and the shape factors (n and m) have been 7.37 mg gcell
-1
h-1, 32.13 mg/L, 158.8 mg/L, 0.27, and 0.76, respectively.
Keywords: aerobic cell, biodegradation, dyestuff decolorization, kinetic modeling,
wastewater treatment.
INTRODUCTION
Methylene blue (MB), 3, 7-bis (dimethyl amino)-phenothiazin-5-ium chloride, is one of the common dyestuffs, applied in industries such as textile, leather, paper, plastics, and paint, in which large amounts of MB, usually with a concentration of 10-200 mg/L, are discharged into the environment (Akhtar et al., 2005). These colored effluents are famous for their unfavorable impacts on natural ecosystems and aquatic life. At first, the quality of water's appearance is significantly affected by minute amount of MB (even less than 1 ppm), which manages to obstruct light
Corresponding Author Email: a.habibi@razi.ac.ir
penetration (Garg et al., 2004). It also decreases the amount of oxygen, dissolved in aqueous media, for its high reduction potential. The aromatic structure of MB has demonstrated mutagenic effects on living cells (Eskizeybek et al., 2012). European Communities regulation for discharge into surface waters is 0.2 mg of MB in each liter (European Communities, 1989). As a result, this dye-containing industrial wastewater must be treated before being discharged so that its impacts on the environment can be minimized.
effluents in industrial facility units. As such, there have been several methods used to treat colored wastewaters such as adsorption, precipitation, ion exchange, photocatalytic degradation, reverse osmosis, flocculation, coagulation, and biodegradation, with the latter having technical advantages in comparison to others in terms of its lower operational costs, less water usage, and complete conversion of the dye to non-toxic mineral compounds (Saratale et al., 2011; Chatterjee et al., 2012; Noraini et al., 2012). In the last decade, several microbial processes for MB decolorization have been developed, using anaerobic active sludge or simultaneous aerobic/anaerobic microbial consortiums (Sponza & Isik, 2002; Ong et al., 2005; Cetin & Donmez, 2006; Jonstrup et al., 2011). However, a few report are available for biodegradation of MB under aerobic conditions (Noraini et al., 2012).
The use of non-pathogenic soil bacterium,
Ralstonia eutropha, as an efficient degrader of phenolic compounds, has been reported in previous works (Nickzad et al., 2012; Motamedi et al., 2014; Habibi & Sharifi, 2016). To our knowledge, the literature contains no reports related to the degradative ability of R. eutropha toward MB in aqueous media under aerobic conditions. Hence the present research mainly focuses on studying the effects of environmental parameters such as initial pH, type and concentration of nutrients in the medium, and aeration on the biological decolorization process. The biosorption capacity of MB on the cell‟s surface as well as the biodegradation rate has been experimentally determined and then modeled by the relevant appropriate mathematical models.
MATERIAL AND METHODS
All chemicals, used, were analytical grade from Merck (Darmstadt, Germany), purchased from local supplier. The fine chemicals, used for media preparation, were bacteriological grade and were obtained from Merck.
The bacterium R. eutropha (PTCC 1615) was purchased from Persian-Type Culture Collection in lyophilized form and was then maintained on nutrient agar medium. Acclimation of R. eutropha to phenol was carried out, using glucose-phenol (GP) growth medium, containing (g/L): KH2PO4, 1.0; K2HPO4, 1.0;
(NH4)2SO4, 1.0; MgSO4.7H2O, 0.05 and
glucose and phenol as carbon sources (Nickzad et al., 2012). During adaption protocol, glucose concentration gradually declined and simultaneously phenol concentration rose in the GP medium. Adaptation was completed, once the test bacterium was able to use phenol as a sole carbon source. The adaptation protocol induced the aerobic enzymatic system for cleavage of aromatic ring in MB along with monooxygenases in the test bacterium (van Schie & Young, 2000).
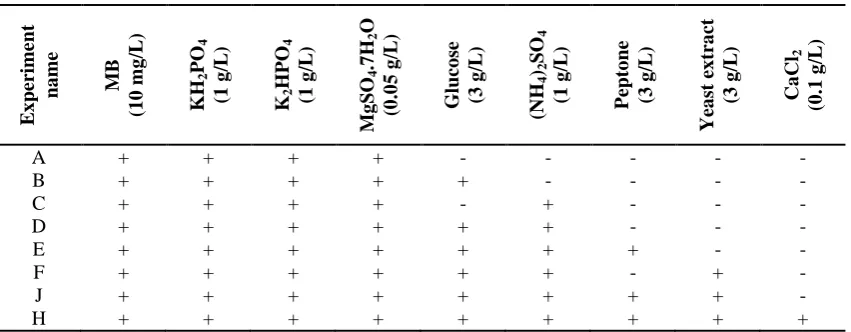
The effect of the composition of the cultivation medium was studied in 250 mL Erlenmeyer flasks with 100 mL of the media, containing the ingredients according to Table 1. In each experiment, after adjusting the initial pH to 6.5, the medium was sterilized in an autoclave at 121°C for 20 min. It was inoculated with 10% of 24-h grown culture of the phenol-adapted R. eutropha that provided an initial cell density of about 0.2±0.02 g/L. The cultivation temperature of 30 °C and agitation speed of 180 rpm were constant during the experiments.
The abiotic tests were conducted to determine the possibilities of physico-chemical interactions of additional chemicals with MB.
The effect of initial pH was also studied in 250 mL Erlenmeyer flasks with 100 mL of decolorization culture medium (DCM), including 10 mg/L of MB along with the following ingredients (g/L): glucose, 3; yeast extract, 3; peptone, 3; (NH4)2SO4, 1;
KH2PO4, 1; K2HPO4, 1; MgSO4.7H2O,
Table 1. The experiments to study the effect of nutrients on the MB decolorization performance of R. eutropha E x perime nt na me MB (1 0 m g /L ) KH 2 PO 4 (1 g /L ) K2 H P O4 (1 g /L ) M g S O4 .7 H2 O (0 .0 5 g /L ) G luco se (3 g /L ) (NH 4 )2 SO 4 (1 g /L ) P ept o ne (3 g /L ) Yea st ex tra ct (3 g /L ) Ca Cl 2 (0 .1 g /L )
A + + + + - - - - -
B + + + + + - - - -
C + + + + - + - - -
D + + + + + + - - -
E + + + + + + + - -
F + + + + + + - + -
J + + + + + + + + -
H + + + + + + + + +
measured at 5.5, 6.5, 7.0, 7.5, and 8.5 under the cultivation temperature of 30°C, agitation speed of 180 rpm, and initial biomass of 0.2±0.02 g/L.
The decolorization yield (Ydye) and
average decolorization rate (R) during 72 h of the treatments were reported as the responses:
i f dyei
% S S 100 Y
S
(1)
1
i fmg h
t
S S
R (2)
where, Si and Sf are the initial and final
concentrations of MB (mg/L), and t is the treatment time (h).
In order to estimate the biosorption capacity of MB on cell‟s surface, initially 100 mL of the grown culture of test bacterium with biomass concentration of about 2.3±0.1 g/L was inactivated by heating in an autoclave for 20 min at 121°C. Then, 10 mL of the heat-killed culture was added into 90 mL of MB solutions with initial concentrations of 10, 15, 25, 50, 75, 100, 125, and 150 mg/L. The samples were incubated in a shaker incubator at 30°C and 180 rpm for 5 h. Then, the biomass was separated through centrifugation at 6000×g for 6 min. The adsorbed dye on the sediments were extracted with acetone-methanol (3:1 v:v) solutions. The cell was harvested by
centrifugation and blue color supernatant was picked out. The dyestuff extraction and cell separation steps were repeated until the entire blue color was removed from the cell. Concentration of MB in the supernatant was determined and the adsorption capacity of MB on cell (qe,
mgMB gcell-1) was estimated by means of the
Equation (3).
1
cell
mg g i e
e
S S V
q
M
(3)
where qe is the amount of MB, adsorbed at
an equilibrium state; Si and Se are initial
and equilibrium MB concentrations in the biosorption medium (mg/L) respectively, V
is the volume of the biosorption medium (L), and M is the amount of dry cell biomass (g).
an autoclave at 121°C for 20 min and inoculation was done by 10% volume of the 24-grown culture of R. eutropha on the GP medium.
In order to evaluate the impact of aeration on the decolorization process, the performance of aerated reactor at 0.11, 0.22, 0.33, and 0.55 vvm were compared with a non-aerated reactor.
The kinetics of MB biodegradation were determined at different initial MB concentrations, ranging from 10 to 150 mg/L, where the reactor operated at an aeration rate of 0.55 vvm. In accordance with the experiments, the initial specific MB biodegradation rates (r) were determined during the first eight hours as follows.
1 1
cell
1
mg g h i R i S S r X t (4)
where Si and Xi are the initial
concentrations of MB (mg/L) and cell biomass (g/L), respectively. SR is the
residual MB concentration (mg/L) after eight hours of treatment time.
At regular time intervals, 10 mL of the DCM medium were collected. The absorbance at 600 nm for the collected sample, containing the cell along with dyestuff, was measured prior to centrifugation.
600 600 600
cell dye dye cell
nm nm nm
OD OD OD (5)
Afterwards the sample was centrifuged at 6000×g for 6 min and the supernatant as evaluated, using a UV–Vis scanning spectrophotometer at maximum MB absorbance ( ). The residual MB concentration was determined from a calibration curve against standard MB solutions.
In order to assess the cell biomass concentration, the absorbance of the supernatant was also measured at 600 nm.
600 600
sup dye
nm nm
OD OD (6)
By subtracting of Equation (6) from Equation (5) and using a calibration curve that related the dry cell weight to the biomass concentration was determined.
Every bar represents the mean of three replicates±standard error.
All regression analysis were carried out by means of nonlinear least-squares technique (Levenburg-Marquardt method), available in GraphPad Prism software for windows, version 5.00. Goodness of fit for regression of the experimental data (rexp)
by the model (rpred) was determined on the
basis of the coefficient of determination (R2) and the standard deviation of residuals (Sy.x) as bellows:
2 exp 2 exp 2 ) ( ) ( 1 R r r r r pred (7) p N r r
2 exp ) ( Sy.x (8)where,r, N and p were the mathematical average value, the number of experimental data, and the number of parameters fit, respectively.
RESULTS AND DISCUSSION
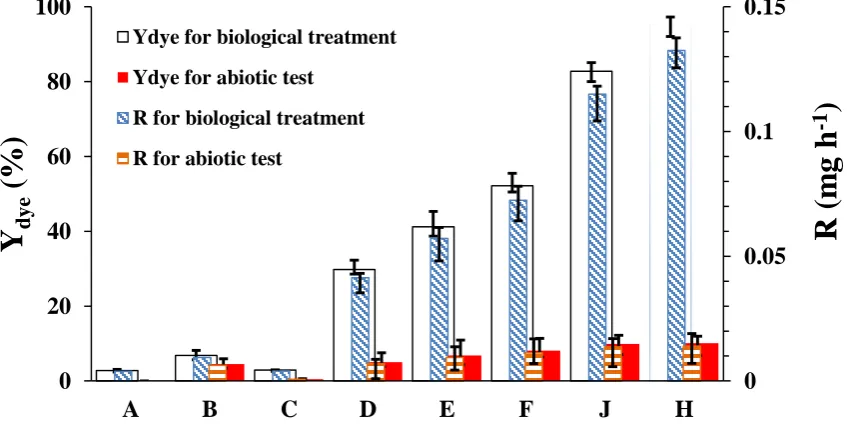
were added, as organic nitrogen sources, to the biological experiments “E” and “F”, the decolorization yield soared to 52.2% and 41.2%, respectively. The decolorization yield further zoomed to 82.8% with simultaneous addition of ammonium sulfate, yeast extract, and peptone (Biological experiment “J”). The findings agreed with previous reports, concerning the importance of nitrogen source as an essential factor for effective removal of colorant substances (Chen et al., 2003; Mathew & Madamwar, 2004; Kolekar et al., 2013). In the present study, application of yeast extract increased the specific degradation rate from 0.067 mg gcell-1 h-1 to
0.083 mg gcell-1 h-1, and the simultaneous
addition of yeast extract and peptone led to a specific degradation rate of about 0.101 mg gcell-1 h-1. The results indicated the
important role of the organic nitrogen source on generation of the dye-reducing agents such as NADH+ along with the enhancement of the degradative activity of the mono- and di-oxygenases, participated in the biological MB decomposition (Ong et al., 2005; Tan et al., 2013; Palanivelan et al., 2014). As shown in Figure 1, the decolorization yield in the biological
treatment also depended on the presence of CaCl2 salt and the decolorization
performance of the test cell was improved 15.2% by adding CaCl2. In fact, the
variation of cell wall inflexibility has a significant effect on the biological processes. The presence of CaCl2 could
induce osmotic stress in the cell, subsequently increasing the permeability of cell wall for excritment of the preplasmic enzymes (Gomaa et al., 2013). High concentration of CaCl2 leads to the cell
wall's inflexibility. In this study, a suitable level for CaCl2 concentration in the DGM
medium was 0.1 g/L, with higher concentrations resulting in less decolorization yiled. Ambatkar and Mukundan (2014) reported that an optimum concentration of CaCl2 for azo dyestuff
decolorization by crude peroxidase from
Armoracia rusticana was 25 mM. Figure 1 compares the abiotic tests, indicating that the presence of the reductive chemicals such as glucose and organic nitrogen sources had a minor influence on MB decolorization (less than 10%). Thus, the biological degradation was a probable mechanism for MB decolorization in the present study.
Fig. 1. Comparission of the effect of adding nitrients in the abiotic and biological processes 0 0.05 0.1 0.15
0 20 40 60 80 100
A B C D E F J H
R
(m
g
h
-1
)
Y
dy
e
(%
)
Ydye for biological treatment
Ydye for abiotic test
R for biological treatment
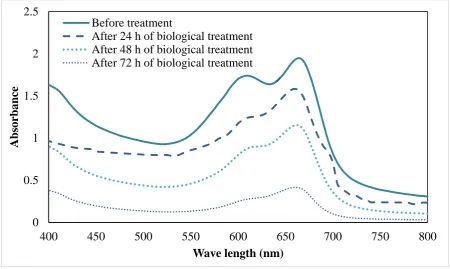
Figure 2 illustrates the MB absorbance spectrum. The absorption peak at 665 nm for MB was decreased gradually as the biological treatment time rose. By applying the biological process, the absorbance peak shifted from 665 nm to 655 nm, as shown
in Figure 2. The reduction in absorbance was likely due to the degradation of MB chromophore, with the peak shift showing the occurrence of de-methylation reaction by the cell (Matsuo et al., 2004).
Fig. 2. Absorption spectral changes and biological degradation of MB aqueous solution by R. eutropha cell
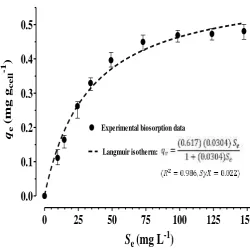
Biosorption studies are often carried out to better understand the adsorption process and determine the capacity of adsorbents. Previously, Noraini et al. (2012) reported that a biological removal of MB from aqueous waste streams took place in two stages: Initially, the dyestuff was quickly adsorbed to cell surface via either physical interactions or chemical reactions and was then degraded by enzyme-catalytic reactions in the next step. In order to quantify the MB adsorption on the cell‟s surface, the equilibrium communication between the amount of adsorbed MB on cell surface (qe, mg gcell-1) and the remained
dye in the culture mdeium (Se, mg/L) at
30°C was experimentally determined. Afterwards, by using non-linear regression analysis, the relevent Langmuir isotherm's
constants were estimated. On the best-fit Langmuir isotherm, the maximum of the equilibrium adsorption capacity (qmax) and
Langmuir isotherm constant (kL) were
0.617 mg gcell-1 and 0.0304 gcell -1 L,
respectively. Figure 3 compares the experimental bioprotion data and Langmuir ishoterm. According to the results, the Langmuir isotherm agreed well with the experiment data. It was previosly reported for adsorption of the reactive red 198 on
Aspergillus parasiticus cell (Tunali Akar et al., 2009). The Langmuir Model is only applicable in adsorbents whose surface is homogeneous with the assumption that the maximum adsorption occurs in a monolayer coverage on the adsorbent surface (Hameed et al., 2008).
0 0.5 1 1.5 2 2.5
400 450 500 550 600 650 700 750 800
Abso
rb
an
ce
Wave length (nm) Before treatment
0 25 50 75 100 125 150 0.0
0.1 0.2 0.3 0.4 0.5
Experimental biosorption data
Langmuir isotherm:
S
e(mg L
-1)
qe
(m
g
g
cell
-1
)
Fig. 3. Fitting of the Langmuir isotherm to the experimental MB adsorption on the cell’s surface
In the absence of water, Naumann et al. (1991) proposed that five major absorbance regions in Fourier Transform Infrared Spectroscopy (FTIR) spectra should be analyzed to identify the cell wall in bacteria: the 3000–2800 cm-1 spectral region is the fatty acidic region (Region I); 1700-1500 cm
-1
one contains amide I and II bands of proteins and peptides (Region II); 1500-1200 cm-1 is a mixed region of fatty acidic bending vibrations, proteins, and phosphate-carrying compounds (Region III); 1200-900 cm-1 contains absorption bands of the carbohydrates in microbial cell walls (Region IV); and 900-700 cm-1 is the „fingerprint region‟ that contains weak but very unique absorbances, characteristic of
specific bacteria (Region V). These absorbance regions are obviously detected in FTIR spectrum of R. eutropha in Figure 4, which also provides a comparison between the FTIR spectrums of the cell wall before and after MB adsorption test. The comparison was used to analyze the changes in functional groups of cell wall after the adsorption of MB. Shifting the peaks after the adsorption of the dyestuff with cell wall is listed in Table 2. Significant changes were observed in the peak values, indicating the existence of physical interaction between cell wall and MB. A similar shifting was recorded in adsorption of MB by chitin nanoparticles (Dhananasekaran et al., 2016).
Table 2. FTIR analysis peaks of R. eutropha cell wall and shifting the peak values after adsorption of MB
Vibration modes Before adsorption After adsorption
N-H stretching 3291 3285
C-H stretching 2930 2928
C-H bending 1731 1653
C=O stretching 1656 1601
N-O stretching 1540 1533
S=O stretching 1127 1132
C=C bending 978 951
0 1 2 0.0
0.5 1.0 1.5 2.0 2.5
Cel l wal l after MB adsorpti on Cel l wal l before MB adsorpti on
Fig. 4. FTIR analysis of R eutropha cell wall prior and after MB adsorption
Nonetheless, the low value of qmax in the
present study indicated that the cell as sorbent could not significantly remove MB from the medium, thus the decolorization observed in the presnet study was performed mainly due to an enzymatic degradation.
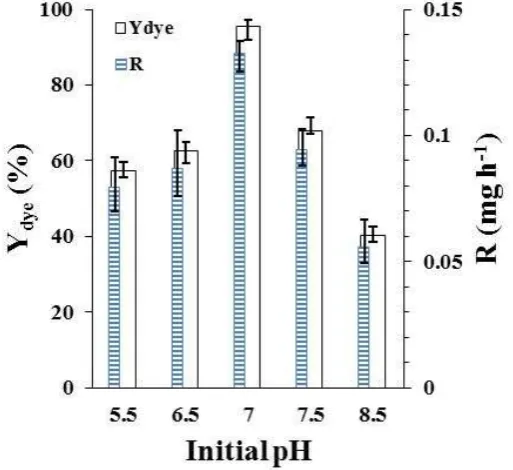
Nutrients' expulsion from cell membrane as well as catalytic activities of the enzymatic systems are influenced by pH. Figure 5 shows the effect of initial pH on MB removal by R. eutropha. The maximum MB removal occurred at an
initial pH of 7.0 and the performance obviously declined when initial pH was changed from 7.0 to either acidic or alkali conditions. Sharma et al. (2009) found an optimum pH at about 7.0 for yellow 211 dye decolorization by Bacillus subtilis. Wang et al. (2009) reached a maximum reactive dye decolorization efficiency, using Citrobacter sp. at pH= 7.0 and Mohana et al. (2008), reported an optimal condition for degradation of direct black 22 dye with a bacterial consortium at pH= 7.
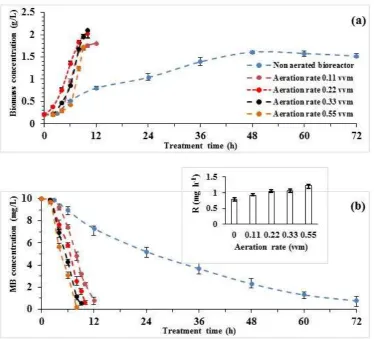
In aerobic microorganisms, aeration is necessary not only for cell growth but also for maintaining the metabolic activities. Oxygen availability for cell depends on the rate of oxygen transfer from air bubble (gas phase) to the culture medium (liquid phase) and then delivering the active center of the respiration reaction within the cell. Here Figure 6 demonstrates the effect of aeration rate on the MB removal. Results show that the cell growth was enhanced in the aerated reactors (Fig. 6a). With aerating the reactor at 0.11 and 0.55 vvm, about 92.3% and 98.3% of the initial MB (10 mg/L) were respectively removed after 12 h and 8 h from the beginning of the process (Fig. 6b). A comparison between the decolorization performances indicated that the specific decolorization rates in the aerated reactor were increased 4 to 6 times higher than the non-aerated reactor, revealing the importance of bioavailability of the dissolved oxygen for the catalytic activities of mono- and di-oxygenases, participating in MB degradation. In the anaerobic processes, previously reported for MB decolorization, the effluent was exposed to air, and thus the reduced form of MB (leucomethylene blue) was re-oxidized by oxygen and the blue color reappeared gradually (Isik & Sponza, 2003). In the present study, the efficiency of the MB decolorization was increased in the aerated reactor; therefore, the irreversible decolorization of MB confirms the fact that the chemical structure of MB was disrupted by the cell. The decolorization activity was increased as the aeration rate rose, reaching a specific removal rate of about 0.614 mg gcell-1 h-1 in aeration rate of
0.55 vvm. An aeration rate above 0.55 vvm was not favorable for foam formation and operational instability in the reactor.
Figure 7 shows the temporal variations of residual MB concentration. Based on the results, more than 98% of MB was rapidly removed in 8 h when initial concentration was equal to 10 mg/L. However, further
increase of MB concentration up to 15 and 25 mg/L, raised the degradation time for a complete degradation (more that 95% removal) to 16 and 48 h respectively.
Figure 8 demonstrates the initial specific MB biodegradation rate (r) as a function of initial MB concentration (Si). The trend
shows that the MB biodegradation rate is a function of the initial MB concentration. Decreasing “r” at higher concentrations either indicates inhibitory effect of MB or produces intermediates on the degradative activities of the cell. To determine the kinetic
constants, involved in the MB
biodegradation, the namely Haldane (Eq. 9) and Han-Levenspiel (Eq. 10) Models, developed on the basis of enzymatic-inhibition mechanisms, were used.
[1 / )
[1 / )
n max i i m
m
i S i m
r S S S
r
S K S S
(9)
1 ( / )
max iS i i I
r S
r
K S S K
(10)
where, rmax is the maximum specific MB
degradation rate in the absence of inhibitory effect of MB (mg gcell-1 h-1), KS
is the half-saturation concentration of MB (mg/L), KI is the substrate inhibition
concentration, and Sm is the maximum MB
concentration, above which the
biodegradation is completely inhibited (mg/L). Both n and m are empirical constants, defining the mechanisms of inhibitor actions in Han-Levenspiel Model (-).
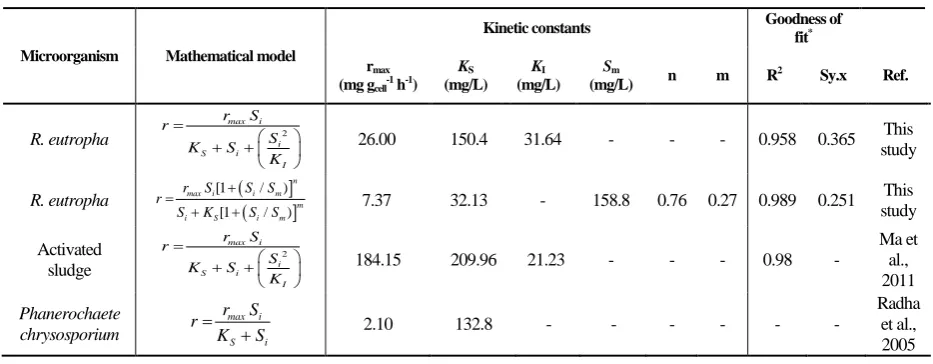
Figure 8 compares the values, predicted by the models, as well as the experimental data. Results show that Han-Levenspiel Model provides a good mathematical description of the process, compared to Haldane Model. On the best fit models (Table 3), the maximum specific MB biodegradation rate were estimated 7.37 and 26.00 mg gcell-1 h-1 by the
Han-Levenspiel and Haldane models
Fig. 6. Temporal variations of the cell biomass (a), and residual MB concnentration (b) as a function of aeration rate on stirred tank bioreactor
higher than the one, predicted by the Han-Levenspiel Model (150.4 mg/L in Haldane versus 32.13 mg/L in Han-Levenspiel). The kinetic constants reported in other microbial MB degradation processes are compared with this study in Table 3. Further test of the Han-Levenspiel equation showed the importance of the predicted Sm
value relative to the experimental results, obtained in this study, where 158.8 mg/L
was the highest estimated MB
concentration degradable by R. eutropha
cell. The Haldane Model predicted a comparative KI value of about 31.62 mg/L.
An inhibition concentration about 21.23 mg/L was previously reported for MB
biodegradation by an activated sludge (Ma et al., 2011). Ultimately, the obtained values of shape factors in the Han-Levenspiel Model were equal to 0.27, and 0.76, which represent a generalized uncompetitive inhibition role of MB on its biodegradation in the present study (Han & Levenspiel, 1988). Based on the extensive studies performed by Houas et al. (2001), phenolic components such as benzene sulfonic acid, and phenol have been found to be the main metabolites, resulting from MB decomposition.High concentrations of these phenolic compounds could harm the bacterium cell at the high initial MB concentrations.
Table 3. Comparison between the kinetic constants, obtained in this study and other MB kinetic studies
Microorganism Mathematical model
Kinetic constants Goodness of
fit* rmax
(mg gcell-1 h-1)
KS
(mg/L)
KI
(mg/L)
Sm
(mg/L) n m R
2 Sy.x Ref.
R. eutropha 2
max i i S i
I
r S r
S K S
K
26.00 150.4 31.64 - - - 0.958 0.365 This
study
R. eutropha
[1 / )
[1 / )
n max i i m
m
i S i m
r S S S r
S K S S
7.37 32.13 - 158.8 0.76 0.27 0.989 0.251
This study
Activated sludge
2
max i i S i
I
r S r
S K S
K
184.15 209.96 21.23 - - - 0.98 -
Ma et al., 2011
Phanerochaete chrysosporium
max i
S i
r S
r
K S
2.10 132.8 - - - -
Radha et al., 2005
0 25 50 75 100 125 150 0.0
1.0 2.0 3.0 4.0 5.0
Experimental data Han-Levenspiel model Haldane model
Si(mg L-1 )
r
(m
g
gc
e
ll
-1 h -1)
CONCLUSIONS
This study fucosed on the degradative ability of R eutropha towards decolorization of MB from sysntetic wastewaters under aerobic conditions. Results indicated that the test bacterium was extensively capable of decolorizing MB as a non-growth substrate in the presence of glucose and organic nitrogen sources. The experiments in the aerated stirred tank reactor showed the MB degradation rate was 4 to 6 times higher than the non-aerated reactor. The kinetic studies on initial specific MB biodegradation rate indicated MB had a uncompetitive inhibitory role on its degradation at high concentrations. The high degradative activities of R. eutropha in this study showed a high potential application of the bacterium in biological MB decomposition.
REFERENCES
Akhtar, S., Ali Khan, A. and Husain, Q. (2005). Partially purified bitter gourd (Momordica charantia) peroxidase catalyzed decolorization of textile and other industrially important dyes. Bioresour. Technol., 96(16), 1804-1811.
Ambatkar, M. and Mukundan, U. (2014). Calcium salts enhance activity and azo dye decolorization capacity of crude peroxidase from Armoracia
rusticana. Am. J. Plant Sci., 5(2), 212-218.
Balapure, K.H., Jain, K., Chattaraj, S., Bhatt, N.S. and Madamwar, D. (2014). Co-metabolic degradation of diazo dye- reactive blue 160 by enriched mixed cultures BDN. J Hazard. Mater., 279, 85-95.
Cetin, D. and Donmez, G. (2006). Decolorization of reactive dyes by mixed cultures isolated from textile effluent under anaerobic conditions. Enzyme Microb. Technol., 38(7), 926-930.
Chatterjee, S., Kumar, A., Basu, S. and Dutta, S. (2012). Application of response surface methodology for methylene blue dye removal from aqueous solution using low cost adsorbent. Chem. Eng. J., 181, 289-299.
Chen, K.C., Wu, J.Y., Liou, D.J. and Hwang, S.C.J. (2003). Decolorization of the textile dyes by newly isolated bacterial strains. J. Biotechnol., 101(1), 57-68. Dhananasekaran, S., Palanivel, R. and Pappu, S. (2016). Adsorption of methylene blue, bromophenol blue, and coomassie brilliant blue by a-chitin nanoparticles, J. Adv. Res., 7(1), 113-124.
Eskizeybek, V., Sarı, F., Gulce, H., Gulce, A. and Avcı, A. (2012). Preparation of the new polyaniline/ZnO nanocomposite and its photocatalytic activity for degradation of methylene blue and malachite green dyes under UV and natural sun lights irradiations. Appl. Catal. B, 119, 197-206.
European Communities Regulations (1989). Quality of Surface Water Intended for the Abstraction of Drinking Water, S.I. No 294 of 1989.5.
Garg, V.K., Amita, M., Kumar, R. and Gupta, R. (2004). Basic dye (methylene blue) removal from simulated wastewater by adsorption using Indian rosewood sawdust: a timber industry waste. Dyes Pigm., 63(3), 243-250.
Gomaa, O.M., Selim, N.S. and Linz, J.E., (2013). Biochemical and biophysical response to calcium chloride stress in Aspergillus niger and its role in malachite green degradation. Cell Biochem. Biophys., 65(3), 413-423.
Habibi, A. and Sharifi, S. (2016). Kinetic modelling for simultaneous biodegradation of phenol and formaldehyde at inhibitory concentrations by Ralstonia eutropha. Clean Soil Air Water, 44(9), 1113-1122.
Hameed, B.H., Mahmoud, D.K. and Ahmad, A.L. (2008). Equilibrium modeling and kinetic studies on the adsorption of basic dye by a low-cost adsorbent: Coconut (Cocos nucifera) bunch waste. J. Hazard. Mater., 158(1), 65-72.
Han, K. and Levenspiel, O. (1988). Extended Monod kinetics for substrate, product, and cell inhibition. Biotechnol. Bioeng., 32(4), 430-43. Houas, A., Lachheb, H., Ksibi, M., Elaloui, E., Guillard, C. and Herrmann, J.M. (2001). Photocatalytic degradation pathway of methylene blue in water. Appl. Catal. B, 31(2), 145-157. Isik, M. and Sponza, D.T. (2003). Effect of oxygen on decolorization of azo dyes by Escherichia coli
and Pseudomonas sp. and fate of aromatic amines,
Process Biochem., 38(8), 1183-1192.
methylene blue biodegradation in a sequencing batch reactor. Desalination, 276, 233-238.
Mathew, S. and Madamwar, D. (2004). Decolorization of ranocid fast blue dye by bacterial consortium SV5. Appl. Biochem. Biotechnol., 118, 371-381.
Matsuo, S., Sakaguchi, N., Yamada, K., Matsuo, T. and Wakita, H. (2004). Role in photocatalysis and coordination structure of metal ions adsorbed on titanium dioxide articles: a comparison between lanthanide and iron ions. Appl. Surf. Sci., 228, 233-244.
Mohana, S., Shrivastava, S., Divecha, J. and Madamwar, D. (2008). Response surface methodology for optimization of medium for decolorization of textile dye Direct Black 22 by a novel bacterial consortium. Bioresour. Technol., 99(3), 562-569.
Motamedi, M., Habibi, A., Maleki, M. and Vahabzadeh, F. (2015). Experimental investigation and kinetic modeling of p-nitrophenol and phenol by kissiris-immobilized Ralstonia eutropha in a batch reactor. Clean Soil Air Water, 43(2), 237–243. Naumann, D., Helm, D. and Labischinski, H. (1991). Microbiological characterizations by FT-IR spectroscopy. Nature, 351, 81-82.
Nickzad, A., Mogharei, A., Monazzami, A., Jamshidian, H. and Vahabzadeh, F. (2012). Biodegradation of phenol by Ralstonia eutropha in a kissiris-immobilized cell bioreactor. Water Environ. Res. 84(4), 626-634.
Noraini, C.H.C., Morad, N., Norli, I., Teng, T.T. and Ogugbue, C.J. (2012). Methylene blue degradation by Sphingomonas paucimobilis under aerobic conditions. Water, Air, Soil Pollut., 223(8), 5131-5142.
Ong, S.A., Toorisaka, E., Hirata, M. and Hano, T. (2005). Biodegradation of redox dye methylene blue by up-flow anaerobic sludge blanket reactor. J. Hazard. Mater. 124, 88-94.
Palanivelan, R., Rajakumar, S. and Ayyasamy, P.M. (2014). Effect of various carbon and nitrogen sources on decolorization of textile dye remazol golden yellow using bacterial species. J. Environ. Biol., 35(5), 781-787.
Radha, K.V., Regupathi, I., Arunagiri, A. and Murugesan, T. (2005). Decolorization studies of synthetic dyes using Phanerochaete chrysosporium
and their kinetics. Process Biochem., 40(10), 3337-3345.
Saratale, R.G., Saratale, G.D., Chang, J.S. and Govindwar, S.P. (2011). Bacterial decolorization and degradation of azo dyes: a review. J. Taiwan Inst. Chem. Eng., 42(1), 138-157.
Sharma, P., Singh, L. and Dilbaghi, N. (2009). Optimization of process variables for decolorization of disperse yellow 211 by Bacillus subtilis using Box–Behnken design. J. Hazard. Mater., 164, 1024-1029.
Sponza, D.T. and Isik, M. (2002). Decolorization and azo dye degradation by anaerobic/aerobic sequential process. Enzyme Microb. Technol., 31, 102-110.
Tan, L., Ning, S., Zhang, X. and Shi, S. (2013). Aerobic decolorization and degradation of azo dyes by growing cells of a newly isolated yeast Candida
tropicalis TL-F1. Bioresour. Technol., 138,
307-313.
Tunali Akar, S., Akar, T. and Cabuk, A. (2009). Decolorization of a textile dye, reactive red 198 (RR198), by Aspergillus parasiticus fungal biosorbent, Braz. J. Chem. Eng., 26(2), 399-405. van Schie, P.M. and Young, L.Y. (2000). Biodegradation of phenol: mechanisms and applications. Bioremediation J., 4(1), 1-18.