ISSN: 1735-0344 Tanaffos 2013; 12(1): 36-41
Association between Severity of Chronic Obstructive
Pulmonary Disease and Lung Function Tests
Hamid Reza Jamaati 1, Bahareh Heshmat 1, Ronak Tamadon 1, Abbas Hamidi Rad 1, Seyed Amir Mohajerani 2, Golnar Radmand 1 Seyed Mohammad Reza Hashemian 3
1 Tobacco Prevention and Control Research Center, 2 Tracheal Diseases Research Center, 3 Chronic Respiratory Disease Research Center, National Research Institute of Tuberculosis & Lung Disease, Shahid Beheshti University of Medical Sciences, Tehran, Iran
Received: 5 May 2012 Accepted: 10 November 2012 Correspondence to: Hashemian SMR Address: NRITLD, Shaheed Bahonar Ave, Darabad, TEHRAN 19569, P.O:19575/154, IRAN Email address: [email protected]
Background: The burden of chronic obstructive pulmonary disease (COPD) is quite high and its prevalence is increasing. We aimed to evaluate the correlation of COPD severity according to the American Thoracic Society (ATS) criteria with spirometric measurements in patients admitted to the emergency ward. Materials and Methods: In this cross-sectional descriptive study, 50 randomly selected patients with COPD admitted to the emergency ward in a tertiary care center were evaluated. The COPD severity according to the ATS criteria was measured and its association with spirometric findings was evaluated. The statistical analysis was performed by SPSS software and the Kendall's tau-b correlation test.
Results: The mean age (±standard deviation) was 64.3 ± 11.3 years. Twelve percent were females and 88 percent were males. The COPD severity, according to the ATS criteria, was mild in 16%, moderate in 48%, severe in 32% and very severe in four percent. There was a statistically significant correlation between total lung capacity (TLC) and COPD severity (P=0.013, r=275). Besides, there was a statistically significant correlation between functional residual capacity (FRC) and COPD severity (P=0.022, r=255). Age, sex, and the other spirometric findings especially FEV1 and FVC had no association with COPD severity (P > 0.05).
Conclusion: According to the obtained results, it is concluded that determining the COPD severity according to the ATS criteria may help the physicians to estimate the patients' prognosis and therapeutic planning. However, the spirometric measurements may not be replaced by ATS criteria.
Key words: Chronic Obstructive Pulmonary Disease (COPD), Severity,
Spirometry
INTRODUCTION
Currently, chronic obstructive pulmonary disease (COPD) is the fourth leading cause of death worldwide, and there has been no sign of decrease or stabilization of this epidemiological trend (1,2). The prevalence of COPD is strongly associated with smoking habits and age distribution of the studied population (3), whereas the 7-year cumulative incidence of COPD was 11.0% based on GOLD criteria compared to 4.9% in GOLD II criteria (4). The natural history of COPD is characterized by progressive deterioration in pulmonary function
manifesting as increased respiratory effort and respiratory failure (5), and a progressive increase in the frequency of exacerbations with an increase in cough, purulent sputum production, and dyspnea, which indeed negatively affect the quality of life of patients and limit their function (6). In some patients, mostly those with severe airflow obstruction, severe respiratory failure occur periodically and may require frequent admission to emergency ward and mechanical ventilation. In fact, respiratory failure associated with COPD is responsible for about 12.5% of the emergency ward admissions (7). Data from follow-ups of
patients often demonstrate 5-year mortality of about 50% and even higher (8) mostly due to cardiopulmonary failure and exacerbation.
Essentially, COPD severity has direct effect on prognosis, and it is one of the major determinants of mortality, and exacerbation. On the other hand, severity of COPD has a major effect on response to treatment. Consequently, current treatment algorithms are not crystal clear due to the lack of definitive determination of severity. The grading of airway obstruction and severity is currently based on the international guidelines and criteria using both clinical and para-clinical (spirometric) findings in COPD patients. These guidelines include: British Thoracic Society (BTS), European Respiratory Society (ERS), Global Initiative for Chronic Obstructive Lung Disease (GOLD), and American Thoracic Society (ATS).
One of the most valid clinical guidelines has been established by ATS (9) which includes both clinical and spirometric criteria. An alternative to spirometery to estimate of severity of structural and functional strictures is plethysmigraphy (10). In this study, we embarked on evaluation of reliability and validity of association between COPD severity based on ATS criteria and spirometric findings in COPD patients admitted to the emergency ward in our respiratory referral hospital. The ultimate aim was to evaluate the possibility of replacement of ATS score with time-consuming PFT in such emergent situations in a busy respiratory referral hospital.
MATERIALS AND METHODS
Patient Selection and Study Design:
This was an observational descriptive analytical cross-sectional study of 50 COPD patients admitted to the emergency ward of this hospital, between January 2009 and January 2010. The medical charts of those patients were reviewed. The study was approved by the hospital ethics committee and informed consents were collected from all patients enrolled in this study according to University Hospital Ethical Board Committee. The diagnosis of COPD was based on the medical history, symptoms, chest radiograph and spirometry. The diagnosis was confirmed by the lung function criteria of the ATS guideline (11). ATS score was measured based on
the obstructive form of chronic bronchitis. In this study chronic bronchitis was defined either as a report of physician diagnoses or the symptom of chronic productive cough as defined if patients usually have phlegm when coughing, or have phlegm which is difficult to bring up, most days in periods of at least three months, during at least two successive years. Airway obstruction was defined as FEV 1 /FVC < 0.75 (12). Spirometric ATS was defined as FEV 1 /FVC < 0.75 regardless of symptoms. Dyspnea was explained when the patient complained of shortness of breath when hurrying on level ground or up a slight hill. Patients with other chronic respiratory diseases (occupational lung disorder, bronchiectasis, interstitial lung disease, tuberculosis, or malignancy), previous thoracic surgery, or a history of asthma were excluded.
Spirometry and ATS Score
Data on age, gender, number of exacerbations, amount of cigarettes smoked, cardiac ejection fraction, arterial blood gas (ABG) findings, spirometry, and severity of COPD according to ATS score, and comorbidities were collected, as well as clinical data (13, 14). ATS criteria for COPD were the obstructive form of chronic bronchitis or emphysema. In this study chronic bronchitis or emphysema was defined either as a report of physician diagnoses or the symptom of chronic productive cough as defined below. Airway obstruction was defined as FEV1 /FVC < 0.75 (12). The spirometry was performed by using a dry volume spirometer 3 days after admission to emergency ward. The test procedure followed the ATS recommendations. Subjects reporting pulmonary diseases other than obstructive types were excluded from the analyses. The lung function tests and the structured interviews were performed by specially trained nurses.
Statistical Analysis
correlation between all quantitative variables and severity of shortness of breath, since it was a non-parametrical variable, we used Kendall rank correlation test, and for qualitative variables like gender or history of exacerbation we used a non-parametrical Mann–Whitney U test. After univariate analysis of all variables which had significant relationship with severity of shortness of breath, we used a logistic regression test. The variable of response of the interest was ATS score which was defined as below and above 3. All the variables were entered as predictive variable in logistic regression model, and both forward and backward stepwise likelihood ratio was used to calculate the variables for prediction of severity of shortness of breath.
RESULTS
The mean age of patients in this study was 64.3±11.3 years. Six patients (12%) were females and 44 patients (88%) were males. The severity of COPD based on ATS score in 8 patients (16%) was mild, in 24 patients (48%) moderate, in 16 patients (32%) severe, and in 2 patients (4%) very severe. The mean rate of smoking among patients was 47.2±33.4 packs per year. The mean number of exacerbation attacks was 4.7±3.9 times per year. Basic characteristics of study population, including age distribution, lung function and smoking habits are listed in Table 1.
Table 1. Demographic characteristics, arterial blood gas (ABG), and left ventricular function
findings of COPD patients.
Mean Std.
Deviation Minimum Maximum
Patient's Age 64.28 11.30656 33 86
Patient's Smoking (pack year) 47.1591 33.42464 4 160
Patient's COPD History 4.7037 3.8612 1 15
Blood PaCO2 44.674 9.48067 27.4 68.4
Blood HCO3 24.926 5.25745 14.4 35.9
Blood PaO2 61.208 19.81141 39.5 122.5
Blood PH 7.3572 0.07186 7.09 7.49
LVEF* 56.9792 16.55872 20 160
PAP§ 44.3871 15.11881 25 85
*LVEF: Left ventricular ejection fraction; §PAP: Pulmonary artery pressure
The timing of data about symptoms and lung function was not relative to the emergency ward admission. Spirometric findings of COPD patients in this study are demonstrated as mean± standard deviation, minimum and maximum (Table 2), in which total lung capacity (TLC), functional residual capacity (FRC), and residual volume (RV) had the lowest predicted values. In addition, lung function measures are also depicted as percent predicted in order to allow comparison with other populations (PFEV1, PFVC, PFEV Ratio, PFEF25-75, PTLC, PIC, PFRC, PRV, PRaw, PSRaw, PFRC ratio).
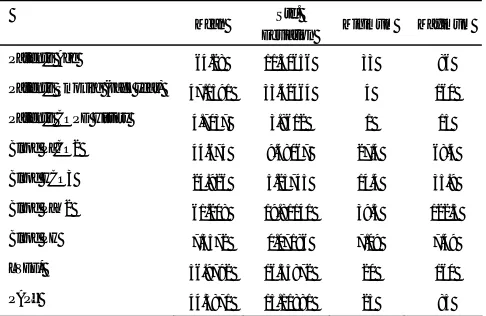
Table 2. Spirometric findings of COPD patients are shown as mean ± standard deviation,
minimum and maximum. In addition, lung function measures are also depicted as percent predicted in order to allow comparison with other populations (PFEV1,PFVC,PFEV Ratio,PFEF25-75, PTLC, PIC, PFRC, PRV, PRaw, PSRaw, PFRC ratio).
Mean Std. Deviation Minimum Maximum
FEV1 2.2742 8.77727 0.41 63
PFEV1 39.44 20.75234 12 103
FVC 1.4978 0.67203 0.53 4.06
PFVC 44.24 19.00973 14 92
FEV1/FVC 70.072 17.94885 38 100
PFEV Ratio 92.694 24.46614 50 139
FEF25-75 0.9054 0.80654 0.21 4.76
PFEF 25 30.68 27.90541 5 136
TLC 6.9128 1.96403 3.27 13.01
PTLC 114.12 26.14141 50 203
IC 1.1356 0.60235 0.21 3.35
PIC 33.32 16.78245 6 86
FRC 5.7803 1.99386 2.14 12.5
PFRC 173.48 54.70039 61 367
RV 5.2854 1.88777 2.08 12.17
PRV 230.38 82.84923 88 528
Raw 0.9546 0.56444 0.23 2.64
PRaw 318.22 188.4171 78 882
SRaw 5.6276 3.7952 0.5 18.63
PSRaw 805.66 506.9752 67 2474
RV/TLC 74.76 9.14411 47 94
PRV Ratio 194.7 36.07037 131 292
FRC/TLC 82.62 8.97818 57 96
PFRC Ratio 145.36 17.5961 103 178
PI max 39.52 18.02067 6 94
Lung Physical Test 326.14 160.7772 76 720
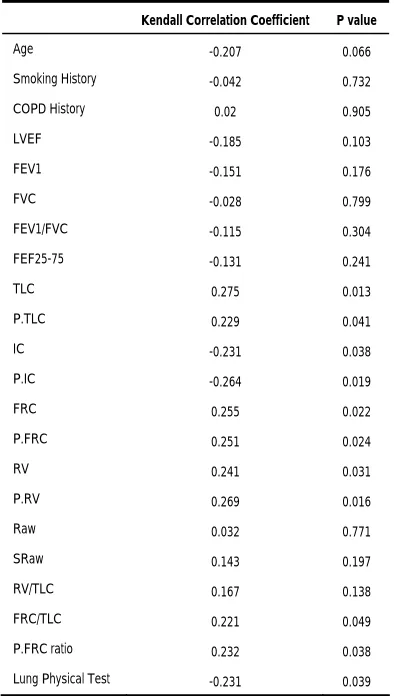
ATS criteria could not demonstrate any statistically significant difference between smoker and non-smoker groups (P>0.05). Correlation coefficient of different COPD risk factors and spirometeric findings with severity of dyspnea has listed in Table 3. In univariate analysis, from the long list used in this study, TLC, PTLC, inspiratory capacity (IC), PIC, RV, PRV, FRC, PFRC, FRC/TLC, PFRC ratio, and Lung Physical Test had significant correlations with the severity of dyspnea and were significantly effective on ATS score.
Table 3. Correlation of different COPD risk factors and severity of dyspnea.
Kendall Correlation Coefficient P value
Age -0.207 0.066
Smoking History -0.042 0.732
COPD History 0.02 0.905
LVEF -0.185 0.103
FEV1 -0.151 0.176
FVC -0.028 0.799
FEV1/FVC -0.115 0.304
FEF25-75 -0.131 0.241
TLC 0.275 0.013
P.TLC 0.229 0.041
IC -0.231 0.038
P.IC -0.264 0.019
FRC 0.255 0.022
P.FRC 0.251 0.024
RV 0.241 0.031
P.RV 0.269 0.016
Raw 0.032 0.771
SRaw 0.143 0.197
RV/TLC 0.167 0.138
FRC/TLC 0.221 0.049
P.FRC ratio 0.232 0.038
Lung Physical Test -0.231 0.039
In multivariate analysis, response of the interest was defined as increase in having ATS score of 3 or more. Risk factors for COPD by multiple logistic regression model with sex, age, smoking habits and family history of obstructive lung disease as independent variables, and the
criteria of clinical and spirometric ATS as dependent variables were statistically calculated. When a multiple logistic regression model was applied, the major risk factors for COPD were increase in TLC with odds ratio of 32.5 (2.2-481.1), and PTLC, RV, and Lung Physical Test (Table 4).
Table 4. Increase in quantitative variables with odds ratio on response of interest which was
defined as ATS score 3 or more.
OR Lower 95% CI Upper 95% CI P value
TLC 32.538 2.201 481.048 0.011
P.TLC 0.902 0.817 0.995 0.04
RV 0.022 0.001 0.596 0.023
P.RV 1.058 1.008 1.111 0.023
Lung Physical Test 0.988 0.979 0.997 0.007
OR = odds ratio; CI = 95% confidence interval.
Analysis of the interaction between different spirometric variables and severity of shortness of breath by using the additive scale in a multiple logistic regression model was significant with an obvious synergistic effect, which may be explained by the interaction between spirometeric finding and ATS score. Variables including PRV and lung Physical test showed a significant ratio of the odds of severity of dyspnea in COPD patients in forward equation of logistic regression (Table 5).
Table 5. Variables correlated with severity of dyspnea in forward equation of logistic
regression.
OR Lower 95% CI Upper 95% CI P-value
PRV 1.012 1.003 1.022 0.011
Lung Physical Test 0.995 0.991 1 0.054
OR = odds ratio; CI = 95% confidence interval.
DISCUSSION
matter of fact, different studies have suggested using different guidelines such as ATS to estimate the severity of dyspnea, patients' prognosis (15), and therapeutic planning, but many others have rejected the idea and suggested spirometry as the only reliable tool for determining gradual deterioration in pulmonary function and consequent worsening of quality of life. On the whole, there is no general consensus on correlation of COPD severity and using ATS criteria scores.
Our results demonstrated that COPD severity has a direct effect on ATS criteria, and ATS clinical score has a direct correlation with many spirometric findings.; 36% of COPD patients were severe and very severe in whom spirometric numbers including TLC, P.TLC, RV, P.RV, Lung Physical Test were significantly correlated to ATS score. This may be due to the fact that ATS scoring system consists of both clinical and spirometric findings. Likewise, other studies have granted ATS scores for more appropriate distribution of severity of obstruction, which have led to more accurate treatment of obstruction in these patients (16-18). In a study by Lindberg et al, in 2005 on 4,851 patients (19), based on ATS scoring criteria, 12.2% of people had severe COPD which was less than the numbers in our study. Moreover, in Camargo et al, study in 2008 (20), they found a statistically meaningful relationship between clinical scoring criteria of patients and spirometric findings consistent with our data. In Esteban et al, study of a prospective 5-year cohort (21), sensitivity and specificity of ATS criteria for detecting severe forms of COPD were 0.37 and 0.89, respectively which showed a statistically significant relationship between ATS scores and COPD similar to our study. We speculate that detection of COPD severity is strongly dependent on the type of criteria used and target population (10).
On the other hand, among all spirometric findings in our study only TLC, RV, and FRC/TLC had statistically significant correlation with severity of COPD. Likewise, in Camargo study FEV1, PEF, and FVC had insignificant correlation with severity of COPD, and only VC showed significant correlation with severity. Furthermore,
Swanney et al, in their study provided evidence for validity of the ATS spirometric algorithm using FVC and forced expiratory volume for predicting a reduced TLC (22).
Another aspect of this study was demonstrating that our findings in ER admitted COPD patients are relevant to more general COPD populations. Our results illustrated that mortality in patients with severe COPD in emergency does not depend on age, cor pulmonale, or prior admission to hospital, and need for admission to the emergency ward during follow-up was an independent predictor of mortality. In Lindberg study, severity of COPD was related to age, smoking habits and family history of obstructive airway disease but not to gender. However, we did not find such correlations which could be due to variability in study design and target population. In a cohort study by Tsoumakidou et al, on 67 COPD patients (23), severity of disease was defined as number of admissions and compared to ATS, ERS and GOLD criteria. (11)
In conclusion, according to our results and their comparison with those of other studies, it seems that applying ATS severity scores for COPD patients has an appropriate application compared to spirometric findings in both general COPD and emergency admitted patients.
Conflict of Interest
The authors of this article declare no conflict of interest, and no financial, consulting, or personal relationships with any other people or organizations that could influence (bias) the authors’ work.
Acknowledgment
The authors would like to express their gratitude to Mrs. Roya Teimoori at the spirometry unit of Masih Daneshvari Hospital.
REFERENCES
1. Global Initiative for Chronic Obstructive Lung Disease
Chronic Obstructive Lung Disease. Available from:
http://www.goldcopd.com
2. Gulsvik A. The global burden and impact of chronic obstructive pulmonary disease worldwide. Monaldi Arch
Chest Dis 2001; 56 (3): 261- 4.
3. Viegi G, Scognamiglio A, Baldacci S, Pistelli F, Carrozzi L. Epidemiology of chronic obstructive pulmonary disease (COPD). Respiration 2001; 68 (1): 4- 19.
4. Lindberg A, Eriksson B, Larsson LG, Rönmark E, Sandström T, Lundbäck B. Seven-year cumulative incidence of COPD in an age-stratified general population sample. Chest 2006; 129 (4): 879- 85.
5. MacIntyre N, Huang YC. Acute exacerbations and respiratory failure in chronic obstructive pulmonary disease. Proc Am
Thorac Soc 2008; 5 (4): 530- 5.
6. Agustí AG, Noguera A, Sauleda J, Sala E, Pons J, Busquets X. Systemic effects of chronic obstructive pulmonary disease. Eur
Respir J 2003; 21 (2): 347- 60.
7. Pincelli MP, Grumann AC, Fernandes C, Cavalheiro AG, Haussen DA, Maia IS. Characteristics of COPD patients admitted to the ICU of a referral hospital for respiratory diseases in Brazil. J Bras Pneumol 2011; 37 (2): 217- 22. 8. Lundbäck B, Eriksson B, Lindberg A, Ekerljung L, Muellerova
H, Larsson LG, et al. A 20-year follow-up of a population study-based COPD cohort-report from the obstructive lung disease in Northern Sweden studies. COPD 2009; 6 (4): 263-71. 9. Standards for the diagnosis and care of patients with chronic
obstructive pulmonary disease. American Thoracic Society.
Am J Respir Crit Care Med 1995; 152 (5 Pt 2): S77- 121.
10. Jamaati HR, Shadmehr MB, Aloosh O, Radmand G, Mohajerani SA, Hashemian SMR. Evaluation of plethysmography for diagnosis of postintubation tracheal stenosis. Asian Cardiovascular and Thoracic Annals 2013; 21: 181-6.
11. Miller MR, Hankinson J, Brusasco V, Burgos F, Casaburi R, Coates A, et al. Standardisation of spirometry. Eur Respir J 2005; 26 (2): 319- 38.
12. Evaluation of impairment/disability secondary to respiratory disorders. American Thoracic Society. Am Rev Respir Dis 1986; 133 (6): 1205- 9.
13. Knaus WA, Draper EA, Wagner DP, Zimmerman JE. APACHE II: a severity of disease classification system. Crit
Care Med 1985; 13 (10): 818- 29.
14. Velayati AA, Mehrabi Y, Radmand G, Khadem Maboudi AA, Jamaati HR, Shahbazi A, Mohajerani SA, Hashemian SMR.
Modification of Acute Physiology and Chronic Health
Evaluation II score through recalibration of risk prediction model in critical care patients of a respiratory disease referral
center. IJCIIS; 2013: 3 (1): 40- 5.
15. Lin SH, Kuo PH, Kuo SH, Yang PC. Severity staging of chronic obstructive pulmonary disease: differences in pre- and
post-bronchodilator spirometry. Yonsei Med J 2009; 50 (5): 672- 6.
16. Gardner ZS, Ruppel GL, Kaminsky DA. Grading the severity of obstruction in mixed obstructive-restrictive lung disease.
Chest 2011; 140 (3): 598- 603.
17. Itabashi S. Lung function test for COPD. Nihon Rinsho 2003; 61 (12): 2150- 7.
18. Akashiba T. Stage and prognosis of COPD. Nihon Rinsho
2003; 61 (12): 2089- 93.
19. Lindberg A, Jonsson AC, Rönmark E, Lundgren R, Larsson
LG, Lundbäck B. Prevalence of chronic obstructive pulmonary
disease according to BTS, ERS, GOLD and ATS criteria in
relation to doctor's diagnosis, symptoms, age, gender, and
smoking habits. Respiration 2005; 72 (5): 471- 9.
20. Camargo CA Jr, Tsai CL, Clark S, Kenney PA, Radeos MS.
Spirometric correlates of dyspnea improvement among
emergency department patients with chronic obstructive
pulmonary disease exacerbation. Respir Care 2008; 53 (7): 892-
6.
21. Esteban C, Quintana JM, Egurrola M, Moraza J, Aburto M,
Pérez-Izquierdo J, et al. Classifying the severity of COPD: are
the new severity scales better than the old? Int J Tuberc Lung
Dis 2009; 13 (6): 783- 90.
22. Swanney MP, Beckert LE, Frampton CM, Wallace LA, Jensen
RL, Crapo RO. Validity of the American Thoracic Society and
other spirometric algorithms using FVC and forced expiratory
volume at 6 s for predicting a reduced total lung capacity.
Chest 2004; 126 (6): 1861- 6.
23. Tsoumakidou M, Tzanakis N, Voulgaraki O, Mitrouska I,
Chrysofakis G, Samiou M, et al. Is there any correlation
between the ATS, BTS, ERS and GOLD COPD's severity scales
and the frequency of hospital admissions? Respir Med 2004; 98