in the population sciences published by the Max Planck Institute for Demographic Research Konrad-Zuse Str. 1, D-18057 Rostock · GERMANY www.demographic-research.org
DEMOGRAPHIC RESEARCH
VOLUME 17, ARTICLE 20, PAGES 591-622
PUBLISHED 20 DECEMBER 2007
http://www.demographic-research.org/Volumes/Vol17/20/ DOI: 10.4054/DemRes.2007.17.20
Research Article
Family migration and mobility sequences
in the United States:
Spatial mobility in the context of the life course
William A. V. Clark
Suzanne Davies Withers
Special Collection 6: Interdependencies in the Life Course, edited by Hill Kulu and Nadja Milewski.
© 2007 Clark & Davies Withers
This open-access work is published under the terms of the Creative Commons Attribution NonCommercial License 2.0 Germany, which permits use, reproduction & distribution in any medium for non-commercial purposes, provided the original author(s) and source are given credit.
1 Introduction 592
2 Context and literature 593
3 Data, variables, and measurement 599
4 Analyses 602
4.1 Sequential moving behavior and explanations 602
4.2 Models of sequential moves 607
4.2.1 First moves 608
4.2.2 Conditional moves 610
5 Conclusions 614
6 Acknowledgements 615
References 616
Family migration and mobility sequences in the United States:
Spatial mobility in the context of the life course
William A.V. Clark 1
Suzanne Davies Withers 2
Abstract
Significant changes in family composition in the past quarter-century raise important questions about life-course outcomes embedded in these family changes, especially in relation to the migratory and mobility patterns of individuals and families. The classic distinction between long-distance/employment and short-distance/housing-related moves may be eroding. Patterns of movement appear much less dichotomous and more diverse as family structures become more diverse. Using the Panel Study of Income Dynamics this study shows that the previous research, which suggested relatively simple links between long-distance and short-distance moves, is an over-simplification. Moreover, there is much more unintended movement at both migratory and mobility scales suggesting the economic models of employment migration may be missing important family dynamics in the migration mobility process.
1. Introduction
Migration and residential mobility are integral parts of societal change and American individuals and households, perhaps more than in any other society, are especially mobile and have always been so. Even though mobility has declined slightly, with an aging society, mobility rates are still significantly higher in the United States than they are in most European societies. But whether it is mobility in American urban areas or European cities, mobility and migration have always been of great interest to spatial demographers, because it is the outcomes of migration and mobility that change neighborhoods and cities. Most recently, the outcomes of literally thousands of mobility decisions made every year can be seen in the fundamental changes in ethnic neighborhoods, as cities in America, and indeed in Europe, react to the impact of fundamental shifts in international migration and their local outcomes.
Geographers and spatial demographers have developed a rich research literature on migration and residential mobility. We know a great deal about why people move and about the processes of choice that they engage in during the migration and mobility process. Now the research on migration and mobility has been enriched by placing it within the framework of the life course. The life-course approach to residential mobility and migration focuses on the link between life events and the intersection of these events with spatial outcomes. More than a decade ago, Odland and Shumway (1993) and Mulder and Wagner (1993) drew attention to the inter-dependencies between migration and other life events, especially marriage. Their research and the work that followed asked about the connections between marriage, the birth of children, divorce, and other life changes and residential mobility and migration.
Geographers in particular, but spatial demographers too, have been particularly concerned to relate the changes in the life course to geographical outcomes. Geographers have argued that the spatial outcomes are as important as the processes of migration itself. Places change as people enter and leave them and if the composition of the population entering a particular location is different from the composition of the population already there then there will be a variety of ramifications for that community or neighborhood. Thus, when families with children move into a community, there will be demands for schools and facilities that serve young families. In contrast, in those communities with increasing numbers of older people there will be demands for very different kinds of facilities and access. These simple examples indicate the potential of mobility and migration to change places.
dissolve often in association with long-distance moves. Because families, either with children or without, are still the largest proportion of all households, there has been particular concern with the outcomes for married couples in the mobility and migration process. The focus on married couples has been further stimulated by the notable change in the number of married couples with children over the past three decades.
This research tackles the question of the migration and mobility behavior of married couples in the United States. We place our research within the context of the life course and in particular, we are concerned with the sequences of long-distance and short-distance moves. The central question which guides this work of course is why households make the moves they do, and what is new from a sequential analysis of relocation behavior? Specifically, we examine the links between long-distance moves often motivated by employment decisions and the local moves which adjust the housing that is consumed by particular household combinations. In the past the research has asserted that long-distance moves were followed by short-distance adjustment moves as people finally located housing that was suitable. What we will show is that this simplistic interpretation is much more complex and is inter-related with complex family changes. We argue that there is considerable dynamism in the intersection of long-distance and short-distance moves and family change. We believe that long-distance and local moves are part of the dynamic process of change across space and over time and that this is an increasingly complex process. There is greater complexity in the mobility process and its intersection with family change than is revealed in studies that focus on either migration or residential mobility. In addition we show that there is considerable serendipitous or unintended relocation embedded in migration and mobility.
2. Context and literature
later in their thirties, but both can proceed in a somewhat linear fashion to buy a house and have children, though at quite different moments in their age trajectory. Clearly, the marriage ‘event’ occurred at two very different ages yet the process is part of a life course and it is that course that is important in the outcome, not the age-specific timing per se.
In the previous discussion marriage is a trigger, and we can think of other triggers quite easily. They range from changes in occupational careers to changes in family composition both positive (family additions) and negative (divorce and death). It is the fact that changes in any one of these careers may intersect with the others that provides a way of linking family compositions and mobility. In an event-history analysis, the events are the triggers or stimuli and have been the focus of substantial research in the attempts to understand the impact of the birth of a child (Clark et al.1984), of divorce (Dieleman and Schouw 1989), of marriage (Mulder and Wagner 1993, Odland and Shumway 1993) and family composition change (Davies Withers 1998) on migration and mobility. In a life course in which people have multiple and parallel careers, migration is an adjustment bringing the household into equilibrium in occupation or in location and housing consumption. Moves are undertaken to deal with events that have taken the household out of equilibrium (Clark and Dieleman 1996). Clearly, changes in any one of the occupational, family or housing careers can lead to changes in the others.
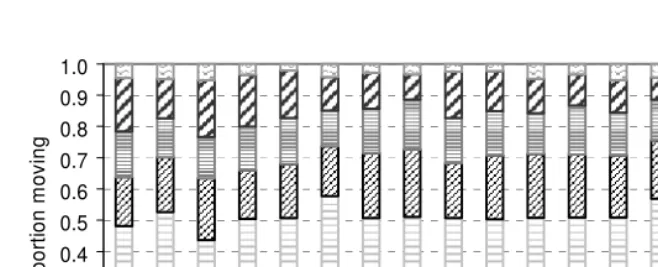
However, not all changes are anticipated. Unlike traditional research that has tended to focus on the normative sequencing and timing of events, the life-course perspective emphasizes the variability in the number, timing, and sequencing of events in parallel careers across peoples lives, and in so doing, draws attention to the variability and unpredictable nature of the life course (Rindfuss et al. 1987). This ‘disorder’ calls into question the utility of thinking in terms of orderly paths in the housing and occupational careers of families. What is the potential impact of disorder in the lifecourse on residential mobility and migration processes? How important is the unexpected or accidental event? In fact, there may be much more complexity in the migration and mobility process than is revealed by the mobility-housing/migration-employment dichotomy. An analysis of reasons for moving from the Panel Study of Income Dynamics (PSID) shows that roughly a quarter of all moves are unintended3 (see Figure 1). Clearly, there are additional dimensions to the migration/mobility process than the employment/housing explanations for relocation.
3 The PSID categorizes the reasons for moving into various purposive reasons, and groups together a variety of
Figure 1: Proportion moving by reason for all mobility types, 1975–1992
0.0 0.1 0.2 0.3 0.4 0.5 0.6 0.7 0.8 0.9 1.0
1975 1976 1977 1978 1979 1980 1981 1982 1983 1984 1985 1986 1987 1988 1989 1990 1991 1992
Year
P
ro
p
o
rt
io
n
m
o
v
in
g
Housing Unintended Employment Ambiguous Unknown
Source: Calculations based on PSID, 1975–92.
Much of this complexity is likely related to the increasingly complex gender relationships in two-worker households and especially dual-professional households. Substantial work has established that women’s roles have changed (Raley et al. 2006) and those changes have complicated the mobility behavior of households (Green et al. 1999, Jarvis 1999, Smits et al. 2003, Green 2004, Challiol and Mignonac 2005, Baldridge et al.
2006). While employment is still a primary reason for long-distance mobility, there is increasing evidence that the ways in which households operate with respect to other factors may be equally important in generating long-distance relocation (Cooke 2001, Boyle et al.
when migration decisions are made. Following this argument their research suggests that women who migrate long distances with their partners are most likely to be unemployed or economically inactive in contrast with women who moved long distances without their partners who were more likely to be employed (Boyle et al. 2001). That is, women have different roles and different outcomes in different household structures.
Previous work suggested that the connection between long-distance and short-distance moves was generated by local adjustments after major relocation (Goodman 1982). In this conceptualization households move a long distance and then adjust their location to better suit their needs with short-distance relocations within their new city. These short-distance or local movers are movers who do not have local knowledge, and when they acquire that local knowledge they adjust their housing types and often their neighborhoods as well. However, an alternative explanation for additional short-distance moves, after a long-distance move, may be related to repeat-mover behavior. The hypothesis tested previously (Goodman 1982), and which we will examine in this paper, is that both owners and renters have higher mobility rates if the previous move was long distance rather than local.
The frequent-mover hypothesis and the adjustment hypothesis were initiated by Goodman (1976) in which repeat moving was generated by the need for adjustment from the long-distance moves. Roseman (1971) provided a conceptual basis for the repeat-mover hypothesis by suggesting that long-distance repeat-movers have more difficulty simply because they have less local knowledge of the housing market to which they are moving. As a result, they may make additional moves, repeat moves, in order to bring the household into equilibrium with their needs. Research by Clark and Huang (2004) demonstrated that the repeat-mover and the adjustment hypothesis are not necessarily mutually exclusive although the evidence in general favors the repeat-mover conceptualization over the adjustment hypothesis. Indeed, Clark and Huang (2004) provided documentation that long-distance moves were much more likely to generate another long-distance move, suggesting a failed migration.
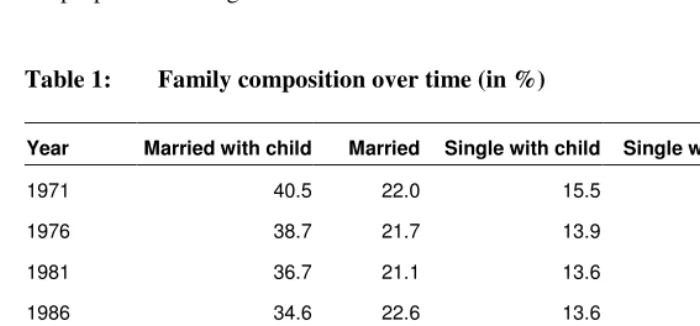
wealth, increased economic assets, greater likelihood of being healthy, and overall higher likelihood of satisfaction and happiness, the likelihood of marriage has decreased and the likelihood of divorce has increased. In the three decades of interest in this present study, the divorce rate has almost doubled between 1965 and 1980, with modest declines since 1980 (State of Our Unions 2005). The decline in married-couple households has been paralleled by a significant increase in the number of single male households and a rise in the proportion of single-headed households with children.
Table 1: Family composition over time (in %)
Year Married with child Married Single with child Single women Single men
1971 40.5 22.0 15.5 14.2 7.7
1976 38.7 21.7 13.9 15.8 10.0
1981 36.7 21.1 13.6 16.6 11.9
1986 34.6 22.6 13.6 17.3 11.9
1991 34.6 22.3 13.5 17.4 12.2
1996 29.6 21.5 17.4 16.9 14.7
2001 29.3 23.1 17.7 15.8 14.1
2003 27.2 23.9 17.9 16.1 14.8
Source: Calculations based on State of Our Unions 2005.
about rates of participation, and entries and exits in the labor force, we know much less about the way in which labor-force participation has influenced family connections, especially across generations. Plane et al. (2005) cite the life course as a powerful explanatory factor in understanding mobility down the U.S. urban hierarchy. Likewise, Rogerson et al. (1993) note the spatial disconnect across the life course that can result from highly mobile adult children living at considerable distance from their aging parents. As the baby boom matures and is sandwiched between caring for their elders and caring for their offspring, geographic mobility can have profound effects on intergenerational care and contact. For some there is a desire to return ‘home’ to be near helpful grandparents, likewise a desire to leave ‘home’ to be near grandchildren. These are expressions of the complex interaction of family structure and mobility. High levels of mobility generate change in places and in families.
But it is emerging that at least some of the continuing high mobility is generated by what we can call unintended relocations – moves which do not have any specific generating force. Numerous studies cite residential dissatisfaction as a common reason for local moves, but beyond this we have only limited substantive research on people’s intentions to move and whether they act upon these intentions (Lu 1998, 1999). There is still not very much research which actively investigates unintended mobility yet we will show that unintended moves represent a quarter of all reasons for moving. The traditional emphasis on economic rationality does not easily lend itself to studying unintended events. Two recent papers have made a call for greater consideration of the intentionality of migration and mobility. Smith (2004) builds on Halfacree’s (1995) thesis of the intentional/unintentional agency of family migrants, and both authors call for fuller understanding of non-economic reasons and outcomes in the family migration process. Interestingly, while academia has been reticent, the law has not. The Internal Revenue Service has codified what constitutes the ‘unforeseen circumstances’ of moving in the context of liability for capital gains tax on income derived from the selling of a home. The allowable events include disasters, death of a spouse, becoming unemployed, financial burden due to employment changes, divorce or legal separation, and multiple births from the same pregnancy (Silow 2006). All of these are triggers for relocation, including the last one which depicts unexpected space stress. The common thread amongst these is the unintended nature of the event.
shift to a service economy has destabilized employment spells. While long spells in employment are clearly relevant for professional workers, in fact, much of the mobility in and out of the labor force is not in the professional occupations and is frequent and unstable. A more detailed understanding of the dynamism of labor-force participation and the impacts and interactions of families will provide us with better ways to conceptualize the interdependencies of employment and mobility.
Our research adds to the literature by enriching the discussion of repeat-mover behavior and the adjustment hypothesis by examining the reasons that households give for their relocation behavior. In this way, we provide a much more nuanced explanation for long-distance and short-distance mobility behavior and by focusing on intentions and explanations, we are able to show the relative connections between housing related, employment related, and unintended behaviors in the mobility process.
3. Data, variables, and measurement
This study uses the Panel Study of Income Dynamics which is a longitudinal survey detailing the life course of thousands of American households since 1968. In this study, we restrict our analysis to married-couple households between the ages of 21 and 64 years with at least one member of the marriage active in the labor market during the interval from 1986 to 1993. Our sample has 14,521 families. We observe the mobility intentions, mobility behavior, employment dynamics, household dynamics, and general demographic and housing attributes of these families. We observe baseline family attributes in time 1, and follow changes in these various behaviors and attributes for three subsequent years (time 2 through time 4). Initially, we distinguish between families that are residentially stable, and families that move a short distance and a long distance. Ideally we would follow families from the onset of marriage, but over this interval this approach would not provide sufficient observations to study sequences. The purpose at hand is to examine the sequencing and intentions of families that move. So, all families are left-censored since we observe them initially in the same calendar year. Hence, there is variation in their duration of marriage and their duration of residence. Although the models used in this paper include some covariates that are associated with the duration of marriage, it is not measured directly4. Using the geo-coded survey information, short-distance moves were defined as a change of residence within the same county. Moves between county were considered long-distance moves. All of these long-long-distance moves were verified to be moves between labor-market areas5, with the exception of three households. Therefore, short-distance
4 We consider the issue of left-censoring in the interpretation of the findings.
5 Labor-market areas are provided by the 1990 census, and are generally defined by commuter zones.
moves are moves within the same county within the same labor-market area, and long-distance moves are moves between labor-market areas. Our initial investigation examines the sequence of moves and explores the underlying explanations for long-distance and short-distance moves. We then explore explanations for those who make long moves and short moves, conditional on earlier long and short moves. Throughout the analysis we explore the stated reasons for moving and the sequence of reasons for moving.
The Panel Study of Income Dynamics asks mobile household heads why they moved and categorizes the responses into eight reasons (Appendix 1). As well, we know the main reason why people moved since the categories are in priority order. In this study we grouped these categories such that moving for ‘employment’ represents people who move for purposive productive reason, such as to take another job, transfer, or move closer to work (codes 1 and 2). Included in moving for ‘housing’ purposes are those who move for purposive consumptive reasons, for example to have a larger (or smaller) home, more or less space, moving to homeownership, or getting married (codes 4 through 6). ‘Area’ related moves are purposive consumptive moves related to the neighborhood, such as moving to a better place or to go to school. Moves in response to outside events (code 7) are what we call ‘unintended’ moves. Included in this category are situations such as a dwelling coming down, being evicted, armed services transfer, health reasons, divorce, and retiring because of health. While the PSID code refers to these as involuntary reasons, we prefer to use the term ‘unintended’ for two reasons. First, even if an event occurs beyond someone’s control, still they are able to exercise volition in how they respond to it. We want to stay clear of this association between involuntary events and involuntary outcomes. For example, someone might not want to get divorced, but once it occurs one can respond in a variety of ways, including staying in the family home. Second, we use the term unintended to emphasis the unplanned nature of these moves. Unlike the prior categories which refer to purposive reasons, by contrast these reasons are not purposive but occur in response to outside events. These moves are unintended in the sense that they are unanticipated relative to the other types of moves.
group). Events include the birth of a child, marital dissolution, and transitions into and out of employment. Labor-market transitions are measured for both husbands and wives. As well, we measure professional/managerial occupational status amongst husbands (baseline is other occupations) and wives not in the labor market (working wives as the baseline). Marital events are limited in occurrence. Since all families begin in a married state, there are virtually no remarriages during the interval and very few marital dissolutions.
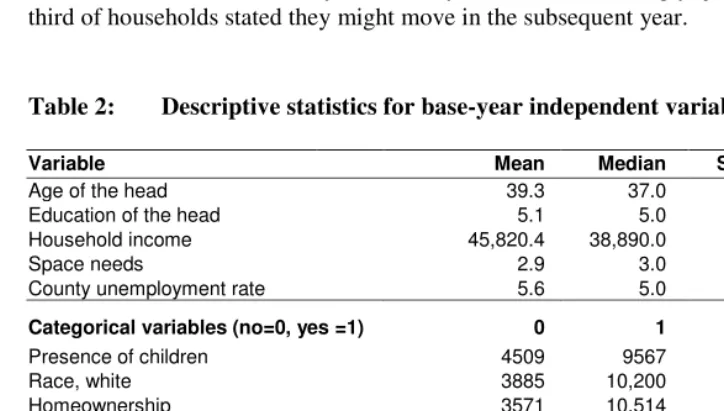
Two other important variables are constructed. We differentiate the families on the basis of whether the head is living in the same geographic area as during childhood, of which there are 28 percent. This allows us to capture populations that have already been geographically mobile and thus have different geographic attachment. As well, it is conceivable that these families may have reasons to migrate long distances to return to their place of origin. Our final variable is a measure of moving intentions. In the prior year households were asked if they were likely to move. Interestingly, just a little less than a third of households stated they might move in the subsequent year.
Table 2: Descriptive statistics for base-year independent variables
Variable Mean Median Standard deviation
Age of the head 39.3 37.0 10.3
Education of the head 5.1 5.0 1.7
Household income 45,820.4 38,890.0 39,654.0
Space needs 2.9 3.0 1.7
County unemployment rate 5.6 5.0 2.4
Categorical variables (no=0, yes =1) 0 1 Proportion
Presence of children 4509 9567 0.67
Race, white 3885 10,200 0.72
Homeownership 3571 10,514 0.74
Birth of a child 13,062 1023 0.07
Marital dissolution 13,443 642 0.04
Husband professional 9367 4718 0.33
Husband leaves employment 13,650 435 0.03
Husband enters employment 13,728 357 0.02
Wife leaves employment 13,258 827 0.05
Nonemployed wife 10,466 3619 0.25
Might move 9655 4430 0.31
Head’s geographic mobility 10,062 4023 0.28
4. Analyses
4.1 Sequential moving behavior and explanations
Frequent mover behavior is not unusual, several hundred households make long-distance moves followed by additional long or short moves and the same is true for households that make initial short-distance moves. While we have some theory to suggest why long-distance moves are followed by further moves, we are less clear about short-long-distance moves followed by long-distance moves although we might account for this by invoking the notion of a pre-emptive temporary relocation before the long-distance move. Such a conceptualization fits with the broad outlines of the adjustment hypothesis.
Approximately 14 percent of our PSID family sample moves in the initial interval (Figure 2). A little over 10 percent move locally and another 4 percent make long-distance relocations. The average mover ratio and the split between long- and short-distance moves replicate what is generally known about mobility and migration distances (Nivalainen 2004)6.
In this paper the focus is on the sequence of moves (Figure 2) and their explanations which we will take up in a following diagram. What is the follow-up behavior of those who move again after the initial move? We explore this for initial long-distance movers, short-distance movers and those who stay (Figure 2). For long-distance movers, 38 percent of them move again in the second year, nearly equally divided between further long- and short-distance moves. Slightly more than 60 percent stay. For short-distance movers, there is a much greater likelihood of a further short-distance move and the probability of a long-distance move is somewhat like initial long-long-distance moves – less than 5 percent. A significantly higher proportion of short-distance movers stay after the short move. It appears the household has been able to bring its housing needs into adjustment with the household characteristics. Stayers tend on the whole to continue staying. Less than 10 percent make any initial move after staying in the first interval. However, despite the relatively low percent of stayers who then make long or short-distance moves, the absolute numbers of these married couples is quite large; 349 couples make a long move after a stay, and 862 couples make a short move.
By year 4 there is a general tendency for repeat mobility to die out (Figure 2). The predominant outcomes across all categories are to stay. Stayers continue to stay, and many repeat long movers and repeat short movers become stayers. We can interpret this as the
6 The fact that all households are left censored has the greatest impact on their mobility status in the first time
mobility-migration process working to bring households into equilibrium with their occupational aspirations or their housing needs, or the outcomes of failed moves which return to their original locations. It is notable that the conditional long movers are the least likely to enter the stayer state. Only half of the year 4 sample become stayers. If we exclude the couples who stay across the 4 year interval the distribution is dominated by short movers who become stayers, either after more than one short move or a short move interrupted by a stay.
Figure 2: Structure of long-distance moves (Lm) and short-distance moves (Sm)
Year 1 Year 2 Year 3 Year 4 Percent Percent
% N % N % N of total of movers
Lm: 17.8 18 0.1 0.4
Sm: 31.7 32 0.2 0.8
S: 50.5 51 0.4 1.2
Lm: 17.7 101
Lm: 10.3 12 0.1 0.3
Long move: 4.0 572 Sm: 20.5 117 Sm: 18.8 22 0.2 0.5
(Lm) S: 70.9 83 0.6 2.0
S: 61.9 354
Lm: 8.2 29 0.2 0.7
572 Sm: 10.2 36 0.2 0.9
S: 81.6 289 2.0 7.0
Lm: 17.4 12 0.1 0.3
Sm: 23.2 16 0.1 0.4
S: 59.4 41 0.3 1.0
Lm: 4.7 69
Lm: 3.8 12 0.1 0.3
100% Short move: 10.1 1472 Sm: 21.5 316 Sm: 25.6 81 0.6 2.0
N=14521 (Sm) S: 70.6 223 1.5 5.4
S: 73.8 1087
Lm: 4.8 52 0.4 1.3
1472 Sm: 11.2 122 0.8 3.0
S: 84.0 913 6.3 22.1
Lm: 12.3 43 0.3 1.0
Sm: 20.6 72 0.5 1.7
S: 67.0 234 1.6 5.7
Lm: 2.8 349
Lm: 3.8 33 0.2 0.8
Stay: 85.9 12477 Sm: 6.9 862 Sm: 19.4 167 1.2 4.0
(S) S: 76.8 662 4.6 16.0
S: 90.3 11266
Lm: 2.1 241 1.7 5.8
12477 Sm: 5.6 635 4.4 15.4
S: 92.2 10390 71.6
---14521 100.0 100.0
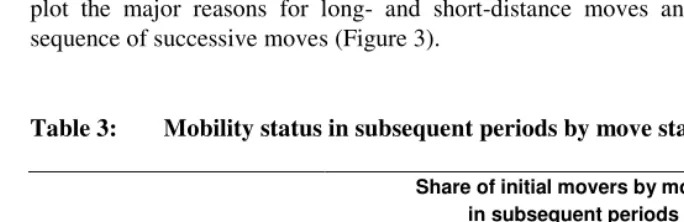
A summary table of initial long- or short-distance moves and subsequent moves derived from Figure 2 provides a test of the adjustment hypothesis and some observations on following adjustments (see Table 3). Long-distance movers are more likely to move again than short-distance movers and both have substantially higher mobility than stayers, suggesting support for the repeat-mover hypothesis. However, summarizing the figure, distance movers are more likely to make another short-distance move than a long-distance move suggesting support for the adjustment hypothesis. Short-long-distance movers are more likely to make another short-distance move than a long-distance move, reflecting housing adjustments in local labor markets. Long-distance movers who make additional moves are again more likely to make a short-distance move, reiterating the ‘settling down’ process of movement and adjustment. While short-distance movers who make subsequent moves are more likely to make further short-distance moves, we find that there is reasonably high risk of a long-distance move (see Table 3).
Our interest is not just in the rates of long- and short-distance moves and in the sequence structures but in the reasons for these moves. How do they connect to the migration/mobility dichotomy and how can we interpret the movement behavior of married couples in the context of repeat and adjustment moves. For each of three year segments we plot the major reasons for long- and short-distance moves and follow these over the sequence of successive moves (Figure 3).
Table 3: Mobility status in subsequent periods by move status in the initial period
Share of initial movers by move status in subsequent periods in %
Years 2–3 Years 3–4
Move status in the initial period (1–2 years)
Long move
Short move
All moves
Long move
Short move
All moves
Long-distance move (N=572) 17.7 20.5 38.1 10.3 18.8 29.1 Short-distance move (N=1472) 4.7 21.5 26.2 17.4 25.6 43.0
No move (N=12,477) 2.8 6.9 9.7 12.3 19.4 31.7
Figure 3: Reasons for long-distance moves and short-distance moves
Year 1 Year 2 Year 3 Year 4
Long-long-long
Long-long Percent N Reason for move
Percent N Reason for move 29.4 5 Employment
32.7 32 Employment 41.2 7 Housing
Long-distance moves 21.4 21 Housing 11.8 2 Area related
Percent N Reason for move 12.2 12 Area related 17.6 3 Unintended
34.9 192 Employment 27.6 27 Unintended 0.0 0 Others
26.5 146 Housing 6.1 6 Others 17
10.4 57 Area related 98
23.1 127 Unintended Long-long-short
5.1 28 Others Long-short Percent N Reason for move
550 Percent N Reason for move 10.0 3 Employment
18.9 21 Employment 53.3 16 Housing 49.5 55 Housing 10.0 3 Area related
9.0 10 Area related 23.3 7 Unintended
16.2 18 Unintended 3.3 1 Others
6.3 7 Others 30
100% 111
N=1945
Short-long
Percent N Reason for move Short-short-long
38.1 24 Employment Percent N Reason for move
23.8 15 Housing 25.0 3 Employment
Short-distance moves 12.7 8 Area related 41.7 5 Housing
Percent N Reason for move 23.8 15 Unintended 16.7 2 Area related
8.5 118 Employment 1.6 1 Others 16.7 2 Unintended
58.4 814 Housing 63 0.0 0 Others
5.0 70 Area related 12
23.4 327 Unintended Short-short
4.7 66 Others Percent N Reason for move Short-short-short
1395 7.0 21 Employment Percent N Reason for move
52.2 156 Housing 5.2 4 Employment
7.4 22 Area related 50.6 39 Housing 27.4 82 Unintended 7.8 6 Area related
6.0 18 Others 23.4 18 Unintended
299 13.0 10 Others
77
Source: Calculations based on PSID, 1975–92.
that are in fact clearly created by other forces than the intersection in the labor market. In other words, labor-market transitions occur when a family moves long distances, but this is not necessarily the motivation for the long-distance move.
Short-distance moves are consistent with the large body of research which privileges housing as the explanation for local adjustments, but even in this case the research shows that employment change is interrelated with moves within local labor markets (Van Ommeren et al. 1996, Clark and Davies Withers 1999). Somewhat less than 10 percent of short-distance movers identify employment as their primary reason for local changes. Unintended moves are almost as large, representing nearly a quarter of all explanations for short-distance moves.
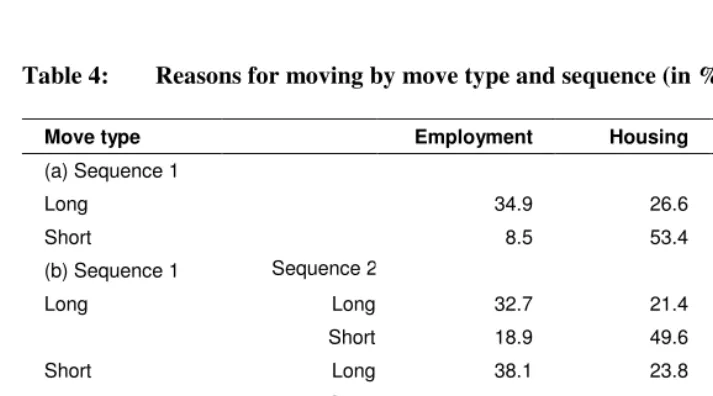
Further sequential moves confirm the complexity of the explanations for movement behavior (see Table 4). Initial distance moves that are followed by additional long-distance moves have about the same ratio of employment to housing related reasons but significantly, the proportion of unintended moves is larger than for the initial moves. Long-distance moves which are followed by short-Long-distance moves are, as expected, much more likely to be housing related. Short-distance moves followed by short-distance moves are also clearly housing related but unintended moves are still nearly a quarter of all the explanations for these moves. It is the short-distance moves with sequential long-distance moves which re-emphasize the role of employment as an explanation for these moves, but housing moves are not unimportant and unintended reasons continue to be a powerful element of the explanatory process.
Although the sample sizes are small we also explore the extended sequence of repeat long distance, repeat short distance and long and short repeat sequences followed by a change in the distance of move (see Table 4 section c). The results confirm the findings from the analysis of two sequences but with some interesting and important nuances in the findings. Overall, housing is more important than employment for repeated moves, long-distance or short-long-distance moves. Employment related reasons re-emerge as a somewhat important explanation for long-distance moves following repeated short-distance moves. Unintended reasons for moves hover between 16 and 24 percent of all reasons for relocation. What to make of all this? Clearly, repeat movers are making different kinds of adjustments than simply relocating in the classic neo-economic explanation of searching for and making adjustments for employment. Only about a quarter of all these repeat movers are concerned with employment per se. If we aggregate housing and unintended explanations it is quite apparent that couples who move repeatedly over relatively short time sequences are making some form of adjustment, planned or unplanned to bring their households into adjustments with their housing/locational needs.
changes for the unintended movers we find that many of them involve a change from own to rent, a down-market move.
In sum, we have ventured upon a continuum of moving intentions from the unintended to the predetermined and planned – all representing the complex link between family lives and migration and mobility. At a moment in time, much remains orderly and predictable with respect to the migration-employment/residential mobility-housing distinction. Yet, when placed within a dynamic context this orderly dichotomy dissipates into a complex family migration process.
Table 4: Reasons for moving by move type and sequence (in %)
Move type Employment Housing Unintended
(a) Sequence 1
Long 34.9 26.6 23.1
Short 8.5 53.4 23.1
(b) Sequence 1 Sequence 2
Long Long 32.7 21.4 27.6
Short 18.9 49.6 16.2
Short Long 38.1 23.8 23.8
Short 7.0 52.2 27.4
(c) Repeated
Long Long Long 29.4 41.2 17.7
Short Short Short 5.2 50.7 23.4
Long Long Short 10.7 53.3 23.3
Short Short Long 25.0 41.7 16.7
Source: Calculations based on PSID, 1975–92.
4.2 Models of sequential moves
4.2.1 First moves
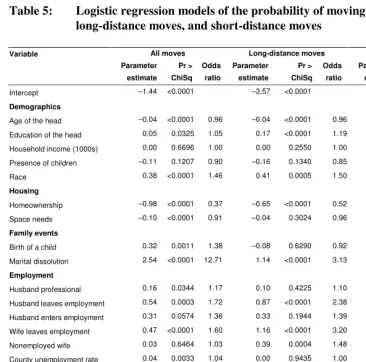
There are no surprises in the analysis of the initial sequence of moves and a number of the research findings from previous investigations are confirmed in the analysis (see Table 5). However, because we examine both long- and short-distance moves as well as moves in the aggregate we are able to emphasize some of the distinctions between long-distance and short-distance moves and to re-focus attention on some of the family related changes which are critical in our concerns for family change and migration and mobility.
The models of long-distance move (long-distance move versus no move) have negative coefficients for age and positive coefficients for education – it is younger, and generally more educated couples who move and white couples more than minority couples, a general replication of what we know already. That said, the interesting results are in the outcomes for family change and by employment and for entering and leaving the workforce. The variables family change, entering and leaving the labor force, and the birth of a child are measured for the interval of one year prior to the move. In this sense they serve as potential triggers of mobility/stability. Divorce or separation leads to long-distance migration and the husband leaving the workforce is associated with long-distance migration – naturally, we might say. It is also associated with women leaving the workforce – a classic tale of the tied mover. Most interestingly, it is also positively associated with women who are not in the workforce – the classical tale of greater mobility when there is only one labor-market attachment.
Ownership reduces the probability of moving but if the head lived in a different state than where they grew up there is a greater likelihood of a long-distance move which hints at stronger family links and associations than are measured by our other variables. It is parallel to the measure of intended mobility which is a significant predictor of migration (Lu 1998, 1999).
In sum, we find that long-distance migration is mainly intentional, people move when they say they are likely to move, it is consistent with our theory about younger and more educated movers and it is coincident with significant labor-market exits and entrances, and the role of women is reiterated with the significant measure for women not in the labor force or exiting the labor force.
Table 5: Logistic regression models of the probability of moving for all moves, long-distance moves, and short-distance moves
Variable All moves Long-distance moves Short-distance moves
Parameter Pr > Odds Parameter Pr > Odds Parameter Pr > Odds
estimate ChiSq ratio estimate ChiSq ratio estimate ChiSq ratio
Intercept –1.44 <0.0001 –3.57 <0.0001 –1.66 <0.0001
Demographics
Age of the head –0.04 <0.0001 0.96 –0.04 <0.0001 0.96 –0.03 <0.0001 0.97 Education of the head 0.05 0.0325 1.05 0.17 <0.0001 1.19 –0.02 0.5123 0.98 Household income (1000s) 0.00 0.6696 1.00 0.00 0.2550 1.00 0.00 0.9062 1.00 Presence of children –0.11 0.1207 0.90 –0.16 0.1340 0.85 –0.04 0.6073 0.96 Race 0.38 <0.0001 1.46 0.41 0.0005 1.50 0.27 0.0003 1.32
Housing
Homeownership –0.98 <0.0001 0.37 –0.65 <0.0001 0.52 –0.89 <0.0001 0.41 Space needs –0.10 <0.0001 0.91 –0.04 0.3024 0.96 –0.10 <0.0001 0.91
Family events
Birth of a child 0.32 0.0011 1.38 –0.08 0.6290 0.92 0.42 <0.0001 1.52 Marital dissolution 2.54 <0.0001 12.71 1.14 <0.0001 3.13 2.00 <0.0001 7.38
Employment
Husband professional 0.16 0.0344 1.17 0.10 0.4225 1.10 0.13 0.1144 1.14 Husband leaves employment 0.54 0.0003 1.72 0.87 <0.0001 2.38 0.04 0.7915 1.05 Husband enters employment 0.31 0.0574 1.36 0.33 0.1944 1.39 0.20 0.2435 1.22 Wife leaves employment 0.47 <0.0001 1.60 1.16 <0.0001 3.20 –0.08 0.5754 0.93 Nonemployed wife 0.03 0.6464 1.03 0.39 0.0004 1.48 –0.15 0.0497 0.86 County unemployment rate 0.04 0.0033 1.04 0.00 0.9435 1.00 0.05 0.0008 1.05
Motivations
Might move 1.63 <0.0001 5.12 1.34 <0.0001 3.82 1.48 <0.0001 4.39 Head’s geographic mobility 0.27 <0.0001 1.31 0.69 <0.0001 1.99 –0.03 0.6947 0.97 Likelihood Ratio Chi-Square 2871.65 809.58 1856.03
DF 17 17 17
Pr > Chi-Square <0.0001 <0.0001 <0.0001
Share moving in % 14.2 4.0 10.2
Source: Calculations based on PSID, 1975–92.
Nonetheless, the unemployment rate does increase the likelihood of a local move, whereas it was insignificant in predicting the likelihood of a long-distance move7.
7 Parameter estimates for the unemployment rate should be interpreted with caution as the standard errors of
The coefficients for all moves naturally combine the labor-market and housing-market effects. Family effects are significant and strong, but so too are labor-market effects and the local housing-market effects of space needs, ownership, and the local unemployment rate. That the previous locations of the head are still important is recognition of the fact that households seem to be increasingly linked to their extended family compositions, no doubt reflecting the increasing need to provide care to those extended family relationships (Rogerson et al. 1993, Rogerson 1996).
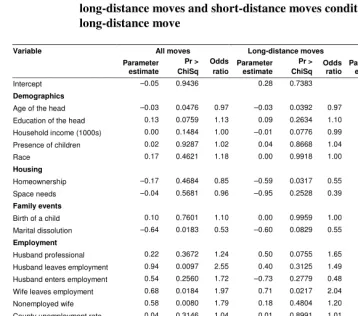
4.2.2 Conditional moves
The findings from the first-move analysis enrich our previous understanding of the move process but when we condition the outcomes of second moves on long- and short distance first moves the findings are enriched further. We provide coefficients for conditional models of long- and short-distance moves conditional on either long- or short-distance moves. In both cases the models could be much stronger and the coefficients significant at higher levels but nevertheless the results are strongly instructive of the changes which are occurring in mobility behavior. In discussing significant coefficient effects we use levels of significance of .10 or greater (see Table 6). In these models the variables family change, entering and leaving the labor force, and the birth of a child are measured for the interval of one year prior to the second move. In this sense they serve as potential triggers of repeat mobility/stability.
Table 6: Logistic regression models of the probability of moving for all moves, long-distance moves and short-distance moves conditional on a long-distance move
Variable All moves Long-distance moves Short-distance moves
Parameter estimate Pr > ChiSq Odds ratio Parameter estimate Pr > ChiSq Odds ratio Parameter estimate Pr > ChiSq Odds ratio
Intercept –0.05 0.9436 0.28 0.7383 –1.21 0.0973
Demographics
Age of the head –0.03 0.0476 0.97 –0.03 0.0392 0.97 –0.01 0.3224 0.99 Education of the head 0.13 0.0759 1.13 0.09 0.2634 1.10 0.01 0.8793 1.01 Household income (1000s) 0.00 0.1484 1.00 –0.01 0.0776 0.99 0.00 0.7376 1.00 Presence of children 0.02 0.9287 1.02 0.04 0.8668 1.04 0.00 0.9981 1.00 Race 0.17 0.4621 1.18 0.00 0.9918 1.00 0.37 0.1295 1.45
Housing
Homeownership –0.17 0.4684 0.85 –0.59 0.0317 0.55 0.16 0.5140 1.17 Space needs –0.04 0.5681 0.96 –0.95 0.2528 0.39 0.00 0.9500 1.00
Family events
Birth of a child 0.10 0.7601 1.10 0.00 0.9959 1.00 0.19 0.5561 1.21 Marital dissolution –0.64 0.0183 0.53 –0.60 0.0829 0.55 –0.58 0.0515 0.56
Employment
Husband professional 0.22 0.3672 1.24 0.50 0.0755 1.65 –0.05 0.8290 0.95 Husband leaves employment 0.94 0.0097 2.55 0.40 0.3125 1.49 0.95 0.0067 2.60 Husband enters employment 0.54 0.2560 1.72 –0.73 0.2779 0.48 0.92 0.0504 2.50 Wife leaves employment 0.68 0.0184 1.97 0.71 0.0217 2.04 0.09 0.7709 1.09 Nonemployed wife 0.58 0.0080 1.79 0.18 0.4804 1.20 0.37 0.1065 1.45 County unemployment rate 0.04 0.3146 1.04 0.01 0.8991 1.01 0.04 0.3876 1.04
Motivations
Might move –0.18 0.4305 0.83 –0.39 0.1517 0.68 0.08 0.7411 1.08 Head’s geographic mobility 0.21 0.2835 1.23 0.06 0.7723 1.07 0.29 0.1501 1.34 Likelihood Ratio Chi-Square 48.19 44.95 22.37
DF 17 17 17
Pr > Chi-Square <0.0001 0.0002 0.1709 Share moving in % 49.5 25.0 31.9
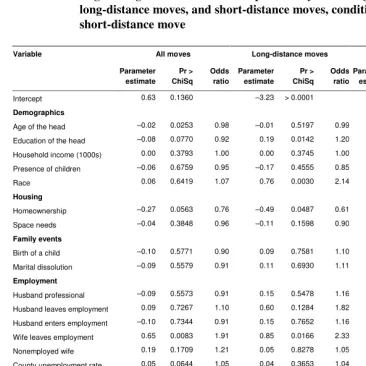
The parallel discussion is of long- and short-distance moves conditional on an initial distance move (see Table 7). The long-distance moves conditional on a short-distance move are dependent on head’s education, being white, women leaving the workforce and the previous geography of the head of household. Clearly, the geographical history of migrants is central in the behavior of these migrants who move long distances after they have relocated locally. Women behave similarly to those who move long distances initially – leaving work. The probabilities are reduced for homeownership.
Short-distance moves conditional on an earlier short-distance move are affected by head’s education – perhaps a surrogate for income although income is in the equation. However, the large odds ratio (although the parameter is not significant) for women leaving employment may be an indicator of unintended moves by the household and these moves have a de-stabilizing effect on women’s ability to be employed.
For mobility in general (all moves) age and education decrease the likelihood of moving as does homeownership. There is nothing striking here. However, women leaving employment and the intention to move signal perhaps, a planning process that is outside the decision to be in employment per se. At the same time, the unemployment rate is nearly significant at the 0.05 level suggesting that there are complicated relations between the mobility decision and the local context.
Table 7: Logistic regression models of the probability of moving for all moves, long-distance moves, and short-distance moves, conditional on a short-distance move
Variable All moves Long-distance moves Short-distance moves
Parameter estimate Pr > ChiSq Odds ratio Parameter estimate Pr > ChiSq Odds ratio Parameter estimate Pr > ChiSq Odds ratio
Intercept 0.63 0.1360 –3.23 > 0.0001 0.59 0.1870
Demographics
Age of the head –0.02 0.0253 0.98 –0.01 0.5197 0.99 –0.01 0.1131 0.99 Education of the head –0.08 0.0770 0.92 0.19 0.0142 1.20 –0.15 0.0016 0.86 Household income (1000s) 0.00 0.3793 1.00 0.00 0.3745 1.00 0.00 0.6833 1.00 Presence of children –0.06 0.6759 0.95 –0.17 0.4555 0.85 0.01 0.9703 1.01 Race 0.06 0.6419 1.07 0.76 0.0030 2.14 –0.12 0.3873 0.89
Housing
Homeownership –0.27 0.0563 0.76 –0.49 0.0487 0.61 –0.20 0.1775 0.82 Space needs –0.04 0.3848 0.96 –0.11 0.1598 0.90 –0.03 0.5435 0.97
Family events
Birth of a child –0.10 0.5771 0.90 0.09 0.7581 1.10 –0.10 0.6214 0.91 Marital dissolution –0.09 0.5579 0.91 0.11 0.6930 1.11 –0.09 0.5869 0.91
Employment
Husband professional –0.09 0.5573 0.91 0.15 0.5478 1.16 –0.26 0.1177 0.77 Husband leaves employment 0.09 0.7267 1.10 0.60 0.1284 1.82 –0.06 0.8213 0.94 Husband enters employment –0.10 0.7344 0.91 0.15 0.7652 1.16 –0.16 0.5908 0.85 Wife leaves employment 0.65 0.0083 1.91 0.85 0.0166 2.33 0.41 0.1046 1.51 Nonemployed wife 0.19 0.1709 1.21 0.05 0.8278 1.05 0.22 0.1303 1.24 County unemployment rate 0.05 0.0644 1.05 0.04 0.3653 1.04 0.04 0.1919 1.04
Motivations
Might move –0.29 0.0355 0.75 –0.30 0.1874 0.74 Head’s geographic mobility 0.10 0.4345 1.11 0.52 0.0149 1.68 Likelihood Ratio Chi-Square 53.94 43.62 62.01
DF 17 17 17
Pr > Chi-Square <0.0001 0.0004 >0.0001 Share moving in % 38.5 9.1 31.3
5. Conclusions
There is one major, innovative, and important conclusion from this study. It is that we often proceed with set notions of the nature and impacts of family change and its role on migration, but then we learn, as in this study, that much of what we may be setting within the framework of purposive employment or housing related choices and behavior is much more complex. The outcomes are created by and involve complicated interactions of family change, employment change, and housing selection. Sometimes housing adjustment is the driving force in local moves and sometimes it is important in long-distance moves and we find similar outcomes for long-distance moves. It is true that housing related moves are more important in local moves but they only account in the aggregate for half of the reasons for these relocations. For long-distance moves it is much more complex than the previous notions of solely employment driven moves. A truly new finding in the study is the important role of unintended moves. Clearly, serendipitous forces play an important role in the migration and mobility process. For nearly a quarter of all moves respondents report something other than jobs or housing adjustment as the most important factor in their mobility behavior. These findings, in particular that at least a significant proportion of short-distance moves have employment explanations, suggest that we abandon the notion of providing dichotomous explanations for short- and long-distance moves.
Thus, even though many couples are making long-distance moves to accommodate changing occupational aspirations long-distance moves can no longer be assigned unambiguously to employment driven changes. The complexity is enhanced by the role of women in the long-distance migration process, their exits and entrances to the labor force are an integral part of understanding mobility behavior. Similarly, short-distance moves are not simply generated by changes in a family’s interaction with the housing market. The reiteration that there is much less change in tenure with mobility and migration emphasizes that an economic concern with tenure change and ownership is a much less powerful explanation for relocation than is often asserted.
will allow us to capture the continuous time process of household change and residential relocation.
6. Acknowledgements
References
Bailey, A. J., and T. J. Cooke. 1998. Family migration and employment: the importance of migration history and gender, International Regional Science Review 21: 99–118.
Bailey A. J., M. K. Blake, and T. J. Cooke. 2004. Migration, care, and the linked lives of dual-earner households, Environment and Planning A 36: 1617–1632.
Baldridge, D. C., K. A. Eddleston, and J. F. Veiga. 2006. Saying ‘no’ to being uprooted: the impact of family and gender on willingness to relocate, Journal of Occupational
and Organizational Psychology 79: 131–149.
Bielby, W., and D. Bielby. 1992. I will follow him: family ties, gender-role beliefs, and reluctance to relocate for a better job, American Journal of Sociology 97: 1241–1267.
Bonney, N., and J. Love. 1991. Gender and migration: geographical mobility and the wife’s sacrifice, The Sociological Review 39: 335–348.
Boyle, P., T. J. Cooke, K. Halfacree, and D. Smith. 2001. A cross-national comparison of the impact of family migration on women’s employment status, Demography 38: 201–213.
Boyle, P., T. J. Cooke, K. Halfacree, and D. Smith. 2003. The effect of long-distance family migration and motherhood on partnered women’s labour-market activity rates in Great Britain and the USA, Environment and Planning A 35: 2097–2114.
Challiol, H., and K. Mignonac. 2005. Relocation decision-making and couple relationships: a quantitative and qualitative study of dual-earner couples, Journal of
Organizational Behavior 26: 247–274.
Clark, W. A. V., and S. Davies Withers. 1999. Changing jobs and changing houses: mobility outcomes of employment transitions, Journal of Regional Science 39: 653–673.
Clark, W. A. V., and S. Davies Withers. 2002. Disentangling the interaction of migration, mobility and labor force participation, Environment and Planning A 34: 923–945.
Clark, W. A. V., M. C. Deurloo, and F. M. Dieleman. 1984. Housing consumption and residential mobility, Annals of the Association of American Geographers 74: 29–43.
Clark, W. A. V., and F. Dieleman. 1996. Households and Housing: Choice and Outcomes
in the Housing Market. New Jersey: Rutgers University, Center for Urban Policy
Clark, W. A. V., and Y. Huang. 2003. The life course and residential mobility in British housing markets, Environment and Planning A 35: 323–339.
Clark, W. A. V., and Y. Huang. 2004. Linking migration and mobility: individual and contextual effects in housing markets in the UK, Regional Studies 38: 617–628.
Clark, W. A. V., and Y. Huang. 2006. Balancing move and work: women’s labour market exits and entries after family migration, Population, Space and Place 12: 31–44.
Cooke, T. J., and A. J. Bailey. 1996. Family migration and the employment of married women and men, Economic Geography 72: 38–48.
Cooke, T. J. 2001. ‘Trailing wife’ or ‛trailing mother’? The effect of parental status on the relationship between family migration and the labor-market participation of married women, Environment and Planning A 33: 419–430.
Cooke, T. J. 2003. Family migration and the relative earnings of husbands and wives,
Annals of the Association of American Geographers 93: 338–349.
Courgeau, D. 1985. Interaction between spatial mobility, family and career life-cycle: a French survey, European Sociological Review 1(2): 139–162.
DaVanzo, J. 1976. Why Families Move: A Model of the Geographic Mobility of Married
Couples.Working Paper. Santa Monica: RAND Corporation.
Davies Withers, S. 1998. Linking household transitions and housing transitions: a longitudinal analysis of renters, Environment and Planning A 30: 615–630.
Davies Withers, S., and W. A. V. Clark. 2006. Housing costs and the geography of returns to family migration, Population, Space and Place 12: 273–289.
De Jong, G. F., and R. W. Gardner. 1981. Migration Decision-making: Multidisciplinary
Approaches to Microlevel Studies in Developed and Developing Countries. New
York: Pergamon Press.
Deurloo, M. C., W. A. V. Clark, and F. Dieleman. 1994. The move to housing ownership in temporal and regional contexts, Environment and Planning A 26: 1659–1670.
Dieleman, F., and R. Schouw. 1989. Divorce, mobility and housing demand, European
Journal of Population 5: 235–252.
Durlauf, S. 2004. Neighborhood effects, in J. V. Henderson and J. F. Thisse (Eds.),
Handbook of Regional and Urban Economics, Volume 4. North Holland,
Amsterdam: Elsevier, pp. 2119–2171.
Fielding, A., and S. Halford. 1993. Geographies of opportunity: a regional analysis of gender-specific social and spatial mobilities in England and Wales, 1971–1981,
Environment and Planning A 25: 1421–1440.
Friedrichs, J., G. Galster, and S. Musterd. 2003. Neighborhood effects on social opportunities: the European and American research and policy context, Housing
Studies 18: 797–806.
Goodman, J. L. 1982. Linking local mobility rates to migration rates: repeat movers and place effects, in W. A. V. Clark (Ed.), Modelling Housing Market Search. London: Croom Helm, pp. 209–223.
Green, A. E. 1997. A question of compromise? Case study evidence on the location and mobility strategies of dual career households, Regional Studies 31: 643–659.
Green, A. E. 2004. Is relocation redundant? Observations on the changing nature and impacts of employment-related geographical mobility in the UK, Regional Studies
38(6): 629–641.
Green, A. E., and A. Canny. 2003. Geographical Mobility: Family Impacts. Bristol: The Policy Press.
Green, A. E., T. Hogarth, and R. E. Shackleton. 1999. Longer distance commuting as a substitute for migration in Britain: a review of trends, issues and implications,
International Journal of Population Geography 5(1): 49–67.
Halfacree, K. H. 1995. Household migration and the structuration of patriarchy: evidence from the USA, Progress in Human Geography 19: 159–182.
Haveman, R., and B. Wolfe. 1994. Succeeding Generations: On the Effects of Investments
in Children. New York: Russell Sage Foundation.
Jacobsen, J. P., and L. M. Levin. 1997. Marriage and migration: comparing gains and losses from migration for couples and singles, Social Science Quarterly 78: 688–709.
Jarvis, H. 1999. Identifying the relative mobility prospects of a variety of household employment structures, 1981–1991, Environment and Planning A 31: 1031–1046.
Kimmel J., and E. P. Hoffman. 2002. (Eds.) The Economics of Work and Family. Kalamazoo: W. E. Upjohn Institute for Employment Research.
LeClere, F. B., and D. K. McLaughlin. 1997. Family migration and changes in women’s earnings: a decomposition analysis, Population Research and Policy Review 16: 315–35.
Lichter, D. 1980. Household migration and labour market position of married women,
Social Science Research 9: 83–97.
Linneman, P., and P. E. Graves. 1983. Migration and job change: a multinomial approach,
Journal of Urban Economics 14: 263–279.
Lu, M. 1998. Analyzing migration decisionmaking: relationships between residential satisfaction, mobility intentions, and moving behavior, Environment and Planning A 30: 1473–1495.
Lu, M. 1999. Do people move when they say they will? Inconsistencies in individual migration behavior, Population and Environment 20: 467–488.
Marr, W. L., and F. W. Millerd. 1988. Migration and the employment status of married women, Canadian Journal of Regional Science 11: 119–132.
Maxwell, N. 1988. Economic returns to migration: marital status and gender differences,
Social Science Quarterly 69: 108–121.
Mincer, J. 1978. Family migration decisions, Journal of Political Economy 286: 749–773.
Morrison, D. R, and D. T. Lichter. 1988. Family migration and female employment: the pattern of underemployment among migrant married women, Journal of Marriage
and the Family 50: 101–172.
Mulder, C. H. 1993. Migration Dynamics: A Life Course Approach. Amsterdam: Thesis Publishers.
Mulder, C. H., and M. Wagner. 1993. Migration and marriage in the life course: a method for studying synchronized events, European Journal of Population 9(1): 55–76.
Nivalainen, S. 2004. Determinants of family migration: short moves vs. long moves,
Odland, J., and M. Shumway. 1993. Interdependencies in the timing of migration and mobility events, Journal of the Regional Science Association 72: 221–237.
Plane, D. A., C. J. Henrie, and M. J. Perry. 2005. Spatial demography special feature: migration up and down the urban hierarchy and across the life course, Proceedings
of the National Academy of Sciences 102: 15313–15318.
Panel Study of Income Dynamics, 2006. Website link for codebook www.isr.umich.edu/src/psid/tablcont.html.
Raley, S. B., M. J. Mattingly, and S. M. Bianchi. 2006. How dual are dual-income couples? Documenting change from 1970 to 2001, Journal of Marriage and the
Family 68: 11–28.
Rindfuss, R. R., C. G. Swicegood, and R. A. Rosenfeld. 1987. Disorder in the life course: how common and does it matter?, American Sociological Review 52(6): 785–801.
Rives, J. M., and J. M. West. 1992. Worker relocation costs: the role of wife’s labour market behavior, Regional Science Perspectives 22: 3–12.
Rives, J. M., and J. M. West. 1993. Wife’s employment and worker relocation behavior,
Journal of Socio-Economics 22(1): 13–22.
Rogerson, P. A. 1996. Geographic perspectives on elderly population growth, Growth and
Change 27: 75–95.
Rogerson, P. A., R. H. Weng, and G. Lin. 1993. The spatial separation of parents and their adult children, Annals of the Association of American Geographers 83(4): 656–671.
Roseman, C. C. 1971. Migration as a spatial and temporal process, Annals of the
Association of American Geographers 63: 589–598.
Sandell, S. 1977. Women and the economics of family migration, Review of Economics
and Statistics 59: 406–414.
Shields, M. P., and G. M. Shields. 1993. A theoretical and empirical analysis of family migration and household production: U.S. 1980–1985, Southern Economic Journal
59: 768–82.
Shihadeh, E. 1991. The prevalence of husband-centered migration: employment consequences for married mothers, Journal of Marriage and the Family 53: 432–444.
Silow, M. L. 2006. Selling a home due to ‘unforeseen circumstances’. New Jersey Law
Spitze, G. 1984. The effect of family migration on wives employment: how long does it last?, Social Science Quarterly 65: 21–36.
Smith, D. P. 2004. An ‘untied’ research agenda for family migration: loosening the ‘shackles’ of the past, Journal of Ethnic and Migration Studies 30: 263–282.
Smits, J. 1999. Family migration and the labour-force participation of married women in the Netherlands, 1977–1996, International Journal of Population Geography
5: 133–150.
Smits, J., C. H. Mulder, and P. Hooimeijer. 2003. Changing gender roles, shifting power balance, and long-distance migration of couples, Urban Studies 40: 603–630.
State of Our Unions. 2005. The Social Health of Marriage in America, The National
Marriage Project. Rutgers: The State University.
United States Census Bureau. 2006a. Current Population Reports. Geographic Mobility:
2002 to 20.Washington: United States Census Bureau, pp. 20–549.
United States Census Bureau. 2006b. Current Population Reports. Domestic Net Migration
in the United States: 2000 to 2004. Washington: United States Census Bureeau, pp.
25–1135.
Van Ommeren, J. N., P. Rietveld, and P. Nijkamp. 1996. Residence and workplace relocation: a bivariate duration model approach, Geographical Analysis 38: 315–329.
Zvonkovic, A. M., K. M. Greaves, C. J. Schmiege, and L. D. Hall. 1996. The marital construction of gender through work and family decisions: a qualitative analysis,
Appendix 1
Codes for variable ‘Why moved?’ in the Panel Study of Income Dynamics
Why did you (head) move?a
Code Description
1 Purposive productive reasons: to take another job; transfer; stopped going to school. 2 To get nearer to work.
3 Purposive consumptive reasons: expansion of housing; more space; more rent; better place.
4 Purposive consumptive reasons: contraction of housing; less space; less rent. 5 Purposive consumptive: other house-related; want to own home; got married. 6 Purposive consumptive: neighborhood-related; better neighborhood; go to school; to be closer to friends and/or relatives.
7 Response to outside events (involuntary reasons): housing unit coming down; being evicted; armed services; health reasons; divorce; retiring due to health.
8 Ambiguous or mixed reasons: to save money; all my old neighbors moved away; retiring.
9 Not available; don’t know. 0 Inappropriate: has not moved.