TEXTILE TECHNOLOGY
Processing Sticky Cotton: Implication of Trehalulose in Residue Build-up
Eric Hequet* and Noureddine Abidi
INTERPRETIVE SUMMARY
In spinning mills, sticky cotton can cause serious problems. It contaminates the textile equipment: opening line, card, drawing, roving, and spinning frames. These contaminants are mainly sugar deposits produced either by the cotton plant itself (physiological sugars) or by feeding insects (entomological sugars), the latter being the most common source of stickiness.
Seventeen mixes having a moderate level of stickiness were evaluated in both ring and rotor spinning. High-performance liquid chromatography tests were performed on residues collected from the textile machinery to identify the types of sugars present. It was shown that among the sugars identified on raw fiber, only trehalulose exhibits higher percentages in the residues than on the fiber.
During the fibers-to-yarn transformation, the flow of lint is submitted to different friction forces; consequently, the temperature of some mechanical elements may increase significantly and affect the thermal properties of the contaminated lint. After a sugar becomes sticky, the other sugars present on the lint, as well as other substances such as dusts, silica, etc., will stick to the lint and could cause unevenness in the flow of lint being drawn, such as lapping up on the rolls, nep-like structures, and ends-down. Therefore, the thermal properties of the five sugars identified on the contaminated fiber and on the residues collected on the textile equipment were investigated. Among the sugars tested, trehalulose is the only one having a low melting point, around 48(C. In addition, trehalulose is highly hygroscopic. After passive conditioning of dehydrated trehalulose at 65% ± 2% relative humidity and 21(C ± 1(C for 24 h, the quantity of adsorbed water at equilibrium
was found to be approximately 17.5%. This corresponds to three molecules of water adsorbed for each molecule of trehalulose. The combination of low melting point and high hygroscopicity could be the cause of the selective accumulation of this sugar on the textile equipment.
ABSTRACT
Cottons (Gossypium hirsutum L.) contaminated with stickiness can cause multiple problems in the textile mills. Contaminants originate from physiological sugars coming from the plant itself and/or entomological sugars coming from phloem-feeding insects, specifically the cotton aphid [Aphis gossypii (Glover)] and cotton whitefly [Bemisia tabaci (Gennadius)]. During yarn manufacturing, all textile equipment is contaminated with sugar deposits to different degrees, affecting both productivity and yarn quality. We evaluated 17 mixes of moderate stickiness in both ring and rotor spinning. To identify the types of sugars in the sticky deposits collected from the textile machinery, we assayed with high-performance liquid chromatography. Trehalulose (C12H22O11) was the dominant sugar in these deposits. It has the lowest melting point, 111148((((C, of the sugars involved in cotton stickiness. Dehydrated trehalulose is highly hygroscopic and absorbs 111117.5% of water at 65% ± 2% relative humidity and 21((((C ± 1((((C. The combination of a low melting point and high hygroscopicity leads to higher concentrations of trehalulose in the residues than on the original fibers.
C
otton stickiness caused by excess sugars on the lint, either from the plant itself or from insects, is a very serious problem for the textile industry-for cotton growers, cotton ginners, and spinners (Hequet et al., 2000; Watson, 2000). Depending on the processes involved (opening, carding, drawing, roving, and spinning) and the location within the machines, the process of transforming sticky cottons from fiber to yarn contaminates machinery to different degrees affecting processing efficiency as well as the quality of products obtained.Stickiness is primarily due to sugar deposits produced either by the cotton plant itself (physiological sugars) or by feeding insects (entomological sugars) (Hendrix et al., 1995). Insects have been documented as the most common source of contamination in some studies (Sisman and Schenek, 1984). The analysis of honeydew from the cotton aphid [Aphis gossypii (Glover)] and cotton whitefly {Bemisia argentifolii Bellows and Perring [= B. tabaci (Gennadius) strain B]} has shown that aphid honeydew contains 138.3% melezitose (C18H32O16) plus 1.1% trehalulose (C12H22O11), whereas whitefly honeydew contains 43.8% trehalulose plus 16.8% melezitose under the conditions described by Hendrix et al. (1992). Other relative percentages may occur, depending on the environmental or feeding conditions. Furthermore, Miller et al. (1994) demonstrated that stickiness is related to the type of sugars present on the lint. The authors showed that trehalulose and sucrose (C12H22O11), both disaccharides, were the stickiest sugars when added to clean cotton, while melezitose (trisaccharide), glucose (C6H12O6), and fructose (C6H12O6) (both monosaccharides) were relatively non-sticky.
Previous investigations were conducted to elucidate the factors affecting the behavior of cotton contaminated with stickiness. In textile mills, the method mainly used to reduce the impact of stickiness is blending sticky cotton with non-sticky cotton (Perkins, 1984; Hequet et al., 2000).
Gutknecht et al. (1986) reported that stickiness caused by honeydew depends on the relative humidity, which is a function of both water content and air temperature, in which the contaminated cotton is processed. Frydrych et al. (1993) reported that stickiness measured with the thermodetector is dependent on the relative humidity. Price (1988) noticed that sticky cotton (with 1.2% reducing sugar content), when stored in high relative humidity (70(F, 80% relative humidity), caused more problems during processing than the same sticky cotton stored at low relative humidity (75(F, 55% relative humidity). However, at low relative humidity, the fibers are more rigid and will increase the friction forces creating static electricity (Morton and Hearle, 1993). Therefore, it will require more energy to draw the lint.
Stickiness has been reported to cause a build-up of residues on textile machinery, which may result in irregularities or excessive yarn breakage (Hector and Hodkinson, 1989). When processing low to moderately contaminated cotton blends, residues will slowly build up, decreasing productivity and quality, and forcing the spinner to increase the cleaning schedule. Consequently, we decided to study the origin of the residues collected on the textile equipment after processing sticky cotton blends with low to moderate levels of contamination.
MATERIALS AND METHODS
Materials
We selected 12 commercial bales contaminated with insect honeydew on the basis of their insect sugar (trehalulose and melezitose) content and their stickiness as measured with the high-speed stickiness detector (CIRAD, Montpellier, France). In addition, five non-sticky bales from one module were purchased for mixing with the contaminated cotton, so that alternative stickiness levels in the mixes could be obtained. The 12 contaminated bales were broken and layered. Ten samples per bale were taken. Each sample was tested with a high-volume instrument (Model 900 Automatic, Zellweger Uster, Knoxville, TN) and high-performance liquid chromatography (Dionex Corporation, Sunnyvale, CA).
High-Volume Instrument
Each fiber sample was tested on a Zellweger Uster High-Volume Instrument Model 900 Automatic. Four replications were performed for micronaire and color and 10 replications for length and strength.
High-Performance Liquid Chromatography on Fiber Samples
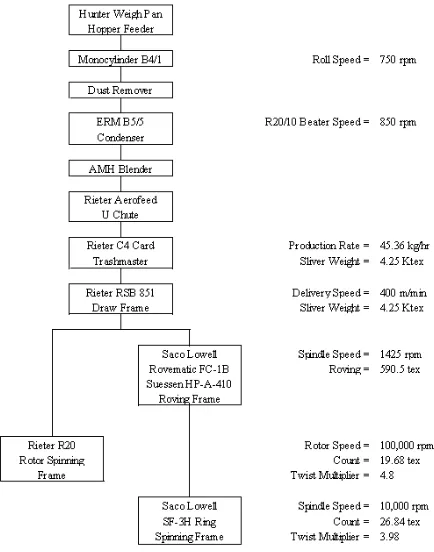
Fig. 1. Outline of the mechanical process for the spinning trials.
polypropylene housing) (National Scientific, Scottsdale, AZ) was attached. A 1.5-mL filtered sample was deposited into a 1.5-mL autosampler vial (C4013-15A, National Scientific). Sugars were separated on the columns (CarboPac PA1 anion-exchange guard column [Dionex Corporation, Sunnyvale, CA] and two CarboPac PA1 anion-exchange analytical columns [Dionex Corporation]) in series with a gradient eluent system. Eluent 1 was 200 mM NaOH and Eluent 2 was 500 mM sodium acetate (C3H3NaO2·3H2O) and 200 mM NaOH. Three replications were performed on each sample (10 samples per bale × three replications = 30 tests per bale). The results were expressed in percentage of the fiber weight.
High-Speed Stickiness Detector
The high-speed stickiness detector is derived from the sticky cotton thermodetector (CIRAD, Montpellier, France), which was approved as a reference test by the International Textile Manufacturers Federation in 1994 (Frydrych and Hequet, 1998). This thermomechanical method combines the effect of heat and pressure applied to a sample of cotton placed between two pieces of aluminum foil. When the temperature increases, moisture in the cotton vaporizes and is absorbed by the sticky spots, making them stick to the foil. The high-speed stickiness detector is an automated version of the sticky cotton thermodetector (Frydrych et al., 1994). Three replications were performed on each sample (10 samples per bale x three replications = 30 readings per bale).
Spinning Trials
The mechanical process used in this study is described in Fig. 1. Opening, carding, drawing, roving, ring spinning, and rotor spinning machines used were all industrial equipment. In the ring spinning trial, the yarns were spun to a 19.68 x 10⁻⁶ kg m-1 (19.68-tex or 30 English number) count. Fourteen spindles were used for each mix spun, and each mix was run for 72 h. For the open-end spinning trials, the yarn produced was 26.84 x 10⁻⁶ kg m-1 (26.84-tex or 22 English number); 10 positions were used, and each mix was run for 20 h.
We ran preliminary tests on ring spinning before testing the mixes. A 13.6 kg sample of lint from each bale was carded and drawn. If noticeable problems occurred at the draw frame, the process was stopped. If not, the drawing slivers were transformed into roving. If noticeable problems occurred at the roving frame, the process was stopped. If not, the roving was transformed into yarn at the ring spinning frame. If noticeable problems occurred at the ring spinning frame, the process was stopped. If not, 45.4 kg of lint was processed for the large-scale test. If noticeable problems occurred at any step of the process, the cotton was mixed with 50% non-sticky cotton and the process was repeated. This procedure was used for 17 large-scale tests. Four bales were spun without mixing the lint with the non-sticky cotton. Four bales were spun after mixing the lint with 50% non-sticky cotton. Four bales were spun after mixing the lint with 75% non-sticky cotton. Three bales were spun after mixing the lint with 87.5% non-sticky cotton. Finally, two bales were spun after mixing the lint with 93.75% non-sticky cotton.
on the rotor spinning and ring spinning frames were a n a l yzed by hi gh-p e r f o r ma n c e l i q u i d chromatography. These tests quantify the amount of sugars, expressed as a percentage of total sugars present. In addition, high-speed stickiness detector measurements were made on card slivers.
After each spinning test was completed, the opening line and the card were purged by processing a non-contaminated cotton, then all the equipment was washed with wet fabric and thoroughly dried.
High-Performance Liquid Chromatography on Sticky Deposits
Residues on textile equipment were collected using wet wipes (Kimwipes EX-L [wetted with distilled water], Kimberly-Clark, Roswell, GA). Each wipe was identified, placed into a plastic bag, and frozen. After the spinning trials, sugars were extracted from the wipes using 20 mL of 18.2-megohm water. High-performance liquid chromatography tests were performed following the same procedure used for the bale samples. Three replications were performed on each sample. The results for each sugar were expressed as a percentage of total sugars identified.
Dust Test
Dust was collected from 20 rotors after a 4-h run. The spinning equipment for this test was an Elitex BD200M (Elitex, Usti and Orlici, Czech Republic) because it has no auto-cleaning devices to remove dust. Collected dust was frozen. We extracted the sugars from the dust using 20 mL of 18.2-megohm water. High-performance liquid chromatography tests were performed following the same procedure used for the bale samples. Three replications were performed on each sample. The results for each sugar were expressed as a percentage of total sugars identified.
Water Adsorption
The selected sugars were fructose, glucose, sucrose, trehalulose, and melezitose. Trehalulose was obtained from Cornell University; the other sugars were from Sigma Chemical Company (St. Louis, MO). The sugars first were dehydrated at room
temperature under vacuum for 48 h. They were weighed immediately in tightly closed weighing containers in a controlled atmosphere (65% ± 2% relative humidity, 21(C ± 1(C). Recorded weight, m0 (dry weight), at time, t0 = 0, was used for calculation of weight-gain. Since the stickiness tests were done at 65% ± 2% relative humidity and 21(C ± 1(C, the open containers containing sugar samples were stored at these conditions and weighed (weight mt) over time until the weight stabilized (14 wk). The percentage of adsorbed water on each sugar was then calculated as [(mt - m0)/m0] x 100 and plotted against time.
Differential Scanning Calorimetry
The differential scanning calorimetry (Dupont 2000 Thermal Analysis, Wilmington, DE) technique is widely used to examine and characterize substances. The principle of this method is based on measuring the heat flux between the sample and a reference while the temperature is rising. The sample and the reference are deposited into two different pans and heated at the same rate. In this work, the reference was an empty pan. The analysis of the differential scanning calorimetry profiles indicates the thermal properties of the substances being tested; specific values such as melting point and decomposition point are obtained. The differential scanning calorimetry profiles were recorded by heating at the rate of 5(C min-1 between 25(C and 250(C.
Scanning Electron Microscope
Following the processing of the 17 mixes, yarn neps were identified and collected. The samples were mounted in the stub and coated with a layer of gold by means of thermal evaporation in a vacuum-coating unit. They were then examined in the scanning electron microscope (Model S500, Hitachi, Tokyo, Japan) using an accelerating voltage of 20 KV.
RESULTS AND DISCUSSION
and polymerization of sucrose; neither of these sugars occurs in the cotton plant (Hendrix, 1999). Therefore, their presence on cotton lint demonstrates honeydew contamination.
Stickiness can cause a build-up of residues on the textile machinery, which may result in irregularities or excessive yarn breakage. When cotton is very sticky, it cannot be processed through the card; however, with low to moderate stickiness levels, yarn can generally be produced. For this reason we decided to work with mixes having a very moderate level of stickiness so that residue would build-up slowly on the textile equipment. Performing the spinning test this way is more representative of industrial practice. Indeed, a spinner will not run a very, or even moderately, sticky blend. Rather, the spinner will mix the sticky cotton in such a way that no short-term effect will be noticed. Nevertheless, residues will build up over time and translate into a slow decrease in productivity and quality, forcing the spinner to increase the cleaning schedule.
In this article, we present only the results of the study on the composition of residues found on the textile equipment after processing of sticky cotton blends. The productivity and yarn quality analysis will be presented in a future article.
With trehalulose content ranging from 0.003% to 0.188% and melezitose content ranging from
0.025% to 0.227% (Table 1), the 12 commercial bales selected were all contaminated with insect honeydew to some degree. This was confirmed by the high-speed stickiness detector readings ranging from 1.9 to 69.9 sticky points. The fiber properties of the 12 contaminated bales and of the non-sticky control are presented in Table 2. The range of fiber properties is fairly typical for upland cottons.
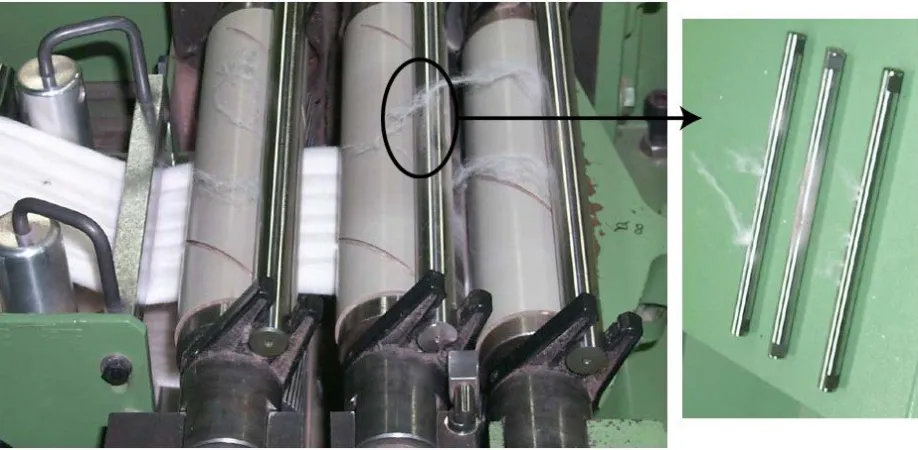
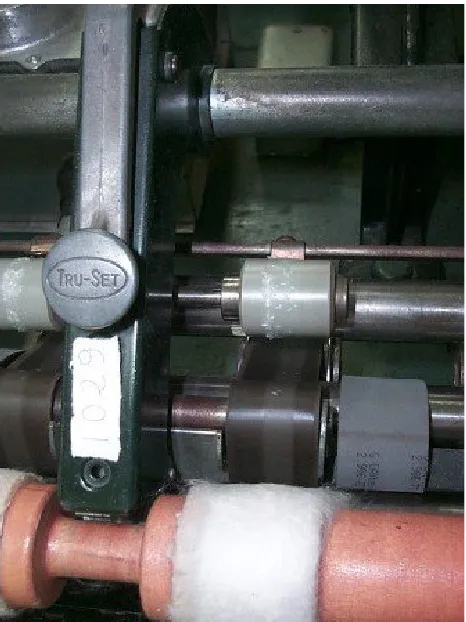
From the 12 contaminated and the five non-sticky bales, 17 mixes were evaluated. The spinning trials were performed using the protocol outlined in Fig. 1. The high-performance liquid chromatography and high-speed stickiness detector results obtained on the card slivers are presented in Table 3. Testing was performed on card slivers because of the intimate blend between the two bales composing the mix at this stage. As expected, sugar contents and high-speed stickiness detector readings on the mixes indicated slight to moderate stickiness. During the processing of the 17 mixes, sticky deposits were noticed on the textile equipment, as shown in Figs. 2 to 4.
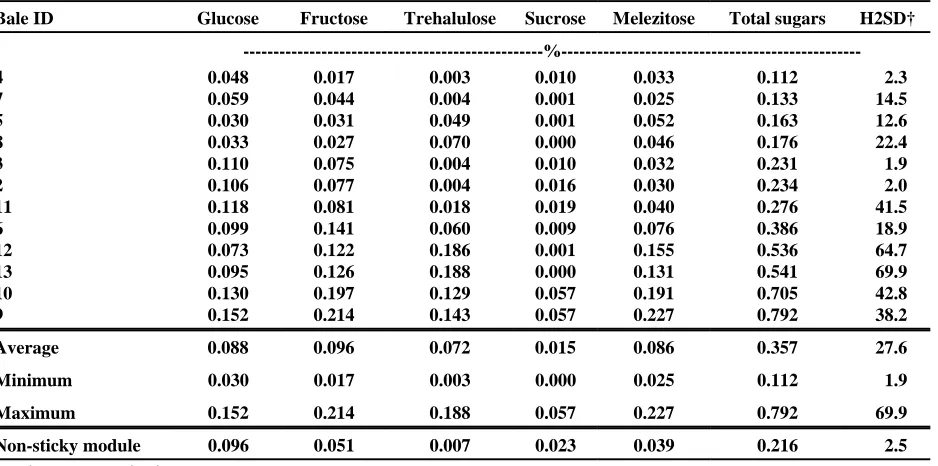
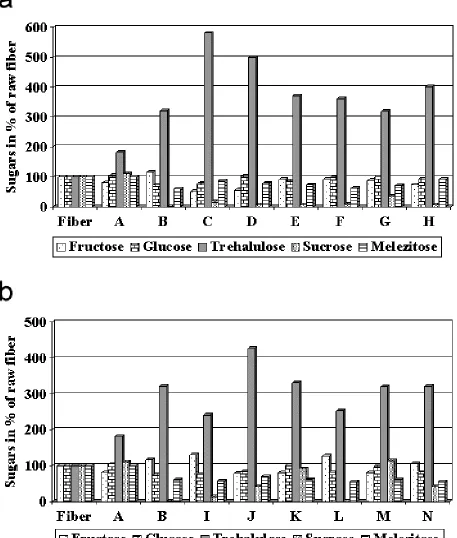
Figure 5a shows average high-performance liquid chromatography results obtained on the 17 mixes for the fiber, the flat waste, and the residues collected on the draw frame and the drawing zone of the ring spinning frame. In this figure, the high-performance liquid chromatography results are Table 1. High-performance liquid chromatography and high-speed stickiness detector results on 12 contaminated bales and 1 non-contaminated module. High-performance liquid chromatography results are expressed as a percentage of the fiber weight.
Bale ID Glucose Fructose Trehalulose Sucrose Melezitose Total sugars H2SD†
---%---4 0.048 0.017 0.003 0.010 0.033 0.112 2.3
7 0.059 0.044 0.004 0.001 0.025 0.133 14.5
5 0.030 0.031 0.049 0.001 0.052 0.163 12.6
8 0.033 0.027 0.070 0.000 0.046 0.176 22.4
3 0.110 0.075 0.004 0.010 0.032 0.231 1.9
2 0.106 0.077 0.004 0.016 0.030 0.234 2.0
11 0.118 0.081 0.018 0.019 0.040 0.276 41.5
6 0.099 0.141 0.060 0.009 0.076 0.386 18.9
12 0.073 0.122 0.186 0.001 0.155 0.536 64.7
13 0.095 0.126 0.188 0.000 0.131 0.541 69.9
10 0.130 0.197 0.129 0.057 0.191 0.705 42.8
9 0.152 0.214 0.143 0.057 0.227 0.792 38.2
Average 0.088 0.096 0.072 0.015 0.086 0.357 27.6
Minimum 0.030 0.017 0.003 0.000 0.025 0.112 1.9
Maximum 0.152 0.214 0.188 0.057 0.227 0.792 69.9
Non-sticky module 0.096 0.051 0.007 0.023 0.039 0.216 2.5
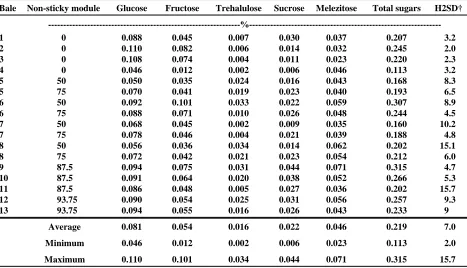
Table 3. High-performance liquid chromatography and high-speed stickiness detector results on the card slivers of 17 cotton mixes. High-performance liquid chromatography results are expressed as a percentage of the fiber weight.
Bale Non-sticky module Glucose Fructose Trehalulose Sucrose Melezitose Total sugars H2SD†
---%---1 0 0.088 0.045 0.007 0.030 0.037 0.207 3.2
2 0 0.110 0.082 0.006 0.014 0.032 0.245 2.0
3 0 0.108 0.074 0.004 0.011 0.023 0.220 2.3
4 0 0.046 0.012 0.002 0.006 0.046 0.113 3.2
5 50 0.050 0.035 0.024 0.016 0.043 0.168 8.3
5 75 0.070 0.041 0.019 0.023 0.040 0.193 6.5
6 50 0.092 0.101 0.033 0.022 0.059 0.307 8.9
6 75 0.088 0.071 0.010 0.026 0.048 0.244 4.5
7 50 0.068 0.045 0.002 0.009 0.035 0.160 10.2
7 75 0.078 0.046 0.004 0.021 0.039 0.188 4.8
8 50 0.056 0.036 0.034 0.014 0.062 0.202 15.1
8 75 0.072 0.042 0.021 0.023 0.054 0.212 6.0
9 87.5 0.094 0.075 0.031 0.044 0.071 0.315 4.7
10 87.5 0.091 0.064 0.020 0.038 0.052 0.266 5.3
11 87.5 0.086 0.048 0.005 0.027 0.036 0.202 15.7
12 93.75 0.090 0.054 0.025 0.031 0.056 0.257 9.3
13 93.75 0.094 0.055 0.016 0.026 0.043 0.233 9
Average 0.081 0.054 0.016 0.022 0.046 0.219 7.0
Minimum 0.046 0.012 0.002 0.006 0.023 0.113 2.0
Maximum 0.110 0.101 0.034 0.044 0.071 0.315 15.7
† High-speed stickiness detector.
Table 2. High-volume instrument results on 12 contaminated bales and 1 non-contaminated module.
Bale ID UHML† UI‡ Strength Micronaire Reflectance Yellowness
inch % g tex-1
%
4 1.15 84.3 30.5 4.88 77.5 10.2
7 1.05 82.0 27.4 4.39 72.4 8.7
5 1.06 81.9 24.8 5.35 72.6 9.7
8 1.08 80.6 25.6 5.49 70.1 8.3
3 1.16 82.7 30.3 4.63 76.9 10.5
2 1.13 82.9 30.8 4.51 75.5 10.7
11 1.11 81.3 30.2 4.44 77.1 10.0
6 1.14 82.8 32.5 4.18 77.1 10.4
12 1.07 79.9 25.1 5.30 70.8 8.6
13 1.06 80.0 25.4 5.39 69.1 8.5
10 1.14 83.1 30.0 4.55 77.1 10.5
9 1.12 83.6 30.7 4.61 76.9 10.7
Average 1.11 82.1 28.6 4.81 74.4 9.7
Minimum 1.05 79.9 24.8 4.18 69.1 8.3
Maximum 1.16 84.3 32.5 5.49 77.5 10.7
Non-sticky module 1.09 81.7 28.7 4.88 75.9 10.6
Fig. 3. Sticky deposits on the drafting section of the draw frame. Fig. 2. Sticky deposits on the draw frame creel drive rolls.
normalized, the base being the high-performance liquid chromatography results on the fiber. It shows that trehalulose content is always higher in the
Fig. 4. Sticky deposits on the ring spinning frame.
sugars identified in contaminated cotton, only trehalulose exhibits higher concentration in the residues.
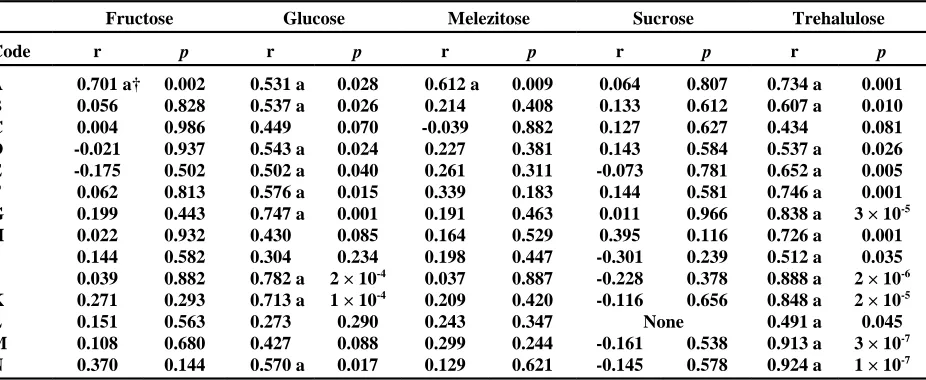
Coefficients of correlation between the logarithms of the percentage of each individual sugar, expressed as a percentage of total sugars identified on the fiber, and the percentage of each individual sugar, expressed as a percentage of the total sugars on the flat strips and residues collected, are shown in Table 4. The logarithm transformation was chosen because of the clear nonlinear relationship between the variables.
The percentage of each individual sugar identified, expressed as a percentage of the total sugars, is calculated as follows:
% Individual Sugar =
[Individual Sugar/
*
(Fructose + Glucose +
Melezitose + Sucrose + Trehalulose)] x 100
The correlations between fiber and flat strips are significant for all sugars except sucrose, showing that the individual sugar contents in the flat strips increase when the sugar content on the fibers
increases. Trehalulose is the only sugar having a higher percentage in the flat strips than in the fibers, as shown in Fig. 5a.
For the residues collected, only glucose and trehalulose have significant correlations with fiber. Nevertheless, Figs. 5a and b show that the percentages of glucose in the residues are equal or lower than the percentages of glucose on the fiber, while there is a marked increase in trehalulose content on the residues when compared with fiber. Figures 6a to e show the nonlinear relationship between trehalulose on the fibers and trehalulose on the residues for some selected locations on the textile equipment. This figure shows that during the processing of mixes having trehalulose content above 5% of the total sugars, trehalulose content has a clear tendency to increase in the residues collected. Consequently, we decided to investigate the sugars’ properties to understand why trehalulose content increases in the residues collected while the others sugars do not.
spinning, and rotor spinning frames were recorded after machine warming in a controlled environment (Table 5). The temperature readings were all above 25(C. The highest temperature range was recorded on the drawing frame (from 38(C to 53(C) and the rotor spinning frame (from 31(C to 38(C). The lowest temperature was recorded on the ring spinning frame (from 25(C to 28(C). The effects of these temperatures should vary according to the thermal properties of the sugars. Therefore, we decided to investigate the thermal properties of the five sugars identified on the contaminated fiber and on the residues collected on the textile equipment.
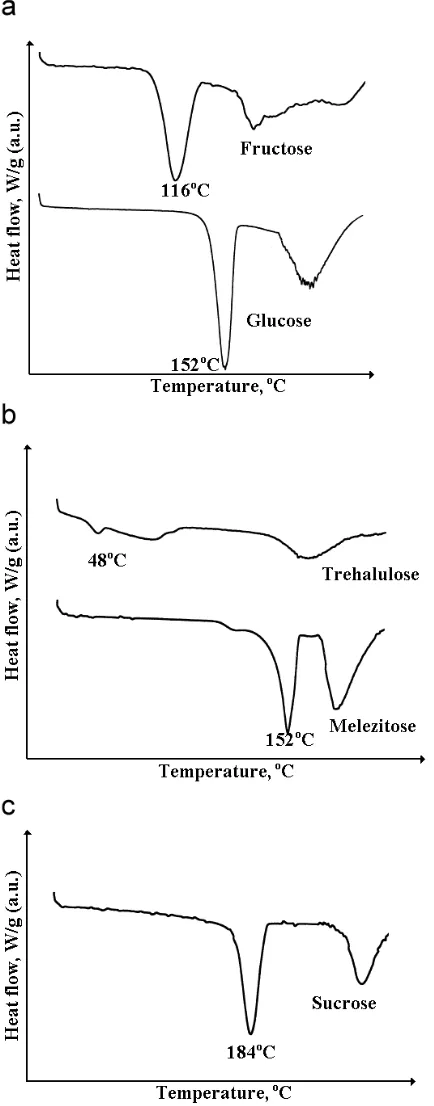
Differential scanning calorimetry was chosen to study the thermal properties of the following sugars: fructose, glucose, trehalulose, sucrose, and melezitose. The differential scanning calorimetry profiles were recorded between 25(C and 250(C with a heat rate of 5(C min-1. Figures 7a through c show the differential scanning calorimetry profiles. Each sugar has two characteristic peaks corresponding to melting points and decomposition (or carbonization) points (Table 6). The melting points obtained were similar to those given in the Merck Index (Budavari, 1989), except for trehalulose, which is completely absent from the Table 5. Temperature measurements on processing
equipment after machine warming.
Equipment, conditions Part Temperature
Card ((((C
23((((C, Licker-in 29
60% relative humidity Main cylinder 34
Flats 30
Doffer 27
Drawing
23((((C, Back roll 38
55% relative humidity Middle roll 42
Front roll 53
Calendar roll 41
Roving
23((((C, Back roll 26
55% relative humidity Middle roll 28
Front roll 31
Trumpet 28
Ring spinning
23((((C, Back roll 25
62% relative humidity Middle apron 26
Front roll 28
Ring 27
Rotor spinning
23((((C, Combing roll 31
55% relative humidity Rotor 37
Table 4. Coefficients of correlation (r)between the logarithms of sugar content on the fiber and on the flat strips and residues collected on textile equipment. Specific sugars (fructose, glucose, melezitose, sucrose, and trehalulose) are expressed as a percentage of total sugars. Codes denote: A) card flat; B) draw frame – drafting zone; C) ring spinning frame - back rubber rolls; D) ring spinning frame - back steel rolls; E) ring spinning frame - belt; F) ring spinning frame - center rubber rolls; G ) ring spinning frame - front rubber rolls; H) ring spinning frame front steel rolls; I) rotor spinning frame face plate; J) rotor spinning frame -feed table; K) rotor spinning frame - rotor groove; L) rotor spinning frame - rotor housing; M) rotor spinning frame - rotor ledge; N) dust test.
Fructose Glucose Melezitose Sucrose Trehalulose
Code r p r p r p r p r p
A 0.701 a† 0.002 0.531 a 0.028 0.612 a 0.009 0.064 0.807 0.734 a 0.001
B 0.056 0.828 0.537 a 0.026 0.214 0.408 0.133 0.612 0.607 a 0.010
C 0.004 0.986 0.449 0.070 -0.039 0.882 0.127 0.627 0.434 0.081
D -0.021 0.937 0.543 a 0.024 0.227 0.381 0.143 0.584 0.537 a 0.026
E -0.175 0.502 0.502 a 0.040 0.261 0.311 -0.073 0.781 0.652 a 0.005
F 0.062 0.813 0.576 a 0.015 0.339 0.183 0.144 0.581 0.746 a 0.001
G 0.199 0.443 0.747 a 0.001 0.191 0.463 0.011 0.966 0.838 a 3 × 10⁻⁵
H 0.022 0.932 0.430 0.085 0.164 0.529 0.395 0.116 0.726 a 0.001
I 0.144 0.582 0.304 0.234 0.198 0.447 -0.301 0.239 0.512 a 0.035
J 0.039 0.882 0.782 a 2 × 10⁻⁴ 0.037 0.887 -0.228 0.378 0.888 a 2 × 10⁻⁶
K 0.271 0.293 0.713 a 1 × 10⁻⁴
0.209 0.420 -0.116 0.656 0.848 a 2 × 10⁻⁵
L 0.151 0.563 0.273 0.290 0.243 0.347 None 0.491 a 0.045
M 0.108 0.680 0.427 0.088 0.299 0.244 -0.161 0.538 0.913 a 3 × 10⁻⁷
N 0.370 0.144 0.570 a 0.017 0.129 0.621 -0.145 0.578 0.924 a 1 × 10⁻⁷
Fig. 6. Trehalulose contents expressed as percent of total sugar, straight line is equality. Relationship between trehalulose content on fiber from 17 mixes and trehalulose content from residues collected from a. front rubber rolls of ring spinning frame; b. front steel rolls of ring spinning frame; c. rotor feed table of rotor spinning frame; d. rotor ledge of rotor spinning frame; e. dust collected in dust tests.
literature. Among the selected sugars, trehalulose has the lowest melting point (48(C). It begins to melt immediately when the temperature starts rising. The other sugars remain stable when the temperature rises to 116(C (melting point of fructose). Therefore, any increase in the temperature of the textile processing equipment will first affect trehalulose, causing it to either stick to the mechanical parts or become the precursor of nep formation. Figure 8 shows one example of a sticky nep on the 18th doff of the yarn produced from Mix no. 8. Hequet and Frydrych (1992) showed an excellent relationship between ring-spun yarn neps and stickiness measurements on the raw material using the manual thermodetector. In this study, the authors showed that, on average, each sticky spot counted on the
thermodetector translated into 2.8 additional neps on ring spun yarn (20 x 10-6 kg m-1 or 20-tex). The build-up of residues on the textile equipment may have long-term effects, first sticking to surfaces, then catching dust, silica etc., increasing the friction forces within the machinery and leading to excessive wear and temperature increase.
Fig. 7. (a) Differential scanning calorimetry profiles of (a) fructose and glucose, (b) trehalulose and melezitose, and (c) sucrose.
Fig. 8. Scanning electron microscopy of a nep produced on the 18th doff of the Mix no. 8.
humidity. Therefore, the hygroscopic properties of the five sugars identified on the contaminated fiber
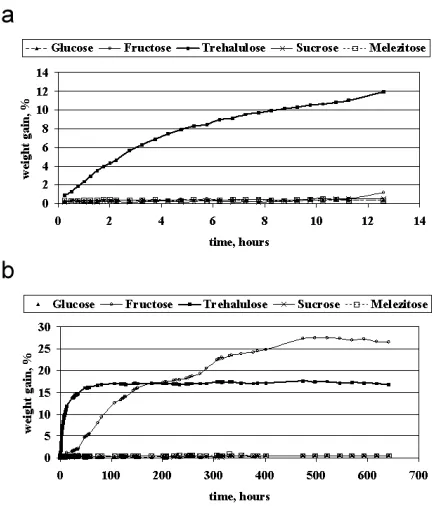
were investigated. The stickiness tests (thermodetector or high-speed stickiness detector) were always performed in a standard textile laboratory atmosphere, according to American Society for Testing and Materials standard procedure D 1776 (ASTM, 2001). Thus, the quantity of water adsorbed on each sugar was evaluated at 65% ± 2% relative humidity and 21(C ± 1(C. Figure 9a shows the percentage weight gain during the first 12 h of hydration. No sugar showed any significant variation within this time period except trehalulose, which picked up about 12% of moisture - corresponding to two molecules of water per molecule of trehalulose.
The weight gain of the sugar samples was recorded until plateaus were reached. Trehalulose continued to pick up moisture, while fructose began to pick up moisture after 12 h of exposure to the laboratory conditions (Fig. 9b). The hydration kinetic was very fast for trehalulose - equilibrium was reached after 80 h, but slow for fructose - the plateau was reached after 500 h. The total amount of weight gain corresponds to three molecules of water per molecule of trehalulose and three molecules of water per molecule of fructose. If we assume that trehalulose accumulates more on the spinning
Table 6. Melting points and decomposition points of selected sugars measured with differential scanning calorimetry.
Sugar Melting point Decomposition point
---((((C
---Fructose 116 178
Glucose 152 210
Sucrose 184 215
Trehalulose 48 193
Fig. 9. (a) Hydration kinetic of selected sugars at 65% ± 2% relative humidity and 21((((C ± 1((((C from 0 to 12.6 h. (b) Hydration kinetic of selected sugars at 65% ± 2% relative humidity and 21((((C ± 1((((C from 0 to 650 h.
equipment than other sugars because of its hygroscopicity, then fructose should accumulate in a similar way, but this was not the case. The high-performance liquid chromatography tests performed on the residues collected on the textile equipment did not show any increase in fructose content, even if fructose content was high in some mixes. In the 17 mixes tested, the fructose content, expressed as a percentage of the fiber weight, ranged from 0.012% to 0.101%, which corresponds to 10.6% to 33.6% when expressed in the percentage of the total sugars identified. Thus, the fact that trehalulose is highly hygroscopic does not explain why this sugar has the tendency to accumulate more on the textile equipment than other sugars. The combination of high hygroscopicity and low melting point of trehalulose renders it stickier than the other sugars, allowing its higher concentration on the textile equipment.
CONCLUSIONS
Stickiness caused by honeydew contamination has been reported to cause residue build-up on textile
machinery, which may cause subsequent irregularities or yarn breakage. We evaluated 17 mixes having a moderate level of stickiness. In both ring and rotor spinning, trehalulose content had the tendency to increase in the residues collected on the equipment while the other sugars did not.
The study of the thermal properties of the identified sugars present on contaminated lint shows that among the selected sugars, trehalulose has the lowest melting point (48(C). It begins to melt as soon as the temperature starts rising. Therefore, any increase in the temperature of the textile processing equipment will first affect trehalulose. In addition, trehalulose is highly hygroscopic.
The combination of high hygroscopicity and low melting point could explain the higher concentration of trehalulose in the residues collected on the textile equipment than on the original fiber.
ACKNOWLEDGMENTS
This project was supported by Cotton Incorporated and the Texas Food and Fibers Commission. The authors wish to thank P. Williams and B. Wyatt for their valuable technical assistance.
REFERENCES
American Society for Testing and Materials. 2001. D1776-Practice for conditioning textiles for testing. ASTM, West Conshohocken, PA.
Budavari, A. (ed.) 1989. Merck Index, 11th ed. Merck & Co., Rahway, NJ.
Frydrych, R., E. Goze, and E. Hequet. 1993. Effet de l’humidite relative sur les resultats obtenus au thermodetecteur. Cotton et Fibres Trop. 48(4):305-311.
Frydrych, R., and E. Hequet. 1998. Standardization proposal: The thermodetector and its methodology. p. 97-102. In Proc. Int. Comm. Cotton Testing Methods, Bremen, Germany. Int. Textile Manuf. Fed. Zurich, Switzerland.
Frydrych, R., E. Hequet, and G. Cornuejols. 1994. A high speed instrument for stickiness measurement. p. 83-91. In 22nd Int. Cotton Conference Int. Textile Manufacturers Federation. Bremen, Germany. 3-5 March 1994. Faserinstitut, Bremen, Bermany.
Hector, D.J., and I.D. Hodkinson. 1989. Stickiness in cotton. ICAC Review Articles on Cotton Production Res. 2. CAB Int., Oxon, UK.
Hendrix, D.L. 1999. Sugar composition of cotton aphid and silverleaf whitefly honeydews. p. 47-52. In Proc. Beltwide Cotton Prod. Res. Conf., Orlando, FL. 3-7 Jan. 1999. Natl. Cotton Counc. Am., Memphis, TN.
Hendrix, D.L., T.L. Steele, and H.H. Perkins JR. 1995. Bemisia honeydew and sticky cotton. p. 189-199. In D. Gerling and R.T. Mayer (ed.) Bemisia: Taxonomy, biology, damage, control and management. Intercept, Andover, UK.
Hendrix, D.L., Y.-A. Wei, and J.E. Leggett. 1992. Homopteran honeydew sugar composition is determined by both the insect and plant species. Comp. Biochem. Physiol. 101B(1/2):23-27.
Hequet, E., D. Ethridge, B. Cole, and B. Wyatt. 2000. How cotton stickiness measurements relate to spinning efficiency. p. 99-121. In Proc. 13th Annu. Engineer Fiber Selection System Conference. 17-19 April 2000. Cotton Inc., Cary, NC.
Hequet, E., and R. Frydrych. 1992. Sticky cotton from plant to yarn. p. 3-19. In New methods to test stickiness in cotton. International Cotton Advisory Committee, Washington, DC.
Miller, W.B., E. Peralta, D.R. Ellis, and H.H. Perkins, Jr. 1994. Stickiness potential of individual insect honeydew carbohydrates on cotton lint. Textile Res. J. 64(6):344-350.
Morton, W.E., and J.W.S. Hearle. 1993. Physical properties of textiles fibers. p. 529. In Physical properties of textile fibers. The Textile Institute, Manchester, UK.
Perkins, H.H., Jr. 1984. Use of additives to improve the processing quality of whitefly contaminated cotton. p. 379. In Proc. Beltwide Cotton Prod. Res. Conf., Atlanta, GA. 8-12 Jan. 1984. Natl Cotton Counc. Am., Memphis, TN.
Price, J. 1988. Research on processing sticky cotton. Textile Topics 17(4):1-3.
Sisman, S., and A. Schenek. 1984. ‘Bremen Honeydew Test’-new method for testing the sticking tendency of cotton. Melliand Textilberichte 13:593-595.
Watson, M.D. 2000. An overview of cotton stickiness. p. 63.
In Proc. Int. Cotton Conf., Bremen, Germany. 1-4 March