DEMOGRAPHIC RESEARCH
VOLUME 29, ARTICLE 46, PAGES 1299-1330
PUBLISHED 13 DECEMBER 2013
http://www.demographic-research.org/Volumes/Vol29/46/ DOI: 10.4054/DemRes.2013.29.46
Research Article
Nonresident fathers and formal child support:
Evidence from the CPS, the NSFG, and the SIPP
J. Bart Stykes
Wendy D. Manning
Susan L. Brown
© 2013 J. Bart Stykes, Wendy D. Manning & Susan L. Brown.
This open-access work is published under the terms of the Creative Commons Attribution NonCommercial License 2.0 Germany, which permits use, reproduction & distribution in any medium for non-commercial purposes, provided the original author(s) and source are given credit.
1 Introduction 1300
1.1 Background 1302
1.2 Current investigation 1304
2 Method 1305
2.1 Surveys and samples 1305
2.2 Sampling design: Direct versus indirect reporting 1306
2.3 Questionnaire design 1307
2.4 Analytic strategy 1309
3 Results: Estimating nonresident fathers 1311 3.1 Results: The composition of nonresident fathers 1312 3.2 Gauging the effects of identifying nonresident fathers 1314
4 Discussion 1317
5 Acknowledgments 1321
References 1322
Nonresident fathers and formal child support:
Evidence from the CPS, the NSFG, and the SIPP
J. Bart Stykes1 Wendy D. Manning2
Susan L. Brown3
Abstract
BACKGROUND
Since the beginning of the 1980s, researchers have been raising concerns that surveys underestimated nonresident fatherhood due to sampling and questionnaire effects. Consequently, federal data collection efforts focused resources on reports from custodial mothers rather than from nonresident fathers. Recent data from three national sources provide researchers with an opportunity to estimate the prevalence of nonresident fathers.
OBJECTIVE
Our goals were to provide estimates of contemporary nonresident fatherhood and of formal child support payments in the U.S., and to examine the consistency of these estimates across surveys.
METHODS
We presented descriptive results for the proportion of men (aged 15-44) who reported having a nonresident child, and the proportion of nonresident fathers who reported having provided some formal support in the last year, using three nationally representative surveys: the Current Population Survey (CPS), the Survey of Income and Program Participation (SIPP), and the National Survey of Family Growth (NSFG).
RESULTS
The NSFG produced higher estimates of nonresident fatherhood, whereas both the CPS and the SIPP produced lower estimates of nonresident fatherhood. The findings on the composition of the nonresident father population by race/ethnicity and educational attainment also differed across the surveys. The results further demonstrated that the
1 Bowling Green State University, USA. E-Mail: [email protected]. 2
nonresident fathers identified in the NSFG were less likely to have been providing formal support, and that the racial/ethnic and educational differences found in the provision of formal support varied across the surveys.
CONCLUSIONS
Three nationally representative U.S. surveys produced substantively different estimates of the nonresident father population, and of the extent to which these fathers were providing formal child support. Ultimately, this study illustrates that we lack robust estimates of nonresident fatherhood in the U.S.
1. Introduction
Given the growing number of children who are living apart from their fathers, it is essential that social scientists accurately measure the prevalence of nonresident fatherhood. Research has shown that nonresident fathers can have positive influences on the well-being of their children (Amato and Gilbreth 1999; Carlson 2006). As two out of five children in the United States do not live with their biological father (Kreider and Ellis 2011), this has become an increasingly critical issue.
The quality of the data collected on nonresident fathers in the 1980s and 1990s has been extensively scrutinized by a number of prominent scholars, who concluded that household surveys underestimated the presence of nonresident fathers (Cherlin, Griffith, and McCarthy 1983; Garfinkel, McLanahan, and Hanson 1998; Seltzer and Brandeth 1994; Sorenson 1997). Marsiglio et al.’s (2000) review of research on fatherhood in the 1990s noted that the household surveys conducted during the decade produced low estimates of nonresident fatherhood, largely because nonresident fathers were more likely to have been institutionalized, and often simply were not included in the household surveys. Others also suggested that men were less likely to have reported having nonresident children than women, who readily reported having a child whose father was living elsewhere (Garfinkel, McLanahan, and Hanson 1998; Sorenson 1998). Although some researchers have called for the collection of data from both custodial mothers and nonresident fathers (Smock and Manning 1997), many family scholars have suggested that limited resources should be focused on collecting reports of child support from custodial mothers rather than from nonresident fathers (Sorenson 1998). Indeed, from 1987 through the 1990s, no survey of the entire non-institutionalized U.S. population asked questions that would have identified nonresident fathers (Sorenson 1998).
Recent cycles of both the CPS and the SIPP have re-introduced items identifying nonresident fathers at least 20 years after the quality of these measures was first called into question. In addition, recent rounds of the National Survey of Family Growth (NSFG) provided an individual-level, nationally representative survey of men that included data on fertility histories and parenting. As nonmarital childbearing (Martinez, Daniels, and Chaundra 2012; Ventura 2009) and family complexity (Cherlin 2010) have become increasingly prevalent, nonresident fathers might be more willing to report the presence of nonresident children because their circumstances are now more normative and are effectively less stigmatized. In light of these changes in contemporary families and the availability of new data, we decided to revisit the debate about household surveys and the extent to which these surveys are able to identify nonresident fathers.
Using data from the 2011 CPS March Supplement, the Wave 4 Poverty Topical Module from the 2008 SIPP panel, and the 2006–2010 NSFG, we compared estimates of the nonresident father population and examined the socioeconomic characteristics of nonresident fathers identified in these surveys. Our project extended prior research in three ways. First, we provided an update to Sorenson’s (1997) estimates for the nonresident fathers identified in household surveys. Second, we expanded on Sorenson’s (1997) analyses by comparing estimates of the nonresident father population in both household surveys (CPS and SIPP) and an individual-based survey (NSFG). Finally, we considered the effects of survey measurement by comparing the findings regarding the likelihood that a nonresident father was providing formal child support across three nationally representative surveys.
prevalence of nonresident fathers. Finally, we find that there were differences in the estimates of formal child support payments across the surveys.
1.1 Background
Several researchers have raised concerns about the underreporting of the nonresident father population in household surveys (e.g., Cherlin, Griffith, and McCarthy 1983; Garfinkel, McLanahan, and Hanson 1998; Seltzer and Brandeth 1994; Sorenson 1997). Cherlin, Griffith, and McCarthy (1983) demonstrated that the 1980 CPS had undercounted nonresident fathers, and strongly recommended that this limitation be acknowledged when discussing results related to nonresident fathering and child support from the CPS. Seltzer and Brandeth (1994) found similar underreports of the nonresident father population in Wave 1 of the National Survey of Families and Households (NSFH). Finally, Sorenson (1997) examined both the SIPP and the NSFH, and concluded that these surveys underestimated the nonresident father population by 22% and 44%, respectively.
Several factors might have contributed to these low estimates. For instance, household surveys typically exclude non-institutionalized populations (e.g., individuals living in correction institutions, military barracks, etc.), who are predominately male. Research has shown that past household surveys frequently undercounted young, disadvantaged men (Martin 2007), which suggests that these surveys likely undercounted nonresident fathers as well (e.g., Berger and Langton 2011; Marsiglio et al. 2000; Nelson 2004; Rendall et al. 1999; Pettit 2012; Sorenson 1997). Since disadvantaged men are also underrepresented in the U.S. Census, weighting procedures failed to correct for these undercounts in surveys (see Rendall et al. 1999). Finally, men were less likely to have reported having children who lived elsewhere, whereas women were more likely to have reported having a child whose father was living elsewhere (Garfinkel, McLanahan, and Hanson 1998; Sorenson 1997).
in identifying men with weak ties to households, and that these men were more likely to be nonresident fathers (Berger and Langton 2011; Marsiglio et al. 2000; Nelson 2004; Randall et al. 1999; Petit 2012; Sorenson 1997). Some recent household surveys (e.g., 2004 and 2008 SIPP panels) used probes to identify more disadvantaged individuals with weaker ties to households. Indeed, the technical papers concerning the SIPP survey design suggested that the probes included in the 2004 SIPP reduced within-household underreporting by identifying individuals with weaker ties to households (Chan 2007). However, the CPS technical documentation suggested that the CPS did not include probes intended to identify household members (US Census Bureau 2006a). Sorenson (1998) also suggested that questionnaire design might have influenced the estimates of the number of nonresident fathers. To the best of our knowledge, no one has rigorously assessed the questionnaire effects of the measures used to identify nonresident fathers. However, studies (Joyner et al. 2012; Lindberg et al. 1998) have demonstrated that the quality of male fertility data is influenced by questionnaire design. For instance, linking questions about fertility to previous romantic partners has been shown to have significantly improved the quality of male fertility data (Joyner et al. 2012; Lindberg et al. 1998). Although these studies did not specifically consider the quality of the data on nonresident fathers, we suggest that the quality of male fertility data is linked to estimates of nonresident fatherhood. If referencing previous romantic partners increased estimates of fatherhood, a similar strategy should have also increased estimates of nonresident fatherhood, as it is likely that more men would have recalled any children they had (both coresident and nonresident).
The different ways that nonresident fathers are identified may have implications for the assessments of fathers’ reports of child support payments, which have been considered an important factor in the well-being of children (Amato and Gilbreth 1999; Bartfield 2000; Greene and Moore 2000; Hofferth, Forry, and Peters 2010). Prior studies compared fathers’ and mothers’ reports of child support payments (see Smock and Manning 1997), relied on custodial mothers reports (Grall 2011; Seltzer, Schaefer, and Charng 1989), and used administrative records (Ha, Cancian, and Meyer 2011) to inform discussions of child support. The results of these studies indicated that black and Hispanic fathers were less likely to have been making formal child support payments than white nonresident fathers (Huang, Mincy, and Garfinkel 2005; Smock and Manning 1997). Similarly, fathers with lower educational attainment were shown to have been providing less formal child support than their better educated counterparts (Huang, Mincy, and Garfinkel 2005; Rangarajan and Gleason 1998; Smock and Manning 1997).
sources of income. Meyer, Mok, and Sullivan (2009) compared estimates of the receipt of public assistance from household surveys such as the ACS, the CPS, and the SIPP with administrative data, and found that underreporting varied across both programs and surveys. Specifically, the CPS captured 50% of workmen’s compensation benefits, which was actually higher than the share captured by the SIPP; however, the SIPP provided better estimates of the receipt of AFDC/TANF than the CPS (Meyer, Mok, and Sullivan 2009). With respect to formal child support, Meyer, Ha, and Hu (2008) examined administrative court data, and found that the median amount of child support nonresident fathers provided was approximately $3,000, with only 13% of nonresident fathers not providing any financial support during the first year of their court order. Administrative data for Wisconsin provided higher estimates than Sorenson’s (1997) estimates, which were based on survey data: $2,312 (SIPP) and $2,739 (NSFH). In addition, the survey data suggested that a higher percentage of nonresident fathers were not paying formal child support. However, the estimates from the administrative data were based on only the nonresident fathers who had a formal child support order issued in Wisconsin in 2000 (Meyer, Ha, and Hu 2008). Thus, we have no administrative data that include nonresident fathers without a formal child support agreement in calculations of the amount of financial support nonresident fathers provided.
1.2 Current investigation
individual-based sampling designs produce better estimates of nonresident fatherhood, as direct or self-reports (obtained in an individual-based survey) tend to be more accurate than indirect reports (obtained in a household survey). Second, our comparison of the surveys provides us with an opportunity to assess questionnaire strategies. In the method section, we discuss both the context of the questions in the surveys and the questionnaire strategies used to identify nonresident fathers and the amount of support they provided across surveys. Ultimately, we anticipate that a more complex questionnaire strategy using multiple questions to ask men about the residency status of each child ever fathered (used by the NSFG) produces higher estimates than the single-question strategy (used by the CPS and the SIPP). Third, we provide a descriptive profile of nonresident fathers using each of these nationally representative surveys. We expect to find that the prevalence and composition of nonresident fathers identified in each survey varied somewhat due to differences in sampling design and questionnaire strategies. Finally, we assess the implications of differences across these data by comparing estimates of formal child support payments across the data sources.
2. Method
This section presents detailed descriptions of the sampling and questionnaire strategies used by the CPS, the SIPP, and the NSFG, emphasizing the variation across these surveys and the possible effects such variation might have on estimates of nonresident fatherhood. After discussing the samples and questionnaires in detail, we describe our analytic strategy.
2.1 Surveys and samples
Table 1: Time comparisons for the CPS, SIPP, and NSFG
CPS SIPP NSFG
Period of data collection March 2011 August – October 2009
June 2006 – June 2010 Question's frame of reference "In 2010" "In the last 4 months" Currently
Time difference across surveys (years)
NSFG 0–4 0–3 --
SIPP 1 -- 0–3
CPS -- 1 0–4
Next, we ensured that the samples were as comparable as possible. The CPS and the SIPP both interviewed respondents who were aged 15 and older. In contrast, the NSFG sample was limited to individuals aged 15–44. So that all three samples had identical age ranges, we limited the CPS and the SIPP samples to men aged 15–44.
2.2 Sampling design: Direct versus indirect reporting
sampling design, the NSFG sampled individuals. Respondents in the NSFG were men aged 15–44 who provided information on their own behaviors and attitudes. In effect, all of the nonresident fathers identified in the NSFG were identified directly.
For two reasons, we expected to find that the individual-based sampling strategy produced higher estimates of nonresident fatherhood. First, respondents are arguably more knowledgeable about their own fertility histories and the living arrangements of their children, and are thus more likely to provide more accurate information. A household head (proxy respondent) with close ties to the “other” household members (such as a parent or a spouse/partner) might have been cognizant of their nonresident child(ren). However, household heads (proxy respondents) with weaker ties to other household members (such as a roommate or a boarder) might have been unaware of their nonresident children. Second, Martin (2007) demonstrated that disadvantaged men were often overlooked in household surveys, and Sorenson (1997) suggested that household surveys (specifically, the 1987–88 NSFH and the 1990 SIPP panel) underestimated the number nonresident fathers by omitting the most disadvantaged men from their sampling frames. Although the SIPP included probes to capture these individuals, we expect to find that the CPS underestimated the number of nonresident fathers by omitting those men who were typically disadvantaged and had weak ties to households.
2.3 Questionnaire design
Both the CPS and the SIPP relied on a single question to identify nonresident fathers (see the appendix). Minimal differences existed between the questions included in the CPS and the SIPP. However, the SIPP had more stringent criteria for identifying nonresident fathers. The CPS asked men whether they had a child who had been living elsewhere with the other parent or another guardian in the past year (2010), whereas the SIPP asked men whether they had a child who had been living elsewhere with the other parent in the last four months. Therefore, based on the question design, we expected to find that the CPS produced slightly higher estimates of the number of nonresident fathers than the SIPP.
We coded respondents who were male, aged 15–44, and replied “yes” to these questions into a dummy variable, nonresident father (1). Other respondents who were male, aged 15–44, and replied “no” to these questions were coded as not being nonresident fathers (0).
The NSFG used a more elaborate method to identify nonresident fathers that involved placing questions in the context of previous sexual partners. First, the NSFG asked men, “Have you and [woman’s name] ever had a child together?” This question was asked in relation to each woman with whom the respondent reported having had sexual relations. Next, the NSFG asked, “Where does [child’s name] usually live now?” Again, this question was asked in relation to each child the respondent had ever fathered. Based on these questions, the NSFG provided a computed variable that counted the number of nonresident children aged 18 or younger that each respondent reported having fathered. Since we were concerned with identifying nonresident fathers, we recoded the NSFG variable into a dummy variable that distinguished nonresident fathers (1) from other men aged 15–44 (0).
research has shown that responses regarding formal child support payments were influenced by social desirability biases, and that the ordering of questions had implications for the effects of social desirability (see Schaeffer, Seltzer, and Klawitter 1991). For instance, both the CPS and the SIPP included questions that identified nonresident children following a series of questions about annual expenses (including, but not limited to, the costs of child care). In contrast, the NSFG included questions about the child(ren)’s place of residence following questions about the previous partners. After identifying the nonresident fathers, the NSFG asked about the amount of support provided, followed by a question about whether there was a court order; whereas the CPS/SIPP asked whether there was a court order, and then about the amount of support provided.
We suggest that the CPS and the SIPP likely underestimated nonresident fatherhood by systematically omitting some of the most disadvantaged nonresident fathers, because both of the surveys asked about the child(ren)’s place of residence after inquiring about the household expenditures. In addition, we expect to find that the CPS/SIPP produced higher estimates of the amount of formal child support provided by asking whether there was a court order before asking about the amount of financial support provided to nonresident children, as this would have led to a greater degree of social desirability bias.
2.4 Analytic strategy
Our analyses proceeded in three steps. First, we addressed the prevalence of nonresident fatherhood by reporting the proportions of men (and fathers/fathers with minor children) who were nonresident fathers. Considering the proportion of fathers who had nonresident children might seem to have been more intuitive. However, we determined that these estimates would have presented additional biases, as fathers were identified differently across surveys (see Joyner et al. 2012). Second, we explored the characteristics of nonresident fathers across surveys by reporting the distributions of the socioeconomic characteristics of the nonresident fathers identified in each survey. Finally, we compared the estimates of the prevalence of formal child support provision across the surveys.
proportion of fathers with minor children (men with at least one child under 18) with a nonresident child. Then, we documented the composition of the nonresident fathers identified in each of the three surveys by examining the distributions of nonresident fathers across race/ethnicity, educational attainment, formal marital status, and age. Race/ethnicity was coded as four mutually exclusive and exhaustive categories: white non-Hispanic, black non-Hispanic, Hispanic, and other (including multi-racial). Educational attainment was coded into four mutually exclusive and exhaustive categories: less than high school, high school graduate (including GED), some college, and a bachelor’s degree or higher. Formal marital status (marital status) was coded as five mutually exclusive, exhaustive categories: married, divorced, separated, widowed, and never married. Age was coded into three mutually exclusive and exhaustive categories: 35–44, 25–34, and 15–24.
We conducted additional analyses on formal child support paid in order to assess the implications of inconsistent estimates of nonresident fatherhood. Both the CPS and the NSFG collected data on the annual amount of formal child support paid4. The SIPP collected data on the amount of formal child support paid in the previous four months. To make the estimates comparable, we assumed that the levels of nonresident fathers’ payments in the SIPP were evenly distributed across the previous year, and then multiplied the total amount of support (in the last four months) by three5. We acknowledge that we were making an assumption, but this was necessary to ensure that the estimates comparable across the data sets. The measure of child support paid in the NSFG was categorical (e.g., “None, doesn’t pay,” “Under $3,000 per year,” “$3,001– $5,000 per year,” “$5,001–$9,000 per year,” and “More than $9,000 per year”). For ease of comparison across the surveys, we recoded the actual dollar amounts of support from the SIPP into the same categories. We also considered the differences in the levels of formal child support by racial/ethnic group and educational attainment.
4 Our analyses of the amount of formal child support paid omitted the CPS because all of the nonresident fathers with a formal order reported providing at least $1 of support in the previous year. This seems unlikely, and we cannot resolve this issue using the CPS technical documentation. We expect that the CPS overestimated the extent to which nonresident fathers paid formal support.
3. Results: Estimating nonresident fathers
Table 2 presents the proportions of nonresident fathers identified in each dataset for three subpopulations: men aged 15–44, fathers aged 15–44, and fathers aged 15–44 with minor children. The NSFG produced considerably higher estimates of the proportions of nonresident fathers than either the CPS or the SIPP. According to the NSFG, 12.0% of all men aged 15–44 had at least one nonresident child. Meanwhile, the CPS and the SIPP indicated that 4.1% and 6.3%, respectively, of men aged 15–44 had a nonresident child. Differences in the sampling strategies suggested that the SIPP should have produced higher estimates of nonresident fatherhood, whereas differences in the questionnaires suggested that the CPS should have produced higher estimates. However, we found minimal differences in the estimates of nonresident fatherhood in the CPS and the SIPP. More substantial differences in estimates emerged when we compared the NSFG with the CPS and the SIPP, which was consistent with our expectations.
Estimates of the proportion of fathers who had nonresident children followed similar patterns. The NSFG yielded the highest estimates: the survey found that 26.8% of fathers (aged 15–44) with minor children had at least one nonresident child under age 18. The comparable figures were 8.2% for the CPS and 12.2% for the SIPP. The results consistently showed that the NSFG produced higher estimates of nonresident fathers than the CPS and the SIPP. It was also noteworthy that the CPS and the SIPP yielded comparable estimates of the share of nonresident father among all of the men surveyed. Additional analyses (not shown) demonstrated that 58% and 61% of nonresident fathers identified in the CPS and the SIPP, respectively, were identified directly. Thus, a considerable share of nonresident fathers in the CPS and the SIPP were identified by another member of the household.
Table 2: Estimating nonresident fatherhood: The percentages of nonresident fathers in the CPS, the SIPP, and the NSFG
2011 CPS Direct and Proxy
Reports
2008 SIPP Direct and Proxy
Reports
2006 – 2010 NSFG Direct Reports
N % N % N %
Men 1,612 4.1 1,067 6.3 1,324 12.0 Fathers with minor children 1,612 8.2 NA NA 1,324 26.8 Fathers NA NA 1,067 12.2 1,324 26.8
Source: 2011 Current Population Survey ASEC Supplement; 2008 SIPP Wave IV Poverty Module; 2006–2010 NSFG Male
Data File.
Notes: This table presents unweighted frequencies and weighted percents.
3.1 Results: The composition of nonresident fathers
Table 3: Demographic and sociodemographic distributions of nonresident fathers (15–44)
2011 CPS 2008 SIPP 2006–2010 NSFG
N % N % N %
Race/Ethnicity
White 920 58.5 670 57.5 426 40.8 Black 264 19.4 176 17.4 404 23.3 Hispanic 321 17.5 149 19.0 397 28.9 Other 107 4.6 72 6.1 97 7.0 Educational Attainment
Less than high school 250 15.3 134 11.9 492 37.3 High school/GED 622 38.5 413 38.4 449 32.0 Some college 497 30.9 388 36.9 296 24.7 At least a bachelor's 243 15.3 132 12.8 87 6.0 Marital Status
Married 594 32.6 382 34.1 357 37.8 Divorced 432 26.8 288 27.5 286 20.1 Separated 145 11.2 92 9.0 132 8.1 Widowed 7 0.4 3 0.3 9 0.5 Never married 434 29.0 302 29.1 540 33.5 Age
35–44 years old 963 57.9 592 56.2 678 53.4 25–34 years old 537 35.1 361 34.3 516 37.3 15–24 years old 112 7.0 114 9.5 130 9.3
N 1,612 1,067 1,324
Source: 2011 Current Population Survey ASEC Supplement; 2008 SIPP Wave IV Poverty Topical Module; 2006–2010 NSFG Male
Data File.
Notes: This table presents unweighted frequencies and weighted percents.
Hispanics: the share of the nonresident fathers classified as Hispanic was 28.9% according to the NSFG, 17.5% according to the CPS, and 19.0% according to the SIPP.
The distribution of educational attainment among nonresident fathers followed similar patterns (Table 3). One in seven (15.3%) of the nonresident fathers identified in the CPS (11.9% in the SIPP) reported having less than a high school degree. In contrast, over one-third (37.3%) of the nonresident fathers identified in the NSFG reported having less than a high school degree. The educational distribution of the nonresident fathers in the CPS and the SIPP exhibited a U-shaped pattern, whereas the distribution of the nonresident fathers in the NSFG followed a strong, negative education gradient, with higher proportions of the nonresident fathers reporting lower levels of education. Although differences in marital status were less stark, larger shares of the nonresident fathers in both the CPS and the SIPP were divorced. Depending on the survey, approximately one-fourth (26.8% and 27.5% in the CPS and the SIPP, respectively) to one-fifth (20.1% in the NSFG) of the nonresident fathers were divorced. Similarly, larger shares of the nonresident fathers in the NSFG were either married (37.8%) or never married (33.5%) than in the CPS and SIPP (see Table 3). As Table 3 shows, minimal age differences emerged for the nonresident fathers across the surveys.
3.2 Gauging the effects of identifying nonresident fathers
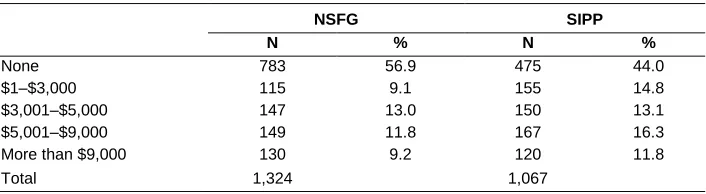
Table 4 reports estimates of the amount of formal child support provided in the previous year. Less than half (43.1%) of the nonresident fathers in the NSFG provided formal support to their nonresident children whereas more than half (56.0%) of the nonresident fathers in the SIPP provided formal child support. In terms of the amount of child support paid, nonresident fathers in the SIPP reported paying more child support, on average, than nonresident fathers in the NSFG. Supplemental analyses demonstrated that 3.9% of nonresident fathers in the SIPP had a child support order, but had not provided support in the last four months. This estimate was considerably lower than the estimate of Meyer, Ha, and Hu (2008), which suggested that 13% of nonresident fathers with a court order did not provide support in the first year. We see this as evidence that surveys are more likely to overestimate the payment of formal child support than administrative data.
Table 4: Amount of formal support provided (all nonresident fathers)
NSFG SIPP
N % N %
None 783 56.9 475 44.0
$1–$3,000 115 9.1 155 14.8 $3,001–$5,000 147 13.0 150 13.1 $5,001–$9,000 149 11.8 167 16.3 More than $9,000 130 9.2 120 11.8
Total 1,324 1,067
Source: 2008 SIPP Wave IV Poverty Module; 2006–2010 NSFG Male Data File.
Notes: The SIPP only asked respondents about child support paid over the last four months whereas the NSFG asks about yearly
child support provided. In response we multiply the total amount of support provided for all four months by three. This table presents unweighted frequencies and weighted percents.
21.9% of the Hispanic nonresident fathers in the NSFG reported providing financial support which was at least in part the result of a court order, versus 47.9% in the SIPP.
Table 5: Percentage of nonresident fathers who provided some formal child support by race/ethnicity and education
NSFG SIPP
N % N %
Race/Ethnicity
White 239 60.0 b,c 409 62.5 b,c Black 161 39.0 a,c 78 46.2 a Hispanic 98 21.9 a,b 72 47.9 a
Educational Attainment
At least a bachelor's 44 48.0 h 86 68.9 e,g,h Some college 154 53.6 h 226 58.1 f,h HS/GED 200 52.9 h 233 56.3 f,h Less than high school 143 27.1 e,f,g 47 34.6 e,f,g
Source: 2008 SIPP Wave IV Topical Module; 2006–2010 NSFG Male Data File.
Notes: a denotes a significant difference from white, b denotes a significant difference from black, c denotes a significant difference
from Hispanic, e denotes a significant difference from high school/GED, f denotes a significant difference from At least a bachelor's, g denotes a significant difference from some college, h denotes a significant difference from less than high school.
4. Discussion
Monitoring change in the numbers and composition of nonresident fathers is important for policies targeted at the well-being of children and parents. Newly released data provide researchers with an opportunity to incorporate the nonresident father’s perspective on complex family dynamics, such as child support and multiple partner fertility. However, to date, no one has examined the quality of these recent data on nonresident fathers. Given the concerns about the quality of the data collected on nonresident fathers in the 1980s and 1990s, this oversight merits attention.
Our study yielded two key conclusions. First, we found considerable inconsistencies in the estimates of the prevalence of nonresident fathers across surveys. The CPS and SIPP generated comparably modest estimates of the prevalence of nonresident fathers, whereas the NSFG produced considerably higher estimates. Since prior research has found consistent evidence that household surveys underestimated the prevalence of nonresident fathers (e.g., Cherlin, Griffith, and McCarthy 1983; Garfinkel, McLanahan, and Hanson 1998; Sorenson 1997), we suggest that the NSFG’s estimates of nonresident fathers were likely to have been more accurate than the CPS’ and SIPP’s estimates. Further, we found variation in the types of nonresident fathers identified in household-based surveys and in individual-based surveys. Prior research has noted that the demographic characteristics of the nonresident fathers found in two of the household surveys, the NSFH and the SIPP, were remarkably similar (Sorenson 1998). However, we documented substantial variation in the distributions of race/ethnicity and educational attainment for the nonresident fathers identified in the household- and the individual-based surveys. In general, larger shares of the nonresident fathers identified in the NSFG belonged to minority racial/ethnic groups and reported lower educational attainment than in the CPS and the SIPP.
fathers than the CPS, which suggests that nonresident fathers continue to be an elusive survey population (see Sorenson 1997).
In addition to these insights into survey design, the results provided evidence that supported our expectations regarding the importance of questionnaire strategy. The NSFG arguably produced higher estimates because it used a detailed series of questions to identify men with nonresident children. Further, we expected that the context of the questions posed in the survey introduced biases as well. The CPS and the SIPP both posed the question used to identify nonresident children directly following questions concerning annual expenses. This approach may have systematically discouraged nonresident fathers who did not (or could not) provide economic support to their children from reporting having them. The results indicated that special attention should be paid to the questions used in identifying nonresident fathers, because the estimates of the shares of nonresident fathers varied substantially across the surveys. In addition, the findings regarding the sociodemographic characteristics of the nonresident fathers (notably race/ethnicity and educational attainment) differed across the surveys.
quality, we suggested that the NSFG likely produced more accurate estimates. Alternatively, the CPS/SIPP could have provided more accurate estimates, while the NSFG overestimated nonresident fatherhood. Due to data limitations, we have no external source for checking the validity of the estimates of the nonresident father population.
5. Acknowledgements
References
Amato, P.R. and Gilbreth, J.G. (1999). Nonresident Fathers and Children’s Well-Being: A Meta-Analysis. Journal of Marriage and the Family 61(3):557–573.
doi:10.2307/353560.
Bartfield, J. (2000). Child support and the postdivorce economic well-being of mothers, fathers, and children. Demography 37(2):203–213. doi:10.2307/2648122.
Berger, L.M. and Langton, C.E. (2011). Young Disadvantaged Men as Fathers. The Annals of the American Academy of Political and Social Sciences 635(1):56–75.
doi:10.1177/0002716210393648.
Cancian, M., Meyer, D.R., and Han, E. (2011). Child Support: Responsible Fatherhood and the Quid Pro Quo. The Annals of the American Academy of Political and Social Science 635(1):140–162. doi:10.1177/0002716210393640.
Carlson, M.J. (2006). Family Structure, Father Involvement, and Adolescent Behavioral Outcomes. Journal of Marriage and Family 68(1):137–154. doi:10.1111/j.1741-3737.2006.00239.x.
Centers for Disease Control and Prevention (2012). National Survey of Family Growth [electronic resource]. www.cdc.gov/nchs/nsfg.htm.
Chan, A.Y. (2007). New Roster Procedures and Probes to Improve Coverage in the Survey of Income and Program Participation. Washington D.C: U.S. Census Bureau: 9, Research Report Series (Survey Methodology #2007–20).
Cherlin, A.J. (2010). The marriage-go-round: the state of marriage and the family in
America today. New York: Vintage.
Cherlin, A.J., Griffith, J., and McCarthy, J. (1983). A Note on Maritally-Disrupted Men’s Reports of Child Support in the June 1980 Current Population Survey. Demography 20(3):385–389. doi:10.2307/2061249.
Child Trends (1998). Nurturing Fatherhood: Improving Data and Research on Male Fertility, Family Formation and Fatherhood [electronic resource].
www.childtrends.org/?publications=nurturing-fatherhood-improving-data-and-research-on-male-fertility-family-formation-and-fatherhood.
Grall, T.S. (2011). Custodial mothers and their child support: 2009. Current Population Report (U.S. Census Bureau): 60–240.
Greene, A.D. and Moore, K.A. (2000). Nonresident Father Involvement and Child Well-Being Among Young Children in Families on Welfare. Marriage and Family Review 29(2–3):159–180. doi:10.1300/J002v29n02_10.
Guzzo, K.B. and Furstenberg, F.F. (2007). Multipartnered Fertility among American Men. Demography 44(3):583–601. doi:10.1353/dem.2007.0027.
Ha, Y, Cancian, M., and Meyer, D.R. (2011). The Regularity of Child Support and Its Contribution to the Regularity of Income. Social Science Review 85(3):401–419. Harknett, K. and Knab, J. (2007). More Kin, Less Support: Multipartnered Fertility and
Perceived Support among Mothers. Journal of Marriage and Family 69(1): 237–253. doi:10.1111/j.1741-3737.2006.00356.x.
Heinrich, C.J. and Holzer, H.J. (2011). Improving Education and Employment for Disadvantaged Young Men: Proven and Promising Strategies. The Annals of the American Academy of Political and Social Science 635(1):163–191.
doi:10.1177/0002716210391968.
Hofferth, S.L., Forry, N.D., and Peters, H.E. (2010). Child-Support, Father-Child Contact, and Preteen’s Involvement with Nonresidential Fathers: Racial/Ethnic Differences. Journal of Family and Economic Issues 31(1):14–32. doi:10.1007/ s10834-009-9172-9.
Huang, C., Mincy, R.B., and Garfinkel, I. (2005). Child Support Obligations and Low-Income Fathers. Journal of Marriage and Family 67(5):1213–1225.
doi:10.1111/j.1741-3737.2005.00211.x.
Joyner, K., Peters, H.E., Hynes, K., Sikora, A., Taber, J.R., and Rendall, M.S. (2012). The Quality of Male Fertility Data in Major U.S. Surveys. Demography 49(1):101–124. doi:10.1007/s13524-011-0073-9.
Kennedy, S. and Bumpass, L.L. (2008). Cohabitation and Children’s Living Arrangements: New Estimates from the United States. Demographic Research 19(47):1663–1692. doi:10.4054/DemRes.2008.19.47.
Kreider, R.M. and Ellis, R. (2011). Living Arrangements of Children: 2009. Current Population Report (U.S. Census Bureau) : 70–126.
Manlove, J., Logan, C., Ikramullah, E., and Holcombe, E. (2008). Factors Associated with Multiple-Partner Fertility among Fathers. Journal of Marriage and Family 70(2):536–548. doi:10.1111/j.1741-3737.2008.00499.x.
Manning, W.D., Smock, P.J., and Majumdar, D. (2004). The relative stability of cohabiting and marital unions for children. Population Research and Policy Review 23(2):135–159. doi:10.1023/B:POPU.0000019916.29156.a7.
Marsiglio, W., Amato, P.R., Day, R.D., and Lamb, M.E. (2000). Scholarship on fatherhood in the 1990s and beyond. Journal of Marriage and Family 62(4):1173–1191. doi:10.1111/j.1741-3737.2000.01173.x.
Martin, E. (2007). Strength of Attachment: Survey Coverage of People with Tenuous Ties to Residences. Demography 44(2):427–440. doi:10.1353/dem.2007.0014.
Martinez, G., Daniels, K., and Chandra, A. (2012). Fertility of Men and Women aged 15–44 Years in the United States: National Survey of Family Growth 2006– 2010. National Health Statistics Report 51:1–28.
Meyer, B.D., Mok, W.K., and Sullivan, J.X. (2009). The Under-Reporting of Transfers in Household Surveys: Its Nature and Consequences. Cambridge: National Bureau of Economic Research, NBER Working Paper Series (Working Paper 15181). doi:10.3386/w15181.
Meyer, D.R., Cancian, M., and Cook, S.T. (2005). Multiple-Partner Fertility: Incidence and Implications for Child Support Policy. The Social Science Review 79(4):577–601.
Meyer, D.R., Ha, Y., and Hu, M.C. (2008).Do Higher Child Support Orders Discourage Child Support Payments? Social Science Review 82(1):93–118.
Mincy, R.B., Klempin, S., and Schmidt, H. (2011). Income Support Policies for Low-Income Men and Noncustodial Fathers: Tax and Transfer Programs. The Annals of the American Academy of Political and Social Science 635(1):240–261.
doi:10.1177/0002716210393869.
Nelson, T.J. (2004). Low-income Fathers. Annual Review of Sociology 30(1):427–451.
doi:10.1146/annurev.soc.29.010202.095947.
Pettit, B. (2012). Invisible Men: Mass Incarceration and the Myth of Black Progress. New York: Russell Sage Foundation.
Raley, R.K. (2001). Increasing fertility in cohabiting unions: Evidence for the second demographic transition theory in the United States? Demography 38(1):59–66.
doi:10.1353/dem.2001.0008.
Rangarajan, A. and Gleason, P. (1998). Young unwed fathers of AFDC children: do they provide support? Demography 35(2):175–186. doi:10.2307/3004050.
Rendall, M.S., Clarke, L., Peters, H.E., Ranjit, N., and Verropoulou, G. (1999). Incomplete reporting of men’s fertility in the United States and Britain: A Research Note. Demography 36(1):135–144. doi:10.2307/2648139.
Schaeffer, N.C., Seltzer, J.A., and Klawitter, K. (1991). Estimating Nonresponse and Response Bias: Resident and Nonresident Parents’ Reports about Child Support. Sociological Methods & Research 20(1):30–59. doi:10.1177/004912419102000 1002.
Selzter, J.A. and Brandreth, Y. (1994). What Fathers say about Involvement with Children after Separation. Journal of Family Issues 15(1):49–77. doi:10.1177/ 019251394015001003
Seltzer, J.A., Schaefer, N.C., and Charng, H. (1989). Family Ties after Divorce: The Relationship between Visiting and Paying Child Support. Journal of Marriage and Family 51(4):1013–1031. .doi:10.2307/353213.
Sinkewicz, M. and Garfinkel, I. (2009). Unwed Father’s Ability to Pay Child Support: New Estimates Accounting for Multiple-Partner Fertility. Demography 46(2):247–263. doi:10.1353/dem.0.0051.
Smeeding, T.M., Garfinkel, I., and Mincy, R.B. (2011). Young Disadvantaged Men: Fathers, Families, Poverty, and Policy. The Annals of the American Academy of Political and Social Sciences 635(1):6–21. doi:10.1177/0002716210394774.
Smock, P.J. and Manning, W.D. (1997). Nonresident Fathers’ Characteristics and Child Support. Journal of Marriage and Family 59(4):798–808. doi:10.2307/353783.
Sorenson, E. (1997). A National Profile of Nonresident Fathers and Their Ability to Pay Child Support. Journal of Marriage and Family 59(4):785–797. doi:10.2307/ 353782.
Sudman, S., Bradburn, N.M., and Schwarz, N. (1996). Thinking about Answers: The Application of Cognitive Processes to Survey Methodology. San Francisco: Jossey–Bass.
Teachman, J.D. (1990). Socioeconomic Resources of Parents and Award of Child Support in the United States: Some Exploratory Models. Journal of Marriage and Family 52(3):689–699. doi:10.2307/352934.
Turney, K. and Carlson, M.J. (2011). Multipartnered Fertility and Depression among Fragile Families. Journal of Marriage and Family 73(3):570–587. doi:10.1111/ j.1741-3737.2011.00828.x.
U.S. Census Bureau (2006a). Current Population Survey: Design and Methodology. Technical Paper: 66.
U.S. Census Bureau (2006b). Survey of Income and Program Participation [electronic resource]. Washington D.C.:U.S. Department of Commerce. www.census.gov/ sipp/intro.html.
U.S. Census Bureau (2012). Current Population Survey [electronic resource].Washington D.C.:U.S. Department of Commerce. www.census.gov/ cps/.
Ventura, S.J. (2009). Changing patterns of nonmarital childbearing in the United States. Hyattsville, MD: Centers for Disease Control and Prevention. NCHS data brief, (No. 18).
Appendix
Exact questionnaire wording (taken from questionnaires).
Current Population Survey
CHILD SUPPORT PAID(which followed a section on child care arrangements and costs of child care)
CSPCHILD
Does anyone in this household have any children who lived elsewhere with their other parent or guardian at any time during 2010?
1 Yes
2 No [if no, we suspect the respondent was not asked the following questions]
CSPWHO
Who had children who lived elsewhere? Anyone else?
Enter line number Enter all that apply, separate using the space bar or a comma.
CSPREQ
In 2010, (was/were) (name/you) required to pay child support?
1 Yes 2 No
CSPAMT
How much child support did (name/you) pay in 2010?
National Survey of Family Growth
{ ASKED ABOUT ALL CHILDREN
OBCLIVEX
FA-14. Please look at Card 61. Where does (CHILD) usually live now? ENTER all that apply.
If child lives with R part-time, PROBE: Where else does this child live?
In this household full-time 1 In this household part-time 2
With his/her mother 3
Away at school or college 4
Living on own 5
Living with other relatives . 6
Deceased 7
Placed for adoption or adopted 8
Placed in foster care 9
Someplace else 10
RANGE CHECK: 1,7,8,9 CANNOT BE COMBINED WITH ANY OTHER RESPONSES.
{ SET UP LOOP TO ASK ABOUT EACH CHILD
{ NEXT SERIES OF QUESTIONS ASKED ONLY IF R HAS ANY BIOLOGICAL OR ADOPTED CHILDREN AGED 18 OR YOUNGER WHO LIVE ELSEWHERE
Noncoresidential children -- Financial Support (GC)
NCMONEY
GC-1. Now I have a few questions about your financial support of (this child/these children).
In the last 12 months, that is, since (INTERVIEW MONTH, INTERVIEW YEAR - 1), did you contribute money or child support for (this child/ either of the children/any of the children)’s upbringing?
Yes 1
No 5 (GO TO SECTION H)
GC-2. Did you do this on a regular basis, or once in a while? Regular basis 1
Once in a while 2
NCAMOUNT
GC-3. In the last 12 months, how much did you give? R can report weekly, monthly, or yearly amount.
If R says that the payments are not always the same, SAY: How much do you “usually” give? OR How much did you give total?
Amount in dollars __________ ENTER “0” for none
NCAGREE
GC-4. Was any of (this/the) amount paid as the result of a child support order?
Yes 1
Survey of Income and Program Participation (which followed questions on costs of child care)
PV10
[DOES] [each person 15 or older] have any children who lived elsewhere with their other parent or guardian at any time during the past 4 months?
(1) Yes (2) No
PV12
In the past 4 months- that is, since [fill MONTH1] 1st [fill WASWERE] [fill HESHE] required to pay child support ?
INCLUDE ANY PAYMENTS... ...MADE DIRECTLY TO THE OTHER PARENT/GUARDIAN; ...MADE THROUGH A COURT OR AGENCY; OR ...WITHHELD FROM THIS PERSON'S PAYCHECK
(1) Yes (2) No
PV13