The Knowledge Economy & the Knowledge
Assessment Methodology
(The case study of Iran & Some other Countries)
Ebrahim Gorji∗ Masoomeh Alipourian∗∗
Received: 2010/12/21 Accepted: 2011/04/24
Abstract
his paper introduces a simple knowledge economy benchmarking tool, the Knowledge Assessment Methodology (KAM), which was designed by the World Bank Institute, to help countries identify problems and opportunities that they may face, and where it may need to focus policy attention or future investments, with respect to making the transition to the knowledge economy. The Knowledge Assessment Methodology based on the four pillars: education, innovation, information and communication technologies, and a conducive economic and institutional environment, which asserts that sustained investments on these pillars, will lead to sustained economic growth. Iran, on realization of the relative global position in terms of the knowledge economy, needs to develop coherent policies that place knowledge at the core of its development strategies, especially about the economic incentive regime and investment on education and innovation.
Keywords: The Knowledge Economy, The Knowledge Assessment
Methodology, The Knowledge Index, The Knowledge Economy Index.
∗ Professor, Facuallty of Economics, Universityof Tehran, (Corresponding Author).
1- Introduction
The World Bank Institute offers a formal definition of a knowledge
economy1 as one that creates, disseminates, and uses knowledge to enhance
its growth and development. A knowledge economy uses data as it raw material and transforms it using technology, analysis tools, and human
intelligence into useful applications for businesses that lead to economic
(productivity) growth. Knowledge can be obtained and trained by experience, familiarity, science or learning. Often knowledge is taken together with innovation, the commercial exploitation of knowledge. Knowledge then is the adding up of abilities (capabilities, creativity and persistency) to recognize and solve problems, by collecting, selecting and interpreting information. The knowledge economy then is the use of knowledge in interactive relations between market actors and others, while producing and using goods and services, from the first idea to final products. This definition does not focus solely on technological renewal as the goal of a knowledge economy, but on productivity and employment growth of firms. With the sustained use and creation of knowledge at the center of the economic development process, an economy essentially becomes a Knowledge Economy. A Knowledge Economy is one that utilizes knowledge as the key engine of economic growth. It has been found that the successful transition to the Knowledge Economy typically involves elements such as long-term investments in education, expanding innovation capability, modernizing the information infrastructure, and having an economic environment that is conducive to market transactions.
The paper introduces the knowledge economy framework, which holistically encompasses pillars such as education and training, innovation and technological adoption, the information infrastructure, and a conducive economic incentive and institutional regime. The framework asserts that sustained investments in these knowledge economy pillars will lead to the availability of knowledge and its effective use for economic production. This would tend to increase the growth rate of total factor productivity, and consequently result in sustained economic growth.
This paper also introduces a simple knowledge economy benchmarking tool, the Knowledge Assessment Methodology (KAM), which was developed by the World Bank Institute. The KAM is a benchmarking tool that is designed to help countries understand their strengths and weaknesses by comparing themselves with neighbors, competitors, or other countries that they may wish to emulate based on the four Knowledge Economy pillars. The knowledge assessment methodology is therefore useful for identifying problems and opportunities that a country may face, and where it may need to focus policy attention or future investments, with respect to making the transition to the knowledge economy.
This paper is organized as follows: Section1 includes literature review. Section 2 presents the 4 pillars of knowledge economy and provides a brief survey of the literature showing the importance of the knowledge economy pillars for economic growth and development. Section 3 introduces the data and the Knowledge Assessment Methodology. In section 4 we analyze the relative global position of Iran comparing to some other countries in terms of the knowledge economy. Section 5 presents the conclusion & policy implications.
2- Literature review
Knowledge has always been understood to contribute to economic growth. From Adam Smith and Karl Marx to Alfred Marshall and Joseph Schumpeter, economic thinkers have highlighted the importance of knowledge -dependent factors- such as skill, the organization of production, the development of technology and innovation- in the growth of productivity and economic development. But in recent times, the importance, scale, scope, and pace of change of knowledge in economic growth appears to have enlarged. Today, much attention is paid to a new global “knowledge economy” where information, skill and know- how is increasingly critical, if not paramount, to corporate, regional, and national economic success (Nonaka &Takeuchi, 1995; Stewart, 1997; Cooke,2002).
has been reviewed from many perspectives, resulting in slightly different denotations, each usually emphasizing a different but related aspect of the same phenomenon. Some examples of this are the “knowledge society” (Toffler, 1981), “knowhow society” (Sveiby & Lloyd, 1988), “information society” (Giddens, 1994), “information economy” (Shapiro & Varian, 2003), “learning society”, “learning economy” (Harrison & Kessels, 2004), “network society” (Castells, 1996), “intangible economy” (Andriessen, 2004a) and the “creative economy” (Florida, 2002).
The knowledge economy, in which knowledge has become the main factor of competitive advantage, is a new phenomenon. The transition to the knowledge economy is about the increase in scale of knowledge as a production factor. Knowledge is not a new production factor, but the relative importance of knowledge, related to land, labor and capital, has substantially increased during the past few decades (Castells, 1996; Weggeman, 2000).
The central wealth-creating activities will be neither the allocation of capital to productive uses, nor "labor" - the two poles of nineteenth- and twentieth-century economic theory, whether classical, Marxist, Keynesian, or neoclassical. Value is now also created by "productivity" and "innovation", both application of knowledge to work. The economic challenge of the post-capitalist society will therefore be the productivity of knowledge work and the knowledgeable worker (Drucker, 1997).
While land, labor and capital were the main factors of production in the past, knowledge - broadly defined here to include data, information, images, symbols, culture, ideology, and values - is the central resource of the production in now. Intangible assets like information have become the key resources. Information increasingly substitutes for bulk raw of materials, labor, and other resources. Given the appropriate data, information, and/or knowledge, it is possible to reduce all of the other inputs used to create wealth. The right knowledge inputs can reduce labor requirements, cut inventory, save energy, save raw materials, and reduce the time, space, and money needed for production. Knowledge is the ultimate substitute for other resources (Alvin Toffler, 1993).
mental work and a decrease in the importance of physical labor (Davidson, 1993).
The new economy is dominated by information - generating it, processing it, storing it and transmitting it. It is this information aspect that is the most valuable part of every business. The information economy is much more stable and valuable than the conventional economy (Cohen, 1993).
The formal growth in accounting evidence, historical accounts, and everyday experience all suggest that something extra, such as innovation, invention, technological change, or the discovery of new ideas is needed to understand and explain growth (Paul Romer, 1992).
Whereas Adam Smith’s Wealth of Nations depended on specialization and a division of labor within nations, the new wealth of nations depends on information, communication technology, and in-depth knowledge - on a global basis (Cordell 1994).
We do not fully understand how knowledge behaves as a resource. We have not enough experience to formulate a theory and to test it. We can only say so far that we need such a theory. We need an economic theory that puts knowledge into the center of the wealth-producing process. Such a theory alone can explain the present economy. It alone can explain innovation (Drucker, 1993).
The economy of the industrial society is initially and primarily a material economy and then changes gradually to a monetary economy. Keynes’ economic theory, for example, reflects this transformation of the economy of the industrial society into an economy reflected to a considerable extent by monetary matters. However, as more recent evidence indicates, the economy that Keynes described, now becomes a (non-monetary) symbolic economy (Nicho Stehr, 1996). Stehr then continues that the change in the structure of the economy and its dynamics are increasingly a reflection of the fact that knowledge becomes the leading dimension in the productive process, that we need to focus on the peculiar nature and function of knowledge in economic relations. Knowledge is a most peculiar entity with properties generally unlike those of commodities. In principle, a consumer or purchaser of knowledge may use it repeatedly at diminishing or even zero cost. Knowledge need not be perishable.
goods are rivalries while ideas are not. However, ideas and human capital are also significantly different. Human capital is rivalries, while ideas are not (Paul Romer, 1990).
The increased importance of knowledge as a source of production, had to be followed by a revision of the concept of productivity (Drucker, 1981; 1993).
As the productivity of knowledge will be the determining factor in the knowledge economy, the main responsibility of today’s management is to make knowledge productive. Not only the main source of production (knowledge), but also the tools of production (brains) are owned by the employees (Drucker, 1993).
The biggest challenge in the knowledge economy was the productivity of the knowledge worker. Therefore, knowledge-worker productivity to be the biggest of the 21st-century management challenges (Drucker, 1999).
The most valuable assets of a 20th-century company was its production
equipment. The most valuable asset of a21st century institution (whether
business or non- business) will be its knowledge workers and their productivity. (Drucker, 1999)
When reviewing the literature about knowledge productivity, we see two different interpretations of the concept of knowledge productivity, of which one uses knowledge as a starting point, whereas the other uses productivity as a starting point (Stam, 2007).
The different roles of the knowledge in the growth theories of the Neoclassics and the new theories
from one firm or industry to another, with new ideas used repeatedly at little extra cost. Such spillovers can ease the constraints placed on growth by scarcity of capital.
Technological change raises the relative marginal productivity of capital through education and training of the labor force, investments in research and development and the creation of new managerial structures and work organization. Analytical work on long-term economic growth shows that in
the 20th century the factor of production growing most rapidly has been
human capital, but there are no signs that this has reduced the rate of return an investment in education and training. Investments in knowledge and capabilities are characterized by increasing (rather than decreasing) returns. These findings argue for modification of neo-classical equilibrium models – which were designed to deal with the production, exchange and use of commodities – in order to analyze the production, exchange and use of knowledge.
Incorporating knowledge into standard economic production function is not an easy task, as this factor defies some fundamental economic principles, such as that of scarcity. Knowledge and information tend to be abundant; what is scarce is the capacity to use them in meaningful ways. Nor is knowledge easily transformed into the object of standard economic transactions. To buy knowledge and information is difficult because by definition information about the characteristics of what is sold is asymmetrically distributed between the seller and the buyer. Some kinds of knowledge can be easily reproduced and distributed at low cost to a broad set of users, which tends to undermine private ownership. Other kinds of knowledge cannot be transferred from one organization to another or between individuals without establishing intricate linkages in terms of network and apprenticeship relationships or investing substantial resources in the codification and transformation into information (OECD,1996).
The four pillars of Knowledge Economy
relevant communications technologies, and innovative and competitive enterprises, developing countries can capitalize on the knowledge revolution. With the sustained use and creation of knowledge at the center of the economic development process, an economy essentially becomes a Knowledge Economy. It is an economy where knowledge is acquired, created, disseminated and used effectively to enhance economic development. The successful transition to the Knowledge Economy typically involves elements such as long-term investments in education, expanding innovation capability, modernizing the information infrastructure, and having an economic environment that is conducive to market transactions. The Knowledge Economy framework asserts that investments in the four knowledge economy pillars are necessary for sustained creation, adoption, adaptation and use of knowledge in domestic economic production, which will consequently result in higher value added goods and services. This would tend to increase the probability of economic success, and hence economic development, in the current highly competitive and globalized world economy.
The four pillars of the Knowledge Economy framework are:
• An economic incentive and institutional regime
The economic and institutional regime of an economy stimulate creativity and incentives for the efficient creation, dissemination, and use of existing knowledge, and provides good economic policies and institutions that permit efficient mobilization and allocation of resources. A “knowledge-conducive” economic regime should be open to international trade and be free from various protectionist policies in order to foster competition, which in turn will encourage entrepreneurship(Sachs and Warner, 1995; and Bosworth and Collins,2003). Government expenditures and budget deficits should be sustainable, and inflation should be stable and low(Barro,1991). Domestic prices should also be largely free from controls and the exchange rate should be stable and reflect the true value of the currency. The financial system should be one that is able to allocate resources to sound investment opportunities and redeploy assets from failed enterprises to more promising ones (Levine, Loayza, & Beck, 2000).
researchers/scientists will have less incentive to create new technological knowledge and even in the event that knowledge is created, the lack of intellectual property rights protection will greatly hamper dissemination of such new knowledge (Knack & Keefer 1995; and Kaufmann, 2002, 2003).
• Educated and skilled workers
The global knowledge economy is placing new demands on labour, who need more skills and knowledge to be able to function in their lifelong. These demands requires a new model of education and training. Lifelong learning improve people’s ability to function as members of their communities, education and training increase social cohesion, reduce crime, and improve income distribution. A lifelong learning encompasses formal learning (schools, training institutions, universities), non formal learning (on-the-job and household training), and informal learning (skills learned from family members or people in the community). It allows people to access learning opportunities as they need them rather than because they have reached a certain age (TechKnowLogia org.2003).
Most empirical studies have focused on the role of human capital in economic development (Mankiw, 1992; Benhabib & Spiegel,1994; Hall & Jones,1999). Barro (1991), using cross-section data for 98 countries for the period 1960 to 1985, found that both school enrollment rates had statistically significant positive effects on growth of per capita real GDP. Cohen and Soto (2001), using cross-country time-series data on educational attainment or average years of school, find statistically significant positive effects of education on economic growth. Hanushek and Kimko (2000), using international test scores as a proxy for the quality of educational systems, find that educational quality does exert positive effects on economic growth. Jorgenson & Stiroh (2000) point out that high-skilled workers are likely complementary to ICT, while low-skilled workers are substitutable. Higher-skilled workers are more likely to be hired than low-Higher-skilled workers (The World Bank, 2006).
• An effective innovation system
creates, disseminates and uses knowledge is the one which provides an environment that nurtures research and development (R&D), which results in new goods, new processes, new knowledge, and hence is a major source of technical progress.
There are many studies that show innovation has substantial positive effects on economic growth or productivity growth. Lederman and Maloney (2003), using regressions with data panels of five-year averages between 1975 to 2000 over 53 countries, find that a one-percentage point increase in the ratio of total R&D expenditure to GDP increases the growth rate of GDP by 0.78 percentage points. Guellec and van Pottelsberghe (2001) investigated the long-term effects of various types of R&D on multifactor productivity growth using panel data for the OECD over the period 1980-98. They find that business, public and foreign R&D all have statistically significant positive effects on productivity growth. Adams (1990), using the number count of academic scientific papers of various scientific fields to proxy for the stock of knowledge, finds that technical knowledge contributed significantly to the total factor productivity growth of U.S. manufacturing
industries for the period 1953-1980. M.Squicciarini–T.Loikkanen (2008)
believe that four main elements have important roles to sustain inovation: businesses, governments, academia and the labour market:
Businesses, by investing in research, provide private capital that helps creating new and innovative products and services. Businesses also develop new business models that allow regions to thrive in the global economy. Innovation can also be improved through the development of innovation clusters that would enable small and medium sized companies to be more productive and innovative than they could be in isolation.
Universities are incubators for entrepreneurs. This must be enhanced even further to support faculty and students interested in taking ideas to the marketplace and to help produce graduates who can lead this type of activity.
Academia tends to reward people comparatively more for their academic achievements and tends to ignore those achievements that have a commercial impact.
As innovation obviously depends on good ideas and talented people, the
Labor market should be structured in such a way as to encourage and support life-long learning. The supply of a deep and wide talent pool is critical to success. The labor market certainly plays a fundamental role in ensuring opportunities for talent growth.
• A modern and adequate information infrastructure
The impact of ICTs on the economic growth can be observed by looking at the multifactor productivity factor (MPF) measurement. The productivity growth by ICTs is usually through two main channels: First, greater investment in ICT, which boosts labour productivity growth by raising the stock of capital available to each worker, and secondly, rapid productivity growth occurring in the production of ICT goods. Irene Bertschek, Fryges, & Kaiser (2004) found that MPF coefficients In OECD countries, higher in economies and more specifically in sectors with higher investments in ICTs. A series of studies show that both ICT production and ICT usage have contributed to economic growth(Pilat and Lee, 2001; Jorgenson and Stiroh ,2000; Oliner and Sichel ,2000; Whelan ,2000; and Schreyer ,2000) .Various studies have produced empirical evidence suggesting that substantial productivity gains have been experienced from ICT usage( Oliner and Sichel ,2000; and Jorgenson and Stiroh, 2000; Whelan,2000).
capabilities for work teams and individual workers. ICTs also allow more lean and timely inventory management.Moreover, with the increased flow of information, technologies can be acquired and adapted more easily again leading to increased innovation and productivity. Sheng, Nah, & Siau, (2005) categorize these benefits from ICTs to productivity as tangible and intangible. The tangible benefits include: Reduced cost , Improved productivity (i.e., amount of output produced per unit of input), Increased market share, Savings in labor , Increased consumer surplus (i.e., the accumulated difference between consumer demand and market price), Improved customer service quality, Improved organizational efficiency, Quicker response to customers, Deeper knowledge and understanding of customers.
The intangible benefits include: Improved decision-making ability,Superior product quality, Knowledge/information management and sharing, Improved coordination/relationships with partners, Other forms of competitive advantages.
In some developing countries is a considerable time lag before ICT benefits growth and productivity. The lag represents the time it takes organisations to assimilate and adjust to new technology. Also, ICTs enablers are crucial for technology to work. For example, quality of country’s business environment, as well as its attention to specific ICT enablers significantly affect its ability to harness full benefit of technology. Chandra (2007) argue that the ICTs enablers include appropriate education, skills training, research and development (R&D), access to venture capital, affordability of Internet access, security of Internet infrastructure, government support for ICT development, and quality of ICT supporting services. Thus, for ICTs to effectively enhance labor productivity, nations ought to not only invest in ICT infrastructure but also in ICT enablers if benefits from ICT are to translate into higher human resource productivity on sustainable basis.
3- The Data and the Knowledge Assessment Methodology
The Knowledge Assessment Methodology (KAM) is a benchmarking
tool that is designed to facilitate the transition to becoming a knowledge
comparing they may The know problems to focus p transition
Compa four know in the kno values, all
The Kn is as follow 1- The 2- The variable, r the top sco 10% of pe 10% gets a
3- The country re specific co is calculat Norma 4- We Turkey an and Iran a has cultur
g themselves wish to emu wledge assessm
and opportun policy attentio to the knowle arisons in the wledge econom
owledge asse l variables are nowledge As ws:
raw data (u) e 0-10 scale relatively to th
ore for the top erformers gets
allocated norm e following elation to the ountry, the nu ted:
alized (u) = 10
choose six c nd Pakistan w are members o ral similarities
with neighb ulate based o ment method nities that a c on or future edge economy
knowledge a my pillars. Be essment meth e normalized ssessment Me
is collected fr describes the he performan p performers s a normalize
malized score formula is u total number umber of cou
0
ountries to co with Iran are
of OPEC. Jap s with Iran. S
bors, competit n the four K dology is ther ountry may f investments, y.
assessment m ecause of the hodology spa from 0 (weak ethodology a
from World B e performanc nce of the rest and 0 the wo d score betwe es between 8 used to norm
of countries untries that ra
ompare with in ECO grou pan has trade Singapore as
tors, or other Knowledge Ec refore useful face, and whe with respect
methodology a variables tha an over diffe kest) to 10 (str and normaliza
Bank datasets ce of each co
of the countr orst for the lag
een 9 and 10 and 9 and so malize the sc in the sample anks lower or
Iran. Some o up (regional g relative with an Asia coun
r countries th conomy pillar for identifyin ere it may ne t to making th
are made on th at are contain erent ranges
rongest). ation procedu
(KAM 2009) ountry on ea ry sample. 10 ggards. The to
the second be on.
ores for eve e (Nc) For ea r below it (Nw
of them such group). Niger h Iran. Malays ntry, one of t
best performance in terms of the knowledge economy, among the world countries.
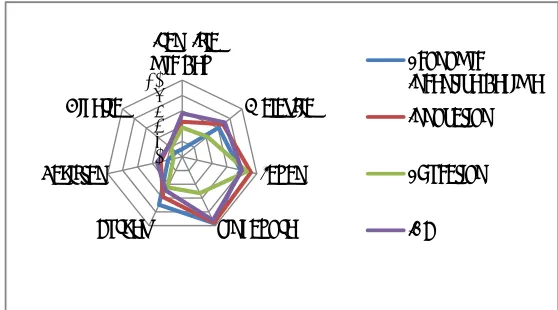
5- The Knowledge Economy Index (KEI) is an aggregate index that is calculated based on the average of the normalized performance scores of a country on all 4 pillars related to the knowledge economy - economic incentive and institutional regime, education and human resources, the innovation system and ICT. For the purposes of calculating KEI, each pillar
is represented by three key variables: The Economic Incentive and
Institutional Regime include: Tariff & Nontariff Barriers; Regulatory Quality;
Rule of Law. Education and Human Resources include: Adult Literacy Rate;
Secondary Enrollment Tertiary Enrollment. The Innovation System include:
Royalty and License Fees Payments and Receipts; Patent Applications Granted by the US Patent and Trademark Office; Scientific and Technical Journal Article.
Information and Communication Technology (ICT) include: Telephones per
Iranian Economic Review, Vol.15, No.29, Spring 2011
SOURCE: The Knowledge Assessment Methodology (KAM 2009) website (www.worldbank.org/kam).
Variable
actual normalized actual normalized actual normalized actual normalized actual normalized actual normalized actual normalized Annual GDP Growth
(%) 2 1.1 7.2 8 6 6.69 6.6 7.38 6.2 7.22 6.60 7.38 7.60 8.34
Human Development
Index 0.95 9.51 0.922 8.32 0.811 6.15 0.775 5.03 0.759 3.89 0.55 2.17 0.47 0.98 Tariff & Nontariff
Barriers 82 6.71 90 9.93 78.2 4.83 86.6 9.3 57.4 2.22 65.60 1.68 61.80 0.98 Regulatory Quality 1.05 8.08 1.87 9.79 0.53 6.64 0.23 5.82 -1.61 0.56 -0.56 2.26 -0.89 1.37 Rule of Law 1.39 8.63 1.79 9.32 0.53 6.85 0 5.82 -0.84 1.11 -0.93 1.78 -1.20 0.62 Royalty Payments
and receipts
(US$/pop) 312.33 9.24 2.544.63 9.92 46.38 7.31 4.96 4.79 n/a n/a 0.89 2.44 0.32 1.85 S&E Journal Articles
/ Mil. People 434.36 8.54 846.34 9.58 23.96 5.14 108.46 7.43 38.14 4.44 3.17 2.85 2.58 2.29 Patents Granted by
USPTO / Mil. People 284.08 9.86 104.28 9.25 4.32 8.01 0.31 5.27 0.02 2.78 0.02 3.36 0.01 2.74 Adult Literacy Rate
(% age 15 and above) 100 10 94.43 5.62 91.9 4.73 88.73 3.77 84.71 5 54.89 0.75 72.01 1.92 Gross Secondary
Enrollment rate 101.41 8.33 63.18 2.71 69.07 3.13 78.64 3.75 72.65 2.78 32.54 1.32 32.44 1.18 Gross Tertiary
Enrollment rate 58.06 7.68 55.9 7.54 30.24 4.78 36.3 5.87 31.39 6.47 5.12 1.45 10.15 2.39 Total Telephones per
1000 People 1.240.00 6.58 1.700.00 9.25 1.040.00 5.62 1.090.0
0 6.03 760 3.89 420.00 2.95 280.00 2.12 Computers per 1000
People 410 8.24 740 9.51 230 7.32 60 4.15 110 6.47 n/a n/a 10.00 1.69 Internet Users per
1000 People 690 9.18 660 8.9 560 8.49 160 4.59 320 6.67 110.00 3.84 70.00 2.88
Go
rj
i, E. &
M.
The p relatively We use the basic s
Source:
It can b very week weekend which imp quality. Ir 1.11. On internet u implying t the strong three ICT improvem Incentive R
Table 2 basic scor only aggre
erformance to the perform e the spider c scorecard spid
Figure 1:
The results of th
be seen, the p kend in many in terms of r plies that Ira ran also is ver the other han sers per 1000 that it ranks o gest pillar for T indicators. ments in ICT Regime and E 2 and Figure recard for Iran
egate perform
of Iran on mance of the r harts to comp der chart with
The Basic Sco
his study
position of Ira y of the know regulatory qu an ranks in th ry weekend in nd, it is relat 0 people wit only in the 65 r Iran, with r
In terms o pillar but h Education and e 2 present th
n and some o mance in each
the four kn rest of the cou pare among c h Iran as an ex
orecard (Spide
an in terms of wledge indicat uality with a he 5th percen n rule of law tively strong th a normaliz 5th percentile rankings abov of changes o as lost some d Human Res he Knowledg other countrie h of the four K
nowledge eco untries in sam countries. Figu
xample.
er Chart) –Ira
f the knowled tors. For exam a normalized
ntile in term w with a norm
in terms of zed value of e. The ICT pi ve the 56th p over time, I e ground for sources pillars e Assessmen es to compar Knowledge E
onomy pillar mple
ure 1 illustrat
an
dge economy, mple, it is ve
value of 0.5 s of regulato malized value computers an 6.47 and 6.6 llar is probab percentile in a
Iran has ma the Econom s.
is shown. The value for each pillar is constructed as the simple average of the normalized values of the 3 knowledge indicators that proxy for each pillar in the basic scorecard.
Table 2: T KEI Indexes (seven countries)
Countries Economic
Incentive Regime Innovation education ICT
Japan
7.81 9.22 8.67 8
Singapore 9.68 9.58 5.29 9.22
Malaysia 6.11 6.82 4.21 7.14
Turkey 6.98 5.83 4.46 4.92
Iran, Islamic
Rep. 0.99 4.56 3.8 5.65
Pakistan 1.91 2.88 1.17 3.39
Nigeria 0.99 2.29 1.83 2.23
SOURCE: The Knowledge Assessment Methodology (KAM 2009) website (www.worldbank.org/kam
Figure 2:KEI Indexes (KAM 2009) (Spider Chart) – seven countries
Source: The results of this study
0 2 4 6 8 10
Iran, Isla mic Rep.
Malaysia
Japan
Singapore Turkey
Pakistan Nigeria
Economic Incentive Regime
Innovation
Education
As it c economy above the Incentive percentile, percentile towards th Economic performan of pillars, Anothe basic scor to 9 illustr to illustra compare a As can economy ranked in incentive r between t Malaysia’ Iran is th indicators
Fig
Source:
can be seen, is very stron e 90th percen
Regime pill , while its we . It also can he knowledg c Incentive nce in terms o ranking wors er mode of th
ecards of up t rate this mode ate the Know among countr n be seen, Jap
among the c the 80th per regime pillar. the 40th and s strong point he weakest in ranking belo
gure 3: The Ba
The results of th
Singapore’s g, with all of ntile. Singap lar with its eakest is the E be said that ge economy Regime, In of the knowle se below the 2 he Knowledg to three coun e using the m wledge Asses ries, Japan, M pan is the mo countries, wit
rcentile or hi . Malaysia co d 80th perce t with all of th n terms of th w the 56th pe
asic Scorecard
his study
performance f pillars, exce pore’s strong performance Education wit Singapore ha since 1995, nnovation an edge econom 22th percentil ge Assessmen ntries to be plo most recent da ssment Metho Malaysia and Ir ost developed th all of its k igher, except omes in next w
entiles. The he indicators he knowledg ercentile.
d (Spider Char
in terms of ept Education est pillar is e ranking ab th a ranking a as made signi especially in nd ICT pill my is very we
le.
nt Methodolo otted on one c ata. We use th odology basi ran as examp d in terms of
knowledge in t for those in with its indica ICT pillar being in the 7 e economy,
rt) –Iran & Si
the knowled n, ranking we
the Econom bove the 96 around the 52 ificant progre n terms of t lars. Nigeria eekend, with a
ogy enables t chart. Figures he spider char ic scorecard
le.
the knowled ndicators bein n the econom
ators coming appears to b 71th percenti
with all of
F
Source:
Fig
Source:
Figure 4: The B
The results of th
gure 5: The B
The results of th
Basic Scoreca
his study
asic Scorecard
his study
ard (Spider Ch
d (Spider Cha
hart) –Iran &
art) –Iran & M Japan
Figure
Source:
Figur
Source:
Fig
Source:
e 6: The Basic
The results of th
e 7: The Basic
The results of th
gure 8: The B
The results of th
c Scorecard (S
his study
c Scorecard (S
his study
Basic Scorecar
his study
pider Chart) –
Spider Chart)
d (Spider Cha
–Iran, Malays
– Iran, Turke
art) –Iran & P
sia & Japan
ey & Japan
Fi Source: 4- Conclu This pa where kno introduces investmen technologi lead to in production Knowledg provide a economy, need to fo mode allo pillars of t The co and differ Singapore among cou 90th perce ranking b developme
igure 9: The B
The results of th
usion
aper presents owledge is th s the knowled nts in educa ies, and a co ncreases in n, and conse ge Assessmen a basic asses and identifie ocus more at ows me to co the knowledg omparisons ar rences acros e’s performan
untries, with entile, and Ni below the 22
ent of Iran in
Basic Scorecar
his study
the concept he main engi dge economy ation, innova nducive econ the use and equently resu nt Methodolo ssment of c es sectors or ttention for f ompare up to ge economy.
re presented i ss countries. nce in terms
all of pillars igeria’s perfo
2th percentile n terms of th
rd (Spider Ch
of the knowl ne of econom
framework, ation, inform nomic and in d creation o ult in sustain
ogy was des ountries’ rea specific area future investm
two or three
in spider char Table 2 an of the know except educa ormance is th e. Table 2 he knowledg
art) –Iran & N
edge econom mic growth. T
which asserts mation and c stitutional en of knowledge ned economic signed by W adiness for t s where polic ments. The B e countries in
rts that highli nd Figure 2 wledge econo
ation, ranking he worst, with
and Figure ge economy u
Nigeria
my, an econom The paper al s that sustain communicatio nvironment w
e in econom c growth. T World Bank,
the knowled cy makers m Basic Scoreca n terms of all
ight similariti illustrate th my is the be well above t h all of pillar
1 present t using the bas
scorecard in terms o except ICT the ICT p weakest p 9th percent knowledge 1. Knowledg (Average of 2. Knowledg of 4,5,6) 3. Economic Institutional 4. Education 5. Innovatio 6. ICT SOURCE: Th Source: plotted with of the knowl T, ranking wo pillar with its pillar is the Ec tile. It also ca e economy si
T
ge Economy Index f 3,4,5,6)
ge Index (Average
c Incentive and l Regime n on
he Knowledge Ass
The results of th
the spider ch edge econom orse below th
s performanc conomic Ince an be said tha nce 1995 (Ta
Table3: KEI a
Iran, Islami x e essment Methodol Figure10: K his study
hart. As it can my is relative
he 45th percen ce ranking th entive Regim at Iran has no able3 & Figur
nd KI Indexes
ic Rep.(most rece
3.75 4.67 0.99 3.80 4.56 5.65 logy (KAM 2009)
KEI Indexes -I
n be seen, Ira ely week, wit ntile. Iran’s str he 56th perce
e with a rank t made progr re10).
s -Iran
ent) Iran, Isl
website (www.wo
Iran
an performan th all of pilla rongest pillar
ntile, while king around t ess towards t
amic Rep. (1995)
5- Policy implications
Iran, on realization of the relative global position in terms of the knowledge economy, needs to develop coherent policies that place knowledge at the core of its development strategies as follow:
Although Iran has successfully embarked on ICT Infrastructure as an integral part of its development goals, implementation still remains a major challenge. Concerted efforts are still required to enable Iran to build efficient innovation systems, through investment in R&D, education and ICT infrastructure. Investments in capacity building and science and technology(S&T), particularly in strong innovation systems and in R&D, are necessary in a competitive environment. These investments are inevitably based on a long-term vision for the development of a country.
Human resource development is the main factor for economic prosperity and it is important that priority is accorded to investing in human capacity development. Educated and skilled human resources form human capital, that is, the skills embodied in workers. These become the most valuable assets and a central pillar in development and growth. A well-trained workforce is essential to the efficient acquisition, utilization, creation and dissemination of the relevant knowledge and skills that tend to increase productivity and economic growth.
For the knowledge economy in Iran to be successful, strengthening alliances for investment in training (formal, informal, vocational, lifelong learning, etc.) and human resource development are essential in the building of societies that are increasingly knowledge-based. The private sector is now recognized as the primary global force in S&T research and development. Funding is needed to encourage public-private partnerships and promote joint research. It is recognized that the core of research ability will be developed in higher education institutions such as universities. Thus, it is crucial for government to achieve quality S&T higher education and appropriate training mechanisms.
implies enhanced productive capabilities, which can potentially be used to fulfill a variety of human needs and realize social goals in the context of economic development. Innovation in products, processes and organizational structures is a major source of growth and is a result of numerous interactions by a community of actors and institutions.
It is also well recognized that information and knowledge economies are characterized by targeted investment in R&D. Higher levels of R&D are correlated with higher levels of economic performance and thus, the importance of R&D cannot be overlooked as economies become more knowledge-based. Countries that have taken the lead are reaping the benefits of R&D potential and accelerated innovation and taking advantage of emerging global markets.
Iran’s weakest pillar is the economic and institutional regime pillar, with all of indicators such as reduction in tariff and non tariff barriers performance, regulatory quality and rule of law. Therefore Iran needs to sustained economic and institutional regime pillar that provides incentives for the efficient use of existing knowledge, creation of new knowledge and the flourishing of entrepreneurship.
Intellectual Property Rights (IPR) regimes affect the diffusion of scientific knowledge, the innovation process and ultimately, economic performance. Patents play an increasingly important role in business strategies and the commercialization of technology. Thus, it is important for government to sustained IPR regimes.
References
1- Adams, James D. (1990). “Fundamental Stocks of Knowledge and
Productivity
2- Growth.” Journal of Political Economy. Vol. 98, No. 4, pp. 673-702
3- Andriessen, D. G. (2004). Making sense of intellectual capital.
Amsterdam: Elsevier Butterworth-Heinemann.
4- Barro, Robert J. (1991). “Economic Growth in a Cross-Section of
5- Benhabib, Jess and Mark M. Spiegel (1994). The Role of Human Capital in Economic Development: Evidence from Aggregate Cross-Country and Regional US Data.Journal of Monetary Economics. Vol. 34, pp. 143-173.
6- Bosworth, Barry and Susan M. Collins (2003). “The Empirics of Growth:
An
7- Update.” Economics of Developing Countries Paper, The Brookings
Institution .
8- Castells, M. (1996). The rise of the network society. The information age:
economy, society and culture, (Vol. 1). Cambridge, MA; Oxford, UK: Blackwell.
9- Chandra, A. (2007). Productivity Enhancement using ICT, Retrieved
February 2, 2007.
10-Cohen, Daniel and Marcelo Soto (2001). “Growth and Human Capital:
Good
11-Data, Good Results.” Technical Papers No. 179, OECD Development
Centre, September.
12-Cohen D, (1993), No Small Change: Success in Canada's New
Economy, Macmillan Canada, Toronto
13-Cooke, Philip(2002). Knowledge Economices, Routledge, London, UK.
14-Cordell A, and Thomas Ran Ide, December(1994), The New Wealth of
Nations, the Club of Rome
15-Davidson J, (1993), The Great Reckoning: Protect Yourself in the
Coming Depression, Simon & Schuster, NY
16-Drucker,P. (1999). Management challenges for the 21st century. New
York: Harper Business.
17-Drucker, P. F. (1999). Knowledge-worker productivity: the biggest
challenge. California Management Review, 41 (2), 79-94.)
18-Drucker P, (1997), Post-Capitalist, Wired 1.3 (wwww.wired.com)
19-Drucker, P. F. (1993). De post-kapitalistische maatschappij
[Post-capitalist society]. Schiedam: Scriptum.)
20-Drucker P, (1993), Needed A New Adam Smith, Forbes ASAP, 29
21-Drucker, P. F. (1981). Managing in turbulent times. London: Pan Business Management.)
22-Florida, R. (2002). The rise of the creative class. New York: Basic
Books.
23-Giddens, A. (1994). Living in a post-traditional society. In U. Beck, A.
Giddens & S. Lash (Eds.), Reflexive modernization. Politics, tradition and aesthetics in the modern sociaorder. (pp. 56-109). Cambridge: Polity Press - Blackwell.
24-Guellec, Dominique and Bruno van Pottelsberghe de la Potterie (2001).
“R&D
25-and Productivity Growth: Panel Data Analysis of 16 OECD Countries.”
STI Working Papers 2001/3. Organisation for Economic Co-operation and Development.
26-Hall, Robert E. and Charles I. Jones (1999). “Why Do Some Countries
Produce So Much More Output per Worker than Others ?” Quarterly Journal of Economics. Vol. 114, February, pp. 83-116.
27-Harrison, R., & Kessels, J. W. M. (2004). Human Resource
Development in a knowledge economy. An organisational view. New York: Palgrave Macmillan.
28-Hanushek, Eric A. and Dennis D. Kimko (2000). “Schooling,
Labor-Force
29-Quality and the Growth of Nations.” American Economic Review. Vol.
90, No. 5 (December), pp. 1184-1208.
30-Irene -Bertschek, I., Fryges, H., & Kaiser, U. (2004). B2B or Not to Be: Does B2B E-Commerce Increase Labour Productivity? Discussion Paper No. 04-45 Retrieved September 7, 2006, from
ftp://ftp.zew.de/pub/zewdocs/dp/dp0445.pdf
31-Jorgenson, Dale W. and Kevin Stiroh (2000). “Raising the Speed Limit:
U.S. Economic Growth in the Information Age.” Brookings Papers on Economic Activity. Vol. 1, pp. 125-211.
32-Kaufmann, Daniel, Aart Kraay and Pablo Zoido-Lobaton (2002).
33-Kaufmann, Daniel, Aart Kraay and Massimo Mastruzzi (2003). “Governance Matters III: Governance Indicators for 1996-2002.” Policy Research Working Paper Series. No. 3106. The World Bank. July.
34-Knack, Stephen and Philip Keefer (1995). “Institutions and Economic
35-Performance: Cross Country Tests Using Alternative Institutional
Measures.” Economics and Politics. Vol. 7, No. 3, pp. 207-227.
36-Knowledge Enterprise, Inc,(2003). website( www. TechKnowLogia.
Org)
37-Lederman, Daniel and William F. Maloney (2003). “R&D and
Development
38-Policy Research Working Paper No. 3024, The World Bank.
39-Levine, Ross, Norman Loayza and Thorsten Beck (2000). “Financial
40-Intermediation and Growth: Causality and Causes.” Journal of Monetary
Economics. Vol. 46, pp. 31-77
41-Lundvall, B. and B. Johnson (1994), “The Learning Economy”, Journal
of Industry Studies, Vol. 1, No. 2.
42-Mankiw, N. Gregory, David Romer and David N. Weil (1992). “A
Contribution to the Empirics of Economic Growth.” Quarterly Journal of Economics. Vol. 107, No. 2 (May), pp. 407-437.
43-Nonaka,Ikujiro & Takeuchi, Hirotaka.(1995).The Knowledge-Creating
Company.Oxford University Press, Oxford,UK.
44-OECD, 1996, Head of Publications Service, OECD, 2 rue André Pascal,
75775 Paris, Cedex 16, France.
45-Oliner, Stephen D. and Sichel, Daniel E. (2000). “The Resurgence of
Growth in the Late 1990s: Is Information Technology the Story?” Journal of Economic Perspectives. Vol. 14, No. 4 (Fall), pp. 3-22.
46-Pilat, Dirk and Frank C. Lee (2001). “Productivity Growth in ICT
producing and ICT-Using Industries: A Source of Growth Differentials in the OECD?” STI Working Paper 2001/4, Organisation for Economic Co-operation and Development
47-Romer P,(1992), Two Strategies for Economic development: Using
48-Romer, Paul M. (1990). “Human Capital and Growth: Theory and Evidence.” Carnegie-Rochester Conference Series on Public Policy. Vol. 32, No. 0, pp. 251-86.
49-Romer P, (1990), Endogenous Technological Change, Journal of
Political Economy, Vol. 98, No.5, pp. 71-102.
50-Romer, Paul M. (1986). “Increasing Returns and Long-Run Growth.”
Journal of Political Economy. Vol. 94, pp. 1002-37, October.
51-Sachs, Jeffrey D. and Andrew M. Warner (1995). “Economic Reform
and the
52-Process of Global Integration.” Brookings Papers on Economic
Activity. Vol. 1, (August), pp. 1-118.
53-Schreyer, Paul (2000). “The Contribution of Information and
Communication Technology to Output Growth: A Study of the G7 Countries.” STI Working Paper 2000/2, Organisation for Economic Co-operation and Development, Paris.
54-Shapiro, C., & Varian, H. R. (2003). The information economy. In J.
Hand & B. Lev (Eds.), Intangible assets. Values, measures, and risks (pp. 48-62). Oxford: Oxford University Press.
55-Sheng, H., Nah, F., & Siau, K. (2005). Strategic Implications of Mobile Technology: A Case Study Using Value-Focused Thinking: Lattanze Working Paper#WP1105.101.
56-Solow, Robert M. (1957). “Technical Change and the Aggregate
Production Function.” Review of Economics and Statistics. Vol. 39, pp. 312-320.
57-Squicciarini,M.,&Loikkanen,T.(2008).Going Global, The Challenges for
Knowledge-based Economies, Publications of the Ministry of Employment and the Economy, Innovation .
58-Stam ,C.(2007), Knowledge Productivity, Desining and Testing a
Method to Diagnous Knowledge Productivity and Plan for Enhancement, Universiteit Twente, ISBN 978-90-365-2605-0
59-Stehr N, (1996), Knowledge as a Capacity for Action, Presented to
60-Stewart, T. A. (1997). Intellectual capital. The new wealth of organizations. New York:Doubleday.
61-Sveiby, K. E., & Lloyd, T. (1988). Managing knowhow. Increase profits
by harnessing the creativity in your company. London: Bloomsbury.
62-Toffler, A. (1981). De derde golf [The third wave]. Utrecht/Antwerpen:
Veen Uitgevers.
63-Toffler A, and Heidi Toffler, (1993), War and Anti-War, Little, Brown
and Company, Toronto
64-The World Bank (2006) World Development Report: Development and
the Next Generation. Washington, D.C.: The International Bank for Reconstruction and Development / The World Bank.
65-Weggeman, M. (2000). Kennismanagement: de praktijk [Knowledge
management in practice]. Schiedam: Scriptum.
66-Whelan, Karl (2000). "Computers, Obsolescence, and Productivity."
Finance and Economics Discussion Series. 2000-6, Federal Reserve Board, Washington, DC.
67-World Bank (2009). The Knowledge Assessment Methodology (KAM)
website (www.worldbank.org/kam)
Annex 1
Knowledge codification
It can be made distinctions between different kinds of knowledge which are important in the knowledge economy: know-what, know-why, knowhow and know-who. Knowledge is a much broader concept than information, which is generally the know-what” and “know-why” components of knowledge. These are also the types of knowledge which come closest to being market commodities or economic resources to be fitted into economic production functions. Other types of knowledge – particularly know-how and know- who – are more tacit knowledge and are more difficult to codify and measure (Lundvall and Johnson, 1994).
In some complex areas, experts Know-what refers to knowledge about facts. must have a lot of this kind of knowledge in order to fulfill their jobs. Practitioners of law and medicine belong to this category.
Know-why refers to scientific knowledge of the principles and laws of nature. This kind of knowledge underlies technological development and product and process advances in most industries. The production and reproduction of know-why is often organized in specialized organizations, such as research laboratories and universities.
Know-how refers to skills or the capability to do something. Businessmen judging market prospects for a new product or a personnel manager selecting and training staff have to use their know-how. The same is true for the skilled worker operating complicated machine tools.
Know-who involves information about who knows what and who knows how to do what. It involves the formation of special social relationships which make it possible to get access to experts and use their knowledge efficiently. It is significant in economies where skills are widely dispersed because of a highly. Developed division of labor among organizations and experts