in the population sciences published by the Max Planck Institute for Demographic Research Konrad-Zuse Str. 1, D-18057 Rostock · GERMANY www.demographic-research.org
DEMOGRAPHIC RESEARCH
VOLUME 17 ARTICLE 11, PAGES 301-338
PUBLISHED 20 NOVEMBER 2007
http://www.demographic-research.org/Volumes/Vol17/11/ DOI: 10.4054/DemRes.2007.17.11
Research Article
Stochastic forecast of the population
of Poland, 2005 – 2050
Anna Matysiak
Beata Nowok
© 2007 Matysiak & Nowok
This open-access work is published under the terms of the Creative Commons Attribution NonCommercial License 2.0 Germany, which permits use, reproduction & distribution in any medium for non-commercial purposes, provided the original author(s) and source are given credit.
1 Introduction 302
2 Method 303
3 Forecast assumptions 305
3.1 Jump-off population 305
3.2 Fertility 307
3.3 Mortality 311
3.4 Net migration 316
4 Forecast results 322
4.1 Total population 322
4.2 Age structure 324
5 Sensitivity analysis 328
6 Discussion 330
7 Acknowledgements 332
References 333
Stochastic forecast of the population of Poland, 2005 – 2050
Anna Matysiak1,2
Beata Nowok3
Abstract
Forecasting the population of Poland is very challenging. Firstly, the country has been undergoing rapid demographic changes. In the 1990s, they were influenced by the political, economic, and social consequences of the collapse of the communist regime. Since 2004 they have been shaped by Poland’s entry into the European Union. Secondly, the availability of statistics for Poland on past trends is strongly limited. The resulting high uncertainty of future trends should be dealt with systematically, which is an essential part of the stochastic forecast presented in this paper. The forecast results show that with the probability of 81.8% the Polish population will decline during the next decades and Poland will face significant ageing as indicated by a rising old-age dependency-ratio. There is a probability of 50% that in 2050 the population will number between 25.7 and 36.5 million compared to 38.2 in 2004 and that there will be at least 64 persons aged 65+ per 100 persons aged 19-64.
1 The authors are listed in alphabetical order.
2 PhD candidate and Research Assistant, Institute of Statistics and Demography, Warsaw School of Economics, Warsaw. E-mail: [email protected].
1. Introduction
Ever since the beginning of the 1990s, Poland has been experiencing rapid changes in its demographic patterns. In terms of family formation, these are the postponement or even abandonment of marriage and childbearing, the spread of alternative living arrangements and rising numbers of marriages ending in divorce. As a consequence, the Period Total Female First-marriage Rate dropped from 0.90 in 1989 to 0.57 in 2004 and the Period Total Fertility Rate fell from 2.03 to 1.23. Mortality patterns in Poland have also undergone a significant change. Life expectancy has been rising since 1992 following two decades of very modest improvement and a temporary increase in mortality at the beginning of the 1990s. It increased by 4 years for women and nearly 4.5 years for men over the 1992-2004 period. The major improvement has been observed for infants. In 2004, the infant mortality rate was less than half of that in 1989. As regards international migration, the limited mobility of the past arising from political restrictions has come to an end and today migration from and to Poland is contributing significantly to the volume of international migratory flows.
The process of demographic change in Poland has surely not ended yet. Although demographers have some expectations about the direction of future population developments in this country, a lot still remains uncertain. The uncertainty is growing owing to ongoing economic transformation in Poland, its entry into the EU, and the consequences of opening the national economy to highly competitive global markets. The ageing of Poland’s population is an additional challenge. This process has already started and cannot be avoided. The higher percentage of the elderly will result in greater burdens on the working-age population in terms of financial support and care. Consequently, population ageing will affect the state of the country’s public finances and its social security system. The direction of future demographic developments in Poland may depend significantly on whether or not the system undergoes the necessary reforms and the extent to which the state adjusts to the ongoing changes. The reforms need to be carefully planned, entailing detailed calculations of their costs and benefits. Qualitative experts’ descriptions of the expected future do not suffice. Instead, a reliable population forecast is needed.
Since the beginning of the 1990s, several forecasts of the Polish population have been prepared. The most recent are a forecast of the Central Statistical Office (hereafter referred to as the CSO) for the years 2003-2030 (Bolesławski 2004), of the United Nations for the years 2005-2050 (UN 2004), and of Eurostat for the years 2005-2050 (EUROPOP2004). Each of them has three scenarios, of which one is perceived to be the
future developments in this country. The problem with this approach, however, is that no probability is attached to the scenarios. Nevertheless, for planning purposes it is crucial to know whether the given projection variant will be reached with a probability of 30%, 60% or 90% (Keilman and Pham 2004).
We deal with this problem by implementing a stochastic approach. As far as we know, this is the first time that a stochastic forecast for population of Poland is produced. Uncertainty about the future is taken into account by expressing assumptions on fertility, mortality, and migration in terms of their predictive probability distributions. This means that contrary to deterministic forecasts, we attach certain probabilities to certain scenarios. Random values from the assumed distributions for fertility, mortality, and migration are generated to produce a predictive probability distribution of population. The forecast results are presented in the form of median and prediction intervals. The forecast covers the 2005-2050 period.
The paper consists of six sections. After the introduction we provide a brief description of the method. The third section presents the concept of the jump-off population as well as forecast assumptions on fertility, mortality, and migration. Each sub-section begins with a description of the data sources available. The presentation of the forecast assumptions on vital events is accompanied by a description of their past trends and assumptions on uncertainty. Finally, our assumptions are compared to those of the CSO, UN, and Eurostat. The fourth section of the study presents the results of our forecast. Similarly to the assumptions, they are compared with the results obtained in other demographic forecasts for Poland. In the fifth section we show the impact of changes in the uncertainty assumptions on the forecast results. Finally, we summarize the paper and discuss the results referring to the condition of the Polish social security system.
2. Method
Similarly to other conventional population forecasts, the probabilistic forecast is based on the cohort-component model. The difference, however, is that instead of formulating alternative low and high scenarios, probabilistic forecasting requires the specification of prediction intervals for future age-specific vital rates and migration flows. The randomly selected rates and flows from these intervals then are used to derive the predictive distribution for the population numbers. Technically, this is achieved by running the cohort-component model several thousand of times.
Pham, and Hetland 2002). In practice, a combination of at least two of these methods is used. The first method is based on statistical models fitted to historical data. However, it tends to give excessively wide predictive distributions due to difficulties in explaining variation in past trends. Therefore, expert judgment is used to correct the resulting prediction intervals. The last method is based on the extrapolation of errors made in past forecasts. Its drawback is that for some countries the forecasts dating far back into the past either are not well documented, not available, or simply non-existent.
In order to produce a stochastic forecast for the population of Poland, we proceed as follows. Based on available data on past trends and on expert judgment we formulate point forecasts for specific fertility rates, specific mortality rates, and age-specific net migration flows. Unfortunately, an extrapolation of past trends and past forecast errors to produce the prediction intervals for Poland is not possible as long time-series and population forecasts dating far back into the past are not available. Therefore, we use an empirical specification of the error structure estimated by Alho and Spencer (2005) and the experts of the UPE project (European Commission 2005)4 for selected European countries and, when necessary, these estimates are further adjusted by expert judgments on the Polish conditions. The so-called scaled model for error (Alho and Spencer 2005) is used to approximate error structures. For each component of demographic change, uncertainty is assumed to increase with the forecast year. The uncertainty of age-specific mortality and fertility rates is treated in relative (logarithmic) terms. The scales of the model for error are constant over time. For fertility, the error increments are assumed to be uncorrelated. Therefore, the model can be interpreted as a random walk. For mortality, the autocorrelation of error increments is 0.05 and the model can be interpreted as a random walk with a random drift. The uncertainty of net migration is represented in absolute terms by using information on gross migration. The constant autocorrelation of error increments is assumed to be 0.3. As regards cross-correlation of errors across age, for fertility and mortality autoregressive (AR(1)) correlation of 0.95 is assumed. For migration dependence on age is deterministic and is given by a fixed distribution over age. Cross-correlation of errors between males and females is expected to be high. A level of 0.85 and 0.90 is applied to errors in mortality and net migration respectively. The variability of fertility, mortality, and migration is treated as independent of each other.
Thus, the future paths of the vital rates and international migration are specified by point forecasts and stochastic error terms. Using a cohort component model, 3 000 simulations are run in order to propagate uncertainty from fertility, mortality, and net
migration to the future population number. For our computations, we use the computer program PEP (Program for Error Propagation) developed by Alho (n.d.) at the University of Joensuu.
3. Forecast assumptions
3.1 Jump-off population
The jump-off population of the forecast is the Polish population as of 31 December 2004, by sex and single years of age (0, 1, 2, ..., 100+). According to the official estimates, based on the results of the last census (20 May 2002) and annual vital and migration registration data, the total population of Poland at that time amounted to 38.174 million.
The official annual population statistics in Poland suffer from serious conceptual drawbacks, however. At the national level, they capture the population permanently resident, i.e. persons registered for permanent stay in Poland. The problem with this is that there is a second type of residence, namely a temporary one. This residence should be recorded in the population register for each stay outside the permanent place of residence (in the country or abroad) exceeding two months. Thus, a person may have a temporary place of residence at the same time as having a permanent place of residence. Besides, there is no upper limit to the former. As a result, a number of people who are temporarily abroad in theory may have been living there already for a few years and they may treat the destination country as their new place of usual residence. These “emigrants” are included in the population of Poland unless they formally give up their permanent place of residence. At the same time, persons with a permanent place of residence abroad who live in Poland just temporarily are not included in the official population statistics. Foreigners who want to settle in Poland are treated as inhabitants of Poland after they have received a permanent residence permit, i.e. after having lived there without interruption for at least three years.
Thus, the concept used in the official statistics does not correspond with the internationally recommended concept of the usually resident population (see United Nations and Eurostat 1998, pp. 11-13). Note that it also differs from the definition of both the de jure and the de facto population5. Currently, Poland is an emigration country. Out-migration is usually under-registered, thus the figure for the Polish
population is larger than it would be according to the two internationally recognised concepts of population mentioned above. Another misleading factor is that the CSO labels differently defined populations with international terminology. The term de jure
is applied to the permanently resident population. The term de facto population covers also only permanent residents of Poland, but at the sub-country level, persons with both a permanent and temporary place of residence in the country are counted as de facto
residents at their temporary place of residence. Thus, in the terminology used by the CSO, at the country level the de jure and the de facto populationsare equal.
The usually resident population was estimated for the first time in the 2002 Census and it has been the only one estimation so far. The usual residents of Poland were distinguished by applying the criterion that the individuals concerned stayed in Poland for at least 12 months. This means that persons who stayed in Poland for at least 12 months were included in the resident population and persons who were staying abroad for at least 12 months were excluded from the resident population. Therefore, the last census results allow for a comparison to be made between the permanent and the usually resident population as of 20 May 2002. The discrepancy between the two population groups is about 610 000 persons (1.6% of the total permanent population of Poland). There were 22 700 persons who lived in Poland on a temporary basis for at least 12 months and 626 000 permanent residents of Poland who were absent from the country for at least 12 months. As the information on emigrants can not be collected from the emigrants themselves, the reliability of the latter figure is questionable, e.g., families who left the country are not covered. Besides, the figures for permanent and usual residents include persons who could not have been enumerated by fieldwork for various reasons unfortunately unspecified and the basic information about them was obtained from the population register. The CSO (2003) estimated that about 730 000 permanent residents were enumerated that way and the majority of them were also included in the usually resident population. The above comparison leads us to conclude that even if we ignore a possible underestimation of temporary emigration, there still is a difference between the usually and the permanently resident population.
Note that there is a strict connection between the population concept and the reliability of the vital rates, especially fertility rates. An application of the permanent residence concept causes a nominator-denominator bias. Only children born in Poland to mothers who are permanent residents of Poland are included in figures on births. Thus, children born abroad to permanent residents of Poland are not covered, but their mothers are included in the population at risk. Children born to temporary residents of Poland are not counted either.
May 2002 is not disaggregated by age and the appropriate migration data are missing. Additionally, note that the very change of the population concept from permanent, used by the CSO when producing annual population statistics, to usually resident, would not solve the existing data problem. It must be accompanied by a change in people’s attitudes towards registration rules; these are usually not adhered to, in particular by people leaving the country.
Unfortunately, even if we use statistics on the permanent population instead of statistics on the usually resident population, uncertainty surrounding the figures still remains. The population number on 31 December 2000 adjusted after the 2002 Census suggests that 390 000 permanent residents were not included compared with the data calculated by using the balancing equation of population change. The difference is tied up with undocumented migration. It covers persons who were deregistered from their permanent place of residence, but information about their new place of residence, which may be in the country or abroad, is missing, and who were not present in Poland during census enumeration. This may give raise to doubts on the reliability of the figures of 31 December 2004, although the bias should be lower as relatively short time elapsed since the last census. In addition, since the results of the post-enumeration survey are not easily accessible, we are not able to assess the quality of the census itself. In this situation, the uncertainty of the jump-off population should be taken into account in the forecast. Unfortunately, this can not be done since the current version of PEP does not allow for this source of uncertainty.
3.2 Fertility
In order to formulate fertility assumptions, we collected the time series of period age-specific fertility rates for Poland, Italy, and Spain. We had access to data on the Mediterranean countries by single age, covering the period of 1971-2000 (Spain) and 1950-2000 (Italy). The data stem from the Eurostat online database. Data collection for Poland was more complicated, requiring that we use different data sources and some interpolation procedures. A detailed description of the data sources used is presented in Table 1 in the Annex.
Before the economic transformation, Poland witnessed relatively high fertility by European standards. The TFR declined from 3 children per woman in the 1950s and oscillated around 2.2-2.3 in the 1970s and 1980s. The highest intensity of births was observed in the age group 20-24 and the mean age at childbirth was nearly 26 years at the end of the 1980s. After the fall of the communist regime, Poland experienced a major change in fertility patterns, reflected mainly in a drastic drop in fertility over the first six years of economic transformation and a further decline accompanied by a shift in birth intensities toward higher ages since the mid 1990s. As a result of these changes, the TFR decreased to 1.227 in 2004 (with the lowest value being 1.223 in 2003). In the meantime, the mean age at childbirth rose by nearly two years, to 27.9. The intensity of fertility decline in urban areas was similar to that in rural areas. Starting from the lower level, the TFR in the former dropped to 1.107 in 2003. Only in 2004 did it increase for the first time since 1989, to 1.1246. This may indicate a slight reversal of the negative trend in urban areas (implying a recuperation effect at older ages). Such a phenomenon has not been observed in rural areas so far; here the TFR is still continuously declining (1.421 in 2004).
A similar pattern of fertility decline was observed in the late 1970s and 1980s in Spain and Italy. Here, the TFR dropped from replacement level to around 1.3 within about 10 years. The downward trend continued for the next 8-10 years, at a lower intensity however, and resulting in a TFR of 1.18 in Italy (1995) and of 1.15 in Spain (1998). Since then, a slightly rising tendency has been observed and in 2004 the countries reached a TFR of 1.33 and 1.32, respectively. This process was continuously accompanied by a shift in birth intensities toward higher ages and may indicate a recuperation effect. Although the process has probably not ended yet, its magnitude seems to be weak.
Based on past trends for Poland, Spain, and Italy, we assume that the negative trend in Poland will slightly reverse. The effect will be slower in the first two years of the forecast when we expect a minor rise in urban fertility but a continuing decline in
rural fertility. After 2006, the rise in TFR will accelerate as a consequence of childbearing recuperation at older ages. Nevertheless, we do not expect this increase to be strong. In our opinion, fertility will remain low due to serious constraints to the reconciliation between work and family, an existing lack of political will to introduce reforms to family policy and to integrate these reforms with other social and employment policies as well as rising competition in the labour market. Hence, our point forecast for the TFR is 1.35 in 2030 and beyond. This development will be accompanied by a further postponement of births. Therefore, we assume that the age distribution of fertility will resemble that of Spain or Italy today. This implies that the point forecast for the mean age at birth will rise to 30.5 in 2030 and remain constant afterwards. Technically, this is achieved by lowering the fertility rates in ages below 27.9 and raising the rates in ages above 27.9, using an exponential transformation (Alho 1998). The result is presented in Figure 1.
The uncertainty of our assumptions on fertility rates is described by a probability distribution around our point forecast. The key issue at this point is the calculation of the standard deviation. We do not have access to long time-series and forecasts dating far back into the past for Poland that would allow for its computation. For this reason, we use the estimates of relative errors in naive fertility forecasts, which assumes that future fertility is equal to the current value, calculated by Alho and Spencer (2005) for six European countries (Denmark, Finland, Iceland, the Netherlands, Norway, and Sweden) over the time span beginning between 1751 and 1900 and ending in 2000. Alho and Spencer (2005) determined that the median of the relative errors closely matches the error of the random walk with volatility of 0.062. It might be arguable whether this estimate is appropriate for Poland. There are two reasons for which we claim that it is. First, the estimate by Alho and Spencer (2005) was calculated on a long time-series and not for one, but for a group of countries. Therefore it is even more robust than the one we could compute for Poland. Second, the period studied by the authors was characterized by high volatility in fertility, including both baby busts and booms. Given the long forecast period and the magnitude of change in fertility patterns over the last 15 years we have no grounds to expect that future developments in fertility in Poland will be less variable. Applying the estimates by Alho and Spencer (2005) yields 80% prediction intervals of [0.99, 1.82] in 2030 and [0.90, 2.01] in 2050. The prediction interval for 2050 is comparable to the corresponding interval of [0. 9, 2.2] obtained for both Italy and Spain in the UPE project (European Commission 2005).
Figure 2: Period total fertility rate, past and forecasted values
3.3 Mortality
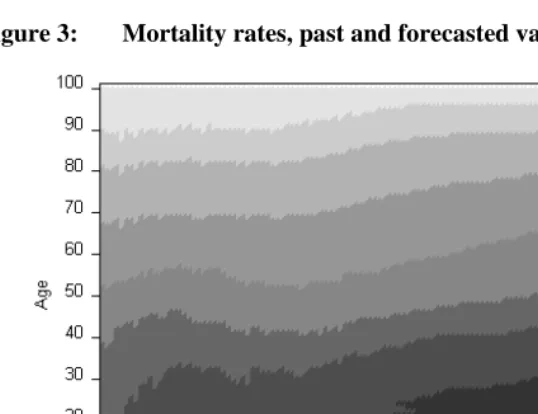
Similarly to fertility, mortality assumptions were based mainly on the observation of past trends. Detailed information on data sources and procedures used for calculating the required indicators is provided in Table 2 in the Annex. As a final outcome, we had at our disposal period age-specific mortality rates by sex for the 1950-2004 period. This indicator for ages up to 100, however, was available only for the 1971-2004 period (earlier data covered ages 0-80). Moreover, the data on old-age mortality turned out to be relatively volatile for both women and men, irrespective of the data source used. For this reason, we replaced the old-age mortality rates by a linear extrapolation of the logarithm of mortality rates for ages 30-79. This resulted in mortality rate of 0.411 for women and 0.477 for men at age 100.
61.7 to 70.6 for women. A rising tendency, although much weaker, was also observed in the 1960s. In the next two decades, the improvement came to a halt. While for women, life expectancy at birth increased by less than 2 years during this period, there was nearly no change for men. What is more, one even observed some temporary ups and downs in male life expectancy. These developments contributed to a further increase in the gender gap in mortality that was already widening in the 1960s (the gap in life expectancy grew from 5.6 years in 1960 to 8.7 in 1989). The fall of state socialism is marked by a sudden rise in mortality for all age groups. This phenomenon was, however, only a temporary one and since 1992 a continuous fall in mortality has been observed. As a result, female life expectancy increased by nearly 4 years (to 79.2 in 2004) and that for men rose by 4.5 years (to 70.7 in 2004) compared to 1991. The improvement in mortality was strongest for infants. The infant mortality rate in 2004 was less than half of that in 1989.
Given the trends described above, we expect that the improvement in mortality observed since 1992 will continue in the future. With time, however, the rates of decline will weaken, converging to those observed in the most developed countries of Europe. The slowdown in mortality improvement can be explained by the fact that the sudden drop in mortality during the 1992-2004 period was most probably the result of a rapid increase in living standards and the spread of a healthy life style. This trend will continue for some time as Poland’s level of economic development will converge to the EU average. In our opinion there is, however, no reason to believe that in the long term life expectancy in Poland will increase faster than it has been observed so far in the most developed countries in Europe.
Figure 3: Mortality rates, past and forecasted values, males
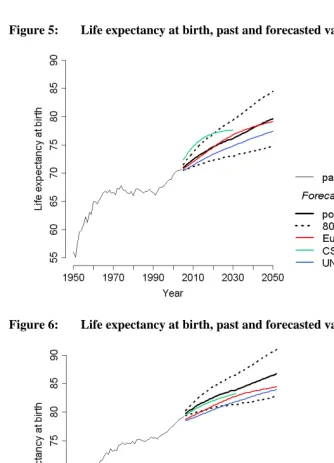
Figure 5: Life expectancy at birth, past and forecasted values, males
The magnitude of uncertainty as to the future mortality patterns is presented in form of 80% prediction intervals around the point forecast of the life expectancy derived from our assumptions on age-specific mortality rates. For men, this interval will be [73.0, 79.4] in 2030 and [74.8, 84.5] in 2050; for women it will be [81.3, 86.6] and [82.7, 91.0] (see Figures 5 and 6). In terms of the point forecast, this implies a rise in male life expectancy by 5.4 years until 2030 compared to e0 in 2004 and a climb by further 3.5 years until 2050 (which gives e0 of 76.1 in 2030 and 79.6 in 2050). The improvements will be slightly lower for women: the point forecast increases by 4.7 years by 2030 and another 2.8 years by 2050 (i.e. to the level of 83.9 and 86.7 respectively). This will contribute to a slight narrowing in the gender gap in life expectancy by 1.5 years (to 7 years).
A comparison of our assumptions on life expectancy with the assumptions of other available forecasts shows that our prediction intervals for men generally cover the most likely scenarios predicted by the UN and Eurostat, with the latter being closest to our point forecast. According to our probabilistic model, the institutions underestimate the life expectancy for men in 2050 with a probability of 73.6% and 55.4% respectively. The CSO predicts a much stronger rise in male life expectancy in the first decade, but thenafter the growth slows down and after 2020 the assumed e0 is also covered by our prediction interval. Again, according to our model the male life expectancy in 2030 is underestimated by the CSO with probability of 27.0%.
Contrary to our assumptions on male life expectancy, the assumptions on female life expectancy are more optimistic than those made by the UN and Eurostat. The values predicted by these institutions, particularly the UN, are covered by the lowest parts of our 80% prediction intervals. The CSO forecast on female life expectancy is closest to our point forecast. According to our stochastic model, the probabilities of underestimating the female life expectancy are: 77.2% (Eurostat in 2050), 80.7% (UN in 2050), and 63.6% (the CSO in 2030).
3.4 Net migration
Official Polish statistics on international immigration and emigration flows cover permanent migration only. Permanent is understood literally, i.e. it refers to declared infinite duration of stay (for more details on the applied concept see Nowok forthcoming). The statistics available at the time of preparing the forecast (until reference year 2004) were produced on the basis of registration and deregistration forms that are filled out in the municipality when reporting a change in the place of permanent residence. Usually, however, people do not report their departure abroad. Thus, emigration is not covered in full and this is reflected in the population number obtained from the census count. The underestimation of Polish migration data is also evident when compared to the statistics reported by the EU countries that have a migration exchange with Poland (hereinafter referred to as partner countries) (Kupiszewska and Nowok forthcoming). However, note that these discrepancies largely result from differences in the definition of migration and migrants.
partner countries for which data were available (Germany, the Netherlands, Spain, and Sweden), their positive migration balance with Poland on average doubled. Polish data showed an opposite trend, i.e. an increase in net migration compared to the previous year. The adjustment was introduced on the basis of the assumption that the bias of net migration data is connected mainly to the emigration component and thereby to the migration exchange with the destination countries of migrants from Poland.
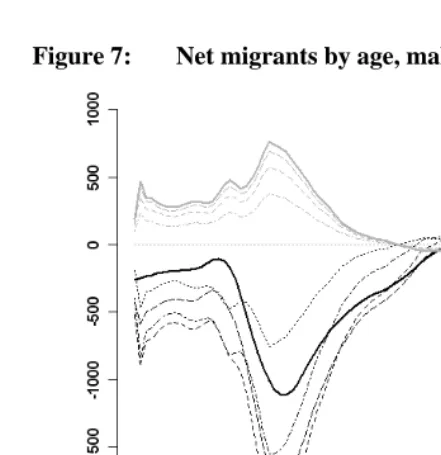
The age pattern of both immigration and emigration obtained from the Polish statistics (2004, by single age, and 1999-2003 by 5 year age groups, interpolated by the Karup-King method) was unrealistic, and this additionally lowers the quality of the Polish data on international migration flows. Therefore, the initial age pattern of net migration was derived on the basis of data on immigration and emigration by the country of previous and next residence respectively produced by the main partner countries. The average of the age pattern of the migration exchange with the following countries in 2004 was used: Germany, Austria, the Netherlands, Italy, Spain, and Sweden. However, starting from age 80, zero migration was assumed.
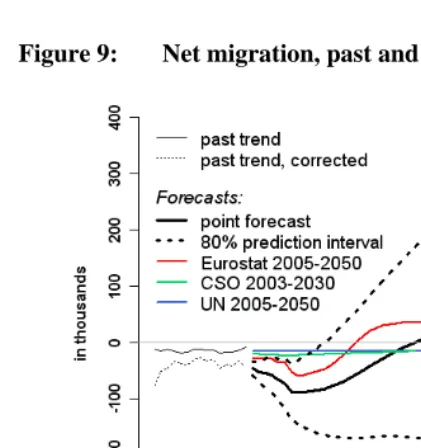
The low reliability of the statistics on international migration flows available for Poland hinders an analysis of historical trends. However, some general and characteristic features can be distinguished. During the pre-transition period (1950-1988), the population movement was constrained by political factors and responded to fluctuating restrictions. Migration reached a significant level only in some exceptional cases and only specific categories of migrants were involved, e.g. ethnic Germans and Polish Jews. The sudden increase in migration outflow took place after the collapse of state socialism in 1989, when people started to move abroad freely. Following a period of high intensity of migratory movements, net migration was rather stable and oscillated between -14 000 and -20 000 (-28 000 and -46 000 after our correction), with the minimum level reached in 2000, most probably connected to the deterioration of the economic situation in Poland.
uncontrolled inflow of cheap labour, in particular from Poland and the Czech Republic, for as long as possible. A similar decision was taken by Austria. For the other countries we have to make arbitrary assumptions on the date of opening their labour markets, based on the prevailing attitudes to foreign labour in these states. Thus, we assume that in 2009 all other countries except France will abandon the transition period. Besides, we assume that the removal of restrictions will result in a temporary increase in out-migration, in particular when Germany, currently the main destination country of Polish emigrants, opens its labour market. In general, we are of the opinion that Poland will follow the footsteps of Portugal and Ireland following their entry into the EU. This analogy is build on the basis of similarities in terms of an economic gap between the new Member State and the “old” EU. Therefore, net migration in Poland will first drop due to the dominating outflow to more affluent countries that have opened their labour markets. A minimum level of -88 500 will be reached in 2011 and 2012, i.e. in the years directly following the transition period for the free movement of workers. At the same time, the gradual improvement in the economic situation and the increasing relative attractiveness of Poland will result in an inflow of migrants, especially from the former Soviet Union countries. The immigration flow will then take precedence and in the long run Poland will become an immigration country. We assume that this will happen around 2025. In 2050, a level of 30 000 net migrants will be reached.
Figure 7: Net migrants by age, males
All of our assumptions are based on a judgmental view. Therefore, the uncertainty surrounding future net migration in Poland is of great importance. The unpredictable pace of future economic development in Poland, dependency on the EU-15 countries’ decisions on access to their labour markets and the poor quality of Polish statistics on international migration suggest that the uncertainty is higher than in the most of the countries studied in the UPE project (see Table 10 in European Commission 2005). We assume that in terms of uncertainty of net migration Poland is comparable to Greece and Portugal, for which the highest standard deviation per thousand of the jump-off population was set (6‰ at the end of the forecast period). For the latter two states, as for Poland, the data situation is known to be very problematic (Breem and Thierry 2006, Cantisani and Greco 2006). In addition, in both Greece and Portugal past development of net migration was relatively volatile. Thus, we have no grounds to claim than the future net migration in Poland will be less or more uncertain. Therefore we assume the standard deviation of net migration at the end of the forecast period to be 6‰ of the jump-off population. As a result the 80% prediction interval in 2050 is [-263 530; 323 530]. The interval for all forecast years is presented in Figure 9. The corresponding 80% prediction interval for the cumulative net migration during the whole forecast period is [8 304 000; 6 286 000]. It is symmetric around the median of -1 009 000. The probability that the net impact of international migration on population number of Poland until 2050 will be positive is equal to 43%.
The future overall trend of net migration is very similar to that assumed by Eurostat in its projection, but the discrepancies still persist. They refer to the minimum level of net migration reached before the trend changes (-59 000 in the baseline Eurostat scenario compared to our point forecast of -88 500) and the pace of the increasing trend. The target levels of net migration in 2050 are very close to each other. The differences in the net migration level result to some extent from differences in the figure for the jump-off net migration, since the correction introduced by us is larger than that applied by Eurostat. However, since 2008 the base variant of the Eurostat projection is within the 80% prediction interval of our forecast.
Figure 9: Net migration, past and forecasted values
4. Forecast results
4.1 Total population
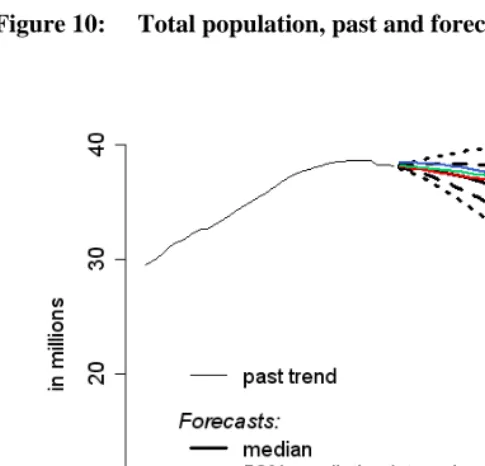
Figure 10 contains the median, first and third quartiles, and first and ninth deciles of the predictive distribution of the population of Poland until 2050. It is clear that the Polish population is most likely to decline from the current 38.2 million to 35.2 million in 2030 and to 31.2 million in 2050, as indicated by the median. This downward trend will be observed from the beginning of the forecast period. The 50% prediction interval places the Polish population between [32.3, 37.8] million in 2030 and [25.7, 36.5] million in 2050. The 80% prediction interval is much wider, it ranges from the very low values of 29.8 to 40.4 in 2030 and from 21.0 million to 41.6 million in 2050. Hence, with a probability of 18.2% the Polish population in 2050 will be higher than in 2004.
The CSO predicts the total Polish population to be 35.9 million in 2030, which is about 0.7 million higher than the median in our forecast. Since our point forecast on fertility places the TFR at a higher level than in the forecast by the CSO and since the assumptions on mortality for 2030 are quite similar, this difference results from different assumptions on migration. Indeed, in our point forecasts we definitely expect a much higher out-migration than the CSO does. The probability, calculated based on our stochastic model, that the CSO overestimates the population number in 2030 is 57.2%.
Figure 10: Total population, past and forecasted values
Note: The total population forecasted by the UN is predicted on 1 July each year
The UN medium scenario yields the highest differences in comparison to our point forecast in the first forecast years, until around 2030. This gap results probably from higher assumptions on fertility and lower out-migration. Thenafter the difference decreases but still the population is predicted to be 31.9 million in 2050, that is by 0.7 million higher than in our point forecast. According to our probabilistic model the population in 2050 is overestimated with a probability of 53.1%.
4.2 Age structure
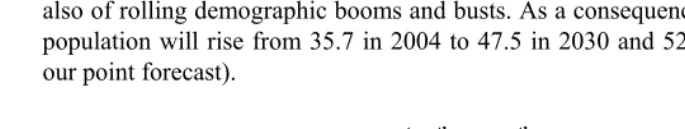
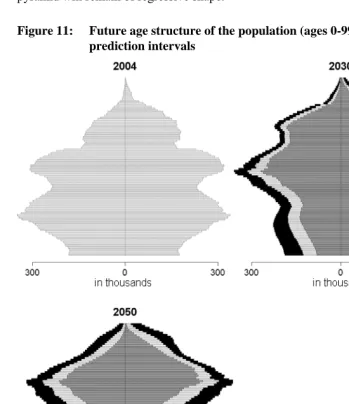
Along with the decline in its total population, Poland will face rapid population ageing. This process will not only be the result of low fertility and rising life expectancy but also of rolling demographic booms and busts. As a consequence, the median age of the population will rise from 35.7 in 2004 to 47.5 in 2030 and 52.9 in 2050 (according to our point forecast).
Table 1: Median age of the 1st, 5th and 9th decile of the forecasted population
1st decile 5th decile 9th decile
2004 2030 2050 - 49.8 59.7 35.7 47.5 52.9 - 45.5 48.0
age structure of the population is as indicated by the ninth decile of the forecast, the age pyramid will remain of regressive shape.
Figure 11: Future age structure of the population (ages 0-99), median and 80%
prediction intervals
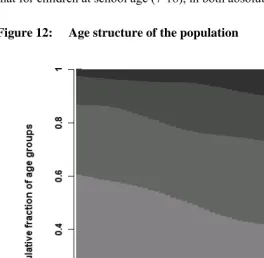
The process of population ageing is reflected also in a detailed analysis of population composition by age (see Figure 12). The main absolute changes in the population share refer to people aged 65-79 and at mobile productive age (19-44). The fraction of the former increases by 11.9 percentage points (from 10.6% up to 22.5%) and that of the latter decreases by 11.4% percentage points (from 38.4% down to 27%). The most substantial relative change in the share takes place in the oldest-old age group (80+), which grows nearly fourfold. As a result, the fraction of the combined group of the elderly (65+) increases from 13.3% to 33.2%. Due to the assumed eventual rise in fertility rates, the decline in the share of children aged 0-6 is relatively small, lower than that for children at school age (7-18), in both absolute and relative terms.
Figure 12: Age structure of the population
(19-64). However, one needs to take into account that this measure does not reflect the exact burden placed by the dependant elderly on the working population due to variations in employment participation and eligibility to social benefits. The dynamics of the OADR presented in Figure 13 (median with an 80% prediction interval) reflect clearly a dramatic process of population ageing, which is connected with a substantial increase in the financial burden posed on the working age population.
Figure 13: Old-age dependency ratio (OADR), past and forecasted values
5. Sensitivity analysis
While formulating the uncertainty assumptions on vital rates and migration flows we used the estimates by Alho and Spencer (2005) and the experts involved in the UPE project (European Commission 2005). If these assumptions are not appropriate for Poland our forecasted population numbers and related probabilities are incorrect. Therefore, in order to assess the possible specification error we conducted a sensitivity analysis. The initial uncertainty parameters were increased and decreased by 10, 20, and 30% separately for fertility, mortality, and net migration. The resulting total population numbers were compared with total population numbers obtained using the basic parameters.
Figure 14: Total population, various uncertainty of fertility (a), mortality (b),
The sensitivity analysis revealed a negligible impact of changes in relative errors of mortality on forecasted population size (see Figure 14b). In the case of fertility, modification of uncertainty assumptions resulted in a small but visible change in the ninth decile of the predictive distribution of the total population (see Figure 14a). Relative to the results obtained using the basic uncertainty parameters in 2050 its value increased by1.2million when the relative error was enlarged by 30% and decreased by 0.8 million when the relative error was reduced by 30%. The lower 80% prediction interval of the total population changed negligibly. The change in the upper interval values and no change in the lower interval values is to be explained by a threefold difference in the number of women aged 15-49 between the intervals. Contrary to fertility and mortality the forecast results are quite sensitive to the changes in net migration uncertainty, both at the lower and upper 80% prediction interval (see Figure 14c). After increasing the standard deviation of net migration at the end of the forecast period (per thousand of the jump-off population) by 30%, the 80% prediction interval for total population in 2050 became by 5.3 million wider than the prediction interval obtained using the basic assumptions on uncertainty. Furthermore, the population size at the ninth decile of this enlarged predictive distribution is almost impossible to be reached under the assumption of low uncertainty of future net migration flows.
Based on the results of the sensitivity analysis we conclude that the results of our forecast are robust as regards the effects of fertility and mortality on total population numbers. This is not as much the case as regards international migration. Taking into account the low quality of the Polish migration data and the high uncertainty on the future migration flows it is, however, hardly possible to produce an adequate migration forecast.
6. Discussion
makers should be aware of it and take appropriate measures. Although Poland has already made a big step forward reforming the non-agricultural old-age pension scheme, there are still some elements of the social security system that require changes.
The reform of the non-agricultural old-age pension system took place in 1999. The previous “pay-as-you-go” system has been gradually replaced by a new one, entirely based on individual retirement accounts. The pension formula in the new system depends on the accumulated capital and life expectancy at the time of retirement. Hence, the system is actuarially neutral (it does not generate debt exceeding that which it can finance without the necessity of raising contributions) and creates incentives to delay withdrawal from the labour market (Góra 2005). Furthermore, in parallel to the introduction of the new system, the law limiting the early retirement privileges was passed. Altogether, the reforms are expected to lower the expenditures on old-age pensions. According to the projections carried out by the Ageing Working Group of the Economic Policy Committee the expenditures on the public and private mandatory old-age and early pensions will fall from the current relatively high level of 10.1% to 7.9% of GDP in 2050, which will be one of the lowest levels in EU-25 (Economic Policy Committee and European Commission 2006). Note, however, that recently some amendments to the legislation on non-agricultural old-age pension system have been adopted that indicate a step backwards. They loosen the restrictions on early retirement, delaying the complete revocation of early retirement and granting early retirement privileges to some occupational groups.
in expenditures, if compared to other EU countries (by 0.9-1.7 for health care and 0-0.2 for long-term care depending on the scenario assumptions) (Economic Policy Committee and European Commission 2006). However, apart from the level of spending, one has to take into account the relation between the demand and supply. Currently, formal care for the elderly is hardly available and care is to a large extent provided by family members, hindering the labour force participation of women (Wóycicka and Rurarz 2007). Taking into account the expected upward trend in the share of the oldest-old, the declining propensity to form multi-person households (Abramowska 2005) and the necessity to increase the currently low female employment, a discussion on the development of long-term care is required.
In sum, a comprehensive redesign of the old-age pension system in Poland was an important step to safeguard the future economic, budgetary, and social consequences of population ageing. The response to the demographic challenge has still, however, to be completed. Considerable improvements need to be made to other parts of the social security system. These include disability, health-care, long-term care, and agricultural pension scheme. Moreover, an additional challenge is posed by the difficult labour market situation. The employment rates are exceptionally low, especially among the young and people at pre-retirement age. As revealed in this study, a further advancement in population ageing is inevitable, thus the government will have to tackle these problems. Furthermore, it will also have to face the problem of availability and quality of demographic statistics in Poland.
7. Acknowledgements
References
Abramowska, A. (2005). Projekcja liczby osób starszych wymagających opieki w Polsce. Internal Research Report. Warsaw: Warsaw School of Economics, Institute for Statistics and Demography.
Alho, J. (1998). Stochastic Forecast of the Lithuanian Population 2001-2050. Research Report P98-1023-R. Joensuu: University of Joensuu, Department of Statistics. Alho, J., and B. Spencer (2005). Statistical Demography and Forecasting. New York:
Springer Science + Business Media.
Alho, J. (n.d.) PEP – Program for Error Propagation (tutorial). Retrieved April 4, 2006, from http://joyx.joensuu.fi/~ek/pep/userpep.htm
Bolesławski, L. (2004). Demographic projection of Poland 2003-2030. Warsaw: Central Statistical Office.
Breem, Y. and X. Thierry (2006). Country report: Portugal. In M. Poulain, N. Perrin, and A. Singleton (Eds.), THESIM: Towards Harmonised European Statistics on International Migration (pp. 591-598). Louvain-la-Neuve: Presses universitaires de Louvain.
Cantisani, G. and V. Greco (2006). Country report: Greece. In M. Poulain, N. Perrin, and A. Singleton (Eds.), THESIM: Towards Harmonised European Statistics on International Migration (pp. 437-446). Louvain-la-Neuve: Presses universitaires de Louvain.
Central Statistical Office, Population Indicators Database, http://www.stat.gov.pl/ dane_spol-gosp/ludnosc/index.htm
Central Statistical Office (2003). Migracje zagraniczne ludności 2002. Warsaw: Central Statistical Office.
Council of Europe (2005). Recent demographic developments in Europe 2004. Strasbourg: Council of Europe Publishing.
European Commission (2005). Changing Population of Europe: Uncertain Future, UPE (final project report). Luxembourg: Office for Official Publications of the EC.
Eurostat, online database (Population/Social conditions, Population, Population projections), http://europa.eu.int/comm/eurostat/
Eurostat (2005). EU25 population rises until 2025, then falls. Eurostat press release 448/2005 of 8 April 2005.
Góra, M. (2005). Pension expenditure as the part of GDP: Social security vs. economic growth. Discussion Paper No.265. Project on Intergenerational Equity. Hitotsubashi: Institute of Economic Research, Hitotsubashi University.
Kannisto-Thatcher Database on Old Age Mortality (n.d.). Max Planck Institute for Demographic Research. Retrieved April 4, 2006, from http://www.demogr. mpg.de/
Keilman, N., D. Q. Pham, and A. Hetland (2002). Why population forecasts should be probabilistic – illustrated by the case of Norway. Demographic Research, 6(15), 409-454.
Keilman, N., and D. Q. Pham (2004). Empirical errors and predicted errors in fertility, mortality and migration forecast in the European Economic Area, Discussion Paper No 386, Statistics Norway, Social and Demographic Research.
Kotowska, I. E., A. Matysiak, M. Muszyńska, and A. Abramowska (2005). Work and Parenthood. Comparative Report and Summary Policy Implications. Research report for the European Commission prepared within the DIALOG Project, Work package: Work and Parenthood.
Kupiszewska, D., and B. Nowok (forthcoming). Comparability of statistics on international migration flows in the European Union. In J. Raymer, and F. Willekens (Eds.), The estimation of international migration in Europe: Data, models and estimates. Chichester: Wiley.
Marciniak, G. (1999). Symulacje zmian wzorca płodności do 2005r. Studia Demograficzne, 2(136).
Muszyńska, M. (2005). Structural and cultural determinants of fertility in Europe. PhD thesis. Warsaw: Warsaw School of Economics, Institute of Statistics and Demography.
estimation of international migration in Europe: Data, models and estimates. Chichester: Wiley.
OECD (2003). Transforming Disability into Ability. Policies Promoting Work and Income Security for Disabled People. Paris: OECD.
Oeppen, J., and J. W. Vaupel (2002). Broken limits to life expectancy. Science, 296(5570), 1029-1031.
Olshansky, S. J., B. A. Carnes, and C. Cassel (1990). In search of Methuselah: Estimating the upper limits to human longevity. Science, 250(4981), 634-640. Shryock, H. S., and J. S. Siegel (1976). The methods and materials of demography.
New York: Academic Press.
UPE (2004). A forecast of the population of Europe 2004-2050, http://www.stat.fi/ tup/euupe/
United Nations and Eurostat (1998). Recommendations for the 2000 censuses of population and housing in the ECE region. Statistical Standards and Studies No. 49. New York and Geneva: United Nations.
United Nations (2004).World Population Prospects: The 2004 Revision Database, http://esa.un.org/unpp/
Vaupel, J.W. (2005). The biodemography of aging. In L. W. Waite (Ed.), Aging, health, and public policy: demographic and economic perspectives (pp.48-62). New York: Population Council. (Supplement: Population and Development Review, 30, 2004).
Annex
Table 1: Data sources for fertility indicators for Poland
Indicator Period Data source Notes
Period Total Fertility Rate (TFR)
1960-1994 Council of Europe
1995-2004 Eurostat online database
Mean age at childbirth 1960-1994 Council of Europe
1995-2004 Eurostat online database
Period age-specific fertility rates (in completed ages*)
1971-1989 Council of Europe 5-year age groups
reconstructed into single ages, using gamma distribution (see Marciniak 1999)
1990-1996 Central Statistical Office of Poland
calculated from annual number of births and total population
1997-2004 Eurostat online database
single ages
Table 2: Data sources for mortality indicators for Poland
Indicator Period Data source Notes
Age-specific mortality rates (in reached ages)
1950-1989 Central Statistical Office of Poland
probabilities of dying for ages 0-80 (in 5-year age groups) converted into age-specific mortality rates and interpolated into single ages by Karup-King method (Shryock and Siegel 1976)
1990-2004 Eurostat online database
calculated from annual number of deaths and total population
1971-2004 Kannisto-Thatcher Database
for ages 80+ (in single ages)