I J H S
IJHS 2015;1(3):1-6ijhs.shmu.ac.ir doi: 10.22100/ijhs.v1i3.75
Original Article
International Journal of Health Studies
Characterization of Odorous Gaseous Emissions from a Rendering Plant by GC-MS and
Evaluate the Performance of Existing Refiners
Ghasem Hesam1, Sajjad Farhadi2, Mohammad Hossein Ebrahimi1, Mahdi Jalali3, Zahra Moradpour1*
1 Dept. of Occupational Health Engineering, Occupational and Environmental Health Research Center, School of Public Health, Shahroud University of Medical Sciences, Shahroud, Iran. 2 Dept. of Occupational Health Engineering, School of Public Health, Hamadan University of Medical Sciences, Hamadan, Iran.
3 Dept. of Occupational Health Engineering, Social Determinants of Health Research Center, Birjand University of Medical Sciences, Birjand, Iran.
Received: 18 January 2015 Accepted: 16 February 2015
Abstract
Background: Among the industrial activities that may cause odor nuisance problems, baking waste one is of the sources of bad odor, and therefore individuals complain from the industry. The aim of this study was to evaluation of pollutants released from poultry rendering plant and also performance of existing refiners in removing these pollutants.
Methods: In this study, 66 air samples were collected from air pollution sources, environmental and worker's breathing zone using absorbent activated carbon and silica gel at two slaughterhouses in North and West of Iran. The samples were analyzed by GC-MS, and then efficiency of the three refiners condenser, thermal oxidation and water tank had been determined.
Results: Overall, 56 chemical pollutants in the slaughterhouse A and 41 chemical pollutants in the slaughterhouse B had been identified. These compounds were included hydrocarbons, aldehydes, ketones, alcohols, ethers, halogenated compounds, sulfur compounds, nitrogen compounds, acids and hormones. Condenser efficiency was 38 to 100%. Thermal oxidation efficiency was 15.41 to 100% and the efficiency of the water tank was 8.93 to 100%.
Conclusions: Occupational exposure to pyridine and carbon disulfide, in the slaughterhouse A, and carbon disulfide in the slaughterhouse B, was excessive. The concentrations of toluene, carbon disulfide and pyridine in the slaughterhouse A and concentrations of toluene, carbon disulfide and acetone in a slaughterhouse B was much more than the threshold of smell. Results showed that the combination of condenser and thermal oxidation, could remove large volumes of gases emitted.
Keywords: Rendering plant, GC-MS, Condenser, Thermal oxidation, Water tank.
*Corresponding to: Z Moradpour, Email: zm.moradpoor1989@ yahoo.com
Please cite this paper as: Hesam Gh, Farhadi S, Ebrahimi MH, Jalali M Moradpour Z. Characterization of odorous gaseous emissions from a rendering plant by GC-MS and evaluate the performance of existing refiners. Int J Health Stud 2015;1(3):1-6.
I
ntroduction
One of the main characteristics of the rendering plant is one of the main characteristics of the rendering plant is the diffusion of volatile organic compounds that causes an unpleasant odor, which may be a nuisance to workers and residents residing near this industry.1 In a rendering plant, poultry slaughterhouse organic waste, which consists of offal, dead poultry, poultry products, and others, can be converted into valuable products, such as animal feed and fertilizer. In this unit, feathers can be hydrolyzed, usually at a temperature of 140°C-150°C and at a pressure of 276-345 kPa for 20-45 min, to break down the creatinine, which can then be combined with offal and water vapor at a temperature of 121°C–135°C
under a pressure of 172-517 kPa for cooking. In both these steps, volatile organic compounds (VOCs) are produced, some of which have an unpleasant odor.2,3
The investigation showed that the organic waste processing of slaughter not only emits an unpleasant odor but also causes the spread of contaminants that are very dangerous. In order to avoid the scatter of these contaminants in the surrounding atmosphere and to make a suitable environment, the development of treatment technology is required.4 Refiners that are used for this process can refer to the carbon filtration for low gas concentrations and thermal oxidation and catalytic reactions for medium and relatively high gas concentrations, and chemical scrubbers and bio filters for high concentrations.5
Odorous compounds that have been identified in gaseous emissions from rendering plants include hydrogen sulfide, ammonia, organic sulfides, disulfides, mercaptans, aldehydes (especially C-4-C-7 aldehydes), amines, quinoline, dimethyl pyrazine, other pyrazines, indole, skatole, and C-3-C-6 organic acids. In addition, lesser amounts of C-4-C-7 alcohols, ketones, aliphatic hydrocarbons, and aromatic compounds are potentially emitted.1,2,5
Dincer et al. (2006) reported the diffused contaminants of animal rendering plants in 49 volatile organic compounds, including alkanes, alkenes, carbonyls, arenes, chlorinated and other halogenated compounds, organic chlorides, and volatile fatty acids.6 Kastner and Das (2002 and 2005), however, reported that the efficiency of wet scrubbers and biofilters in the removal of VOC diffusions of animal rendering plants was 23%-64% and 40%-100%. System analysis in this study was GC-MS.2,3 Anet et al. (2013) also reported that the pollutant removal by biofilter according to the types of packing materials for biofiltration was 75%-93%.7
poultry rendering plant and evaluate the performance of existing refiners in removing these pollutants.
Materials and Methods
Studies on poultry slaughterhouses are based on two cities in the North and West of Iran. The capacity of each slaughterhouse is 28,000 pieces/day. This collection includes the slaughter, packaging, refrigeration, sewage treatment, and the rendering plant. The capacity of the rendering plant is 10 tons/day, and in North, it is called rendering plant A, whereas in the West, it is called rendering plant B. The rendering plant is the main source of odor emission in this collection.
Sampling of rendering plant A was completed in June 2013 at a temperature of 24°C and humidity of 67%. In this unit, the pollutant emissions from the cooker entered the cyclone by the channel to remove particles from the air stream. Overhead vapors from the feather hydrolyzer and driers are passed through condensers to remove some VOCs. The non-condensable gases typically are passed through thermal oxidation units to remove the VOC fraction not removed in the condensers. Flow condenser inlet was 4400 m3/hr. Condenser size was 2.3 m3 and the inlet water flow was 6 L/min with a temperature of 35°C. Outlet water temperatures reached 75°C. Thermal oxidation chamber volumes were 1.5 m3 and the chamber temperature was 200°C without a catalyst. To check and set the pollutant emissions from the cooker and determining the efficiency of the condenser and thermal oxidation, sampling of before the condenser (A1), after the condenser and before the thermal oxidation (A2) and after thermal oxidation (A3) had to be completed. Assessment of environmental and personal exposure environmental (A4) and personal sampling (A5) was also performed.
Sampling from rendering plant B was performed in July 2013. The temperature was 22°C and humidity was approximately 66%. In this unit the pollutant emissions from the cooker enter the refiner by the channel. The refiner is a water tank that enters the air from the bottom of the tank, where some of the gases are dissolved in water and the rest of the water comes to the surface to be removed. The volume of this tank was 3.5 m3 with 3,000 m3/hr air flow. The water of this tank was changed every day and the initial water temperature was around 15°C. To check and set the pollutant emissions from the cooker and determine the efficiency of this refiner, sampling before the refiner (B1) and after refiner (B2) had been done. To assess environmental and personal exposure, environmental sampling (B3) and personal sampling (B4) was also performed.
The air samples were collected by a personal sampling pump (SKC Inc., PA, USA) which absorbed activated carbon (SKC Inc., PA, USA) and silica gel (SKC Inc., PA, USA), in accordance with the National Institute for Occupational Safety and Health (NIOSH) method 15018, 13009, 160010, and 2002.11 The number of sampling was three for every sorbent in each place. Personal samples, however, due to the importance of personal exposure, the number of samples was raised to six for every sorbent in each place. Sampling time, according to the pre-test previously completed for breakthrough controls, was considered to be 40-90 min. Flow sampling was adjusted
using a digital flow meter at 0.2 L/min. After sampling, input and output sorbents was sealed by a plastic cap. The samples have been placed in a cool box and within <24 h were transferred to the laboratory for analysis.
Two blank samples in each rendering plant were taken in order to assess the possible secondary pollution during sampling, transport, and analysis of samples. Pollutant concentrations in the control samples should be <0.1 µg/m3. In this study the pollutant concentration in the control samples was <0.1 µg/m3.
Carbon disulfide (99.5%) (Merck Inc., Germany) and toluene (99.5%) (Merck Inc., Germany) was used for the sample preparation of activated carbon, and methanol (99%) (Merck Inc., Germany) was used for sample preparation of silica gel. Of every three charcoal samples that were sampled at the site, two samples were prepared with a solution of carbon disulfide and a sample with a solution of toluene. Toluene solvent was used to evaluate contaminants in samples of carbon disulfide.
After sample preparation, measurements had been completed by using the GC-MS (model CP-3800 gas chromatograph and Saturn 2200 mass spectrometer, Varian Technologies Japan Inc., Japan) focusing on the VOCOL capillary column with a length of 60 m and an inner diameter of 0.25 mm. Film thickness was 1.5 µm and the helium carrier gas flow was 1 ml/min. GC-MS was programmed at 35°C for 5 min and then ramped at 5°C/min to 180°C/min, further being held for 1 min. Injection temperature was 200°C. Determination of the area under the chromatographic peak measurements were performed using Varian workstation software. In order to identify and determine the quality of compounds, we used the data of the library of mass spectra interpretation software version 98 from the national institute of standards and technology (NIST). More importantly, the toxicological effects of pollutants, air pollution, and assessment of the feasibility of quantification were quantified.
Results
A total of 56 chemical pollutants in rendering plant A and 41 chemical pollutants in rendering plant B were detected. These compounds included hydrocarbons, aldehydes, ketones, alcohols, ethers, halogenated compounds, sulfur compounds, nitrogen compounds, acids, and hormones. The results of qualitative detection of pollutants are shown in Tables 1 and 2. Five compounds, acetone, benzene, pyridine, toluene, and carbon disulfide were quantified for various reasons, such as to study their carcinogenic and toxic nature, low odor threshold, and unpleasant odors. Quantification of these pollutants has been shown in Tables 3 and 4.
Hesam et al
Table 1. Organic volatiles identified in the cooker exhaust air from rendering plant A N-compounds Alcohols
Hydrocarbons
Propyl amine Ethyl hexanol
Benzene
Benzyl amine 3-methyl-3-pentanol
Toluene
Pyridine 1-tetradecanol
Ethyl benzene
3-methyl pyridine 2-methyl-1-propanol
1-ethyl-2-methyl benzene
Acetonitrile 1,2,3-trimethyl benzene
Benzonitrile Halogenated compounds
2-butane
2-amino-1-methyl benzene Trichloro ethylene
Pentane
2-chloro-2-nitro propane Tetracholoro ethylene
2-decane
Isobutyl amine Hydrogen bromide
Undecane
Amino anthrax Quinone P-chloro aniline
Tridecane
Isobutyl chloride 2-nonane
Esters 2-chloro phenol
Naphthalene
Methyl acetate Hydrocortisone acetate S-compounds
Aldehydes
Carbon disulfide Nonanal
Acids Dimethyl disulfide
Octanal
Mercapto acetic acid Dimethyl tetrasulfide
2-methyl pentanal
Carbamicacid Methyl methane sulfonate
2-ethyl butanal
Ricinoleic acid Methyl sulfinylmethylthio methane
Ethanethiol Ketones
Hormones Methanthiol
Acetone
Cortisone Propanthiol
2-decanone
Aldosterone 2-tridecanone
Prednisone 2-dodecanone
Table 2. Organic volatiles identified in the cooker exhaust air from rendering plant B S-compounds Ketones
Hydrocarbons
Carbon disulfide Acetone
Benzene
Dimethyl disulfide 2,4-dimethyl hexanone
Toluene
Dimethyl tetrasulfide 2-decanone
Ethyl benzene
Ethanethiol 2-dodecanone
1bromo ethyl benzene
Methanthiol 1-ethyl-2-methyl benzene
Propanthiol Alcohols
1,2,3-trimethyl benzene
Ethyl hexanol 1,2-dimethyl cyclohexane
N-compounds 3-methyl-3-pentanol
2,4-dimethyl hexane
Propyl amine 2-ethyl-1-hexanol
2-Decane
Benzyl amine Undecane
Acetonitrile Halogenated compounds
Tridecane
2-chloro-2-nitro propane Tetracholoro ethylene
2-nonane
4-methyl-2-hexanamine Methylene choloride
Chloro benzene Aldehydes
Acids 2,3-dimethyl pentanal
Mercapto acetic acid Esters
2- methyl pentanal
Carbamicacid Methyl acetate
2-ethyl butanal
Isobutyricacide 2-propenyl acetate
Table 3. Distribution of pollutant concentrations (ppm) in rendering plant A
Compound Mean±SD
A1 A2 A3 A4 A5
Acetone 31.33 ± 44.31 7.94 ± 11.23 ND 0.58 ± 0.82 0.43 ± 0.86
Benzene 5.99 ± 1.74 ND ND ND ND
Toluene 128.03 ± 134.37 79.38 ± 89.17 27.69 ± 25.02 15 ± 15.1 8.8 ± 11.92
Pyridine 8.9 ± 12.58 2.92 ± 4.13 2.47 ± 3.5 2.49 ± 1.21 2.38 ± 1.69
Carbon disulfide 9.45 5.06 ND 3.72 4.02 ± 0.56
Table 4. Distribution of pollutant concentrations (ppm) in rendering plant B
Compound Mean±SD
B1 B2 B3 B4
Acetone 62.70±16.21 30.39±42.98 3.595.08 5.46±7.91
Benzene 6.54±2.5 ND ND ND
Toluene 14.22±24.63 12.95±22.43 1.47±2.55 0.46±1.09
Pyridine ND ND ND ND
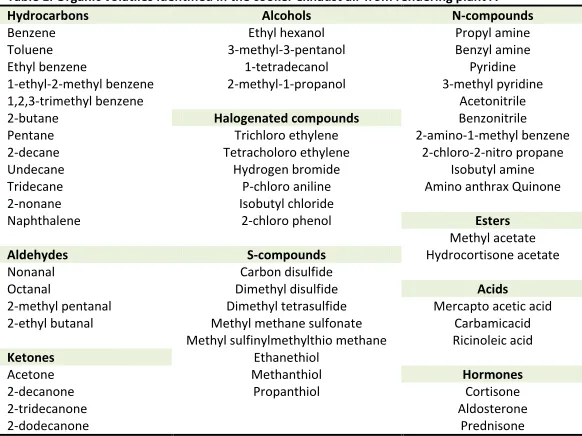
Figure 1. Typical chromatograms of the gas samples from the exhaust of the cooker in rendering plant A. Prepared by solvent carbon disulfide. Identified peaks: 1, acetone 7:74 min; 2, benzene 9:11 min; 3, toluene 11:78 min; 4 and a pyridine 17:44 min. From 5 to 6:40 min to remove the solvent (carbon disulfide) was off mass spectrometer.
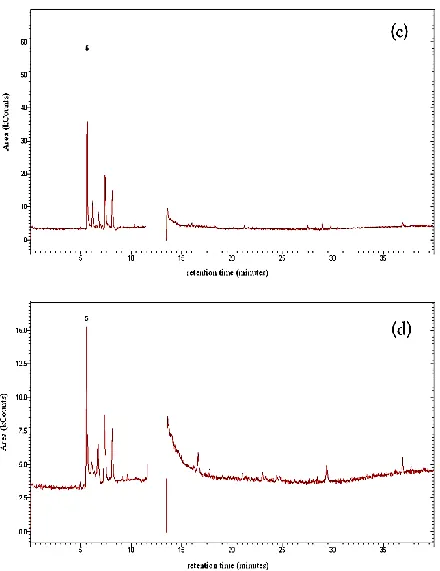
Figure 2. Typical chromatograms of the gas samples from the exhaust of the cooker in rendering plant B. Prepared by solvent toluene. Identified peaks: 5, carbon disulfide 5:61 min. From 11:50 to 13:50 min to remove the solvent (toluene) was off mass spectrometer.
Figure 3. The efficiency of pollutants removal by the condenser in rendering plant A
Figure 4. The efficiency of pollutants removal by the thermal oxidation in rendering plant A
Figure 5. The efficiency of pollutants removal by the water tank in rendering plant B
Discussion
Many studies have been completed for identifying pollutants released by a rendering plant. The major compounds identified in our study, include hydrocarbons, aldehydes, ketones, alcohols, esters, halogenated compounds, sulfur compounds, nitrogen compounds, acids, and hormones. Most of these compounds have also been reported in other studies. 4,6,12,13
However, some compounds such as hormones have not been reported in previous studies due to the low temperature of the column.2 The difference between pollutant emissions and concentrations of pollutants in different studies can be based on different materials from poultry organic wastes and the differences in the cooking process. In some studies, the feather was firstly hydrolyzed, and then it was mixed with offal; however, in some other studies, feather was combined with offal without hydrolyzing, and then the cooking was carried out. These differences could have an effect on the pollutant emissions.2,3
The cooking processes in two slaughterhouses had several main differences. The time of adding zeolite and the time of filing the cooker are two main differences in the rendering plants. Zeolite is added for increasing the absorption of nutrients and increases the nutritional value of meat powder. In rendering plant B, zeolite is added to cooking meat powder at the end of cooking and at discharge cooker, but in rendering plant A, zeolite will be added to meat powder during cooking (2 h after the cooker starts). Zeolite heating during cooking
0 20 40 60 80 100
Acetone Benzene Pyridine Toluene Carbon
disulfide 74.66
100
67.19
38 46.45
R
e
m
ova
l e
ff
ici
e
n
cy
(%)
0 50 100
Acetone Pyridine Toluene Carbon
disulfide 100
15.41 65.12
100
R
e
m
ova
l e
ff
ici
e
n
cy
(%)
0 50 100
Acetone Benzene Toluene Carbon
disulfide 51.53
100
8.93
41.94
R
e
m
ova
l e
ff
ici
e
n
cy
Hesam et al
may reduce some pollutants and produces other contaminants. Also in rendering plant B, slaughterhouse organic wastes are accumulated from the outside and 1 h before cooking, cookers are filled, whereas in rendering plant A, cooker filling is performed after the discharge of the cooker and cooking process takes place the next morning (17 h later cooker filing). Accumulation of waste products in the cooker for 17 h causes the accumulation of pollutants resulting from the enzymatic degradation of microorganisms and their protein oxidation which affects the type and concentration of pollutants.1
Previous studies have identified the presence of benzene and toluene, however, the presence of benzene has been attributed to the environment.14,15 Benzene and toluene are aromatic hydrocarbons that often simultaneously occur in the workplace or in the environment. Benzene has been classified as a group 1 carcinogen contaminant by the International Agency for Research on Cancer (IARC) because it can cause leukemia in humans. Toluene is toxic to the central nervous system but is not carcinogenic.16 The odor threshold for benzene and toluene, respectively, are 8.65 and 0.16 ppm and their threshold limits value (TLV) are 0.5 and 20 ppm. Kastner and Das (2002), for instance, identified benzene and toluene in air released cookers (entry scrubber), but for very low concentrations, it cannot quantify.2 Dincer et al. (2006), on the other hand, reported that the benzene and toluene concentrations in ambient air of rendering plants are 0.1-0.4 ppb and 0.25.2 ppb, respectively. They believed that benzene and toluene in the air of rendering plants is probably due to traffic machines.6 In our study, the concentrations of benzene and toluene released by the cooker are much higher than personal and environmental exposure. Availability of benzene and toluene in air emissions from the cooker in our study and from studies such as Kastner2 indicates that the main source of benzene and toluene environment is directly from the waste cooker.
Carbon disulfide and acetone were reported in previous studies in the air of a rendering plant.6,12 Carbon disulfide is a volatile liquid with a pungent odor and is classified as a dangerous pollutant under categories III in the United States Clean Air Act Amendment (CAAA).17 Acetone is also a clear fluid with a nauseating odor at high concentrations which causes eye, nose, and throat irritation.18 As well as this, carbon disulfide is produced naturally as a result of microbial activity in a low oxygen environment.17,19 Acetone can be produce by the breaking down of starches and sugars by bacteria.20 Correlation between contaminants and odor of the rendering plant showed that acetone, carbon disulfide and aldehydes are responsible for the smell.6 Odor thresholds in carbon disulfide and benzene were 0.096 ppm and 4.58 ppm, respectively, and TLV is 500 and 1 ppm. Anet et al. (2013) reported diffused acetone concentrations of a cooker (entry biofilter) to be 0.29-0.78 ppm,12 and Dincer et al. (2006) reported environmental concentrations of acetone and carbon disulfide in the rendering plant to be 1.7-11 ppb and 0.1-0.6 ppb, respectively.6 Acetone and carbon disulfide concentrations in our study for personal, environmental and diffused exposure was found to be higher than the cooker which is likely due to differences in the cooking process.
Pyridine is volatile liquid with an odor threshold of 0.17 ppm and TLV is 1 ppm. Pyridine manufacturing and industrial operations in which pyridine is used has caused severe odor problems. Pyridine is a carcinogen and mutagen and is as a dangerous pollutant classified by the USEPA.21,22 Pyridine is found in certain medicines, vitamins, and food flavorings23 and can also be produced in reactions with the carbonyl group of a sugar in the heat.24 Dincer et al. (2006) reported the environmental concentration of pyridine in the rendering plant as 0.1 ppb.6 Sato et al. (2001), however, reported the diffused pyridine concentration of human wastes to be 0.03-0.23 ppm.25 In our study, pyridine was detected only in the rendering plant A, which may be due to the retention time being much higher in the cooker. After unloading the cooker, wastes poured in the cooker which was still hot and can react with amines and carbonyl to produce pyridine.
Use of the condenser, thermal oxidation, and wet scrubber for removal of VOCs in the rendering plant has been performed in previous studies.2,3,26 Sironiet al. (2007), for example, reported that the thermal oxidation and scrubber efficiency in removing pollutants released by a rendering plant were more than 99 and 41%-60%, respectively.1 In our study, the removal rate in the condenser and water tank was 38%-100% and 8.93%100%, respectively. The highest removal efficiency of the condenser and water tank is the benzene pollutant and the lowest was for toluene pollutant. Thus, there was a lower boiling point and higher solubility of benzene to toluene in water27 and these lower concentrations of benzene to toluene are mostly due to the 100% removal efficiency of benzene and lower removal efficiency of toluene.
Removal efficiency of thermal oxidation was 16%-100%. The highest removal efficiency was for contaminants acetone and carbon disulfide, and lowest had been for pyridine pollutants. The higher flame point of pyridine to acetone and carbon disulfide is the reason for the lower efficiency of pyridine thermal oxidation. In most studies, proper combustion temperatures are needed to incinerate VOCs and turn them into carbon dioxide and water vapor. This was suggested to occur between 700°C and 1400°C. Using a platinum, palladium, and rubidium catalyst, the required temperature reduced between 300°C and 700°C.28 A lower combustion point of thermal oxidation in our study was, therefore, due to the low efficiency of thermal oxidation.
This study showed that the gases released from the rendering plant are made up of a complex mixture of chemical compounds. Quantification was made for five compounds from the 56 detected compounds in rendering plant A and 41 detected compounds in rendering plant B. Personal exposure to carbon disulfide and pyridine in rendering plant A and carbon disulfide in rendering plant B were found to be more than the threshold values. The concentration of toluene, carbon disulfide, and pyridine in rendering plant A and the concentration of toluene, acetone, and carbon disulfide in rendering plant B were also higher than the odor threshold.
with an efficiency of 100%, 72.24%, and 78.37%. Low temperature thermal oxidation has been the main reason for the low removal efficiency of some compounds. Removal efficiency of the water tank for four quantified compositions was approximately 50%.
Acknowledgement
This study was funded by Hamadan University of Medical Sciences.
Conflict of Interest
The authors declare that they have no conflict of interest.
References
1. Sironi S, Capelli L, Céntola P, Del Rosso R, Grande MI. Odour emission factors for assessment and prediction of Italian rendering plants odour impact. Chem Eng J 2007;131:225-31. doi:10.1016/j.cej.2006.11.015
2. Kastner JR, Das K. Wet scrubber analysis of volatile organic compound removal in the rendering industry. J Air Waste Manage Assoc 2002;52:459-69.
doi: 10.1080/10473289.2002.10470800
3. Kastner JR, Das KC. Comparison of chemical wet scrubbers and biofiltration for control of volatile organic compounds using GC/MS techniques and kinetic analysis. J Chem Technol Biotechnol 2005;80:1170-9. doi: 10.1002/jctb.1308
4. Ristic MD, Sakac MB, Filipovic SS. Waste gases arising in rendering plants for harmless removal of animal by-products by technological processing. Annals of the Faculty of Engineering Hunedoara 2005;3:105-12.
5. Shareefdeen Z, Herner B, Webb D, Verhaeghe L, Wilson S. An odor predictive model for rendering applications. Chem Eng J 2005;113:215-20.
doi:10.1016/j.cej.2005.03.006
6. Dincer F, Muezzinoglu A. Chemical characterization of odors due to some industrial and urban facilities in Izmir, Turkey. Atmos Environ 2006;40:4210-9. doi:10.1016/j.atmosenv.2005.12.067
7. Anet B, Couriol C, Lendormi T, Amrane A, Le Cloirec P, Cogny G, et al. Characterization and selection of packing materials for biofiltration of rendering odourous emissions. Water Air & Soil Pollution 2013;224:1-13. doi: 10.1007/s11270-013-1622-1
8. National Institute for Occupational Safety and Health (NIOSH). Hydrocarbons, aromatic: method 1501. In: NIOSH manual of analytical methods (NMAM). 4th ed. Cincinnati, OH: Centers for Disease Control and Prevention;2003.
9. National Institute for Occupational Safety and Health (NIOSH). Ketones: Method 1300. In: NIOSH manual of analytical methods (NMAM). 4th ed. Cincinnati, OH: Centers for Disease Control and Prevention;1994.
10. National Institute for Occupational Safety and Health (NIOSH). Carbon disulfide: Method 1600. In: NIOSH manual of analytical methods (NMAM). 4th ed. Cincinnati, OH: Centers for Disease Control and Prevention; 1994.
11. National Institute for Occupational Safety and Health (NIOSH). Aromatic amines: Method 2002. In: NIOSH manual of analytical methods (NMAM). 4th ed. Cincinnati, OH: Centers for Disease Control and Prevention;1994.
12. Anet B, Lemasle M, Couriol C, Lendormi T, Amrane A, Le Cloirec P, et al. Characterization of gaseous odorous emissions from a rendering plant by GC/MS and treatment by biofiltration. J Environ Manage 2013;128:981-7. doi: 10.1016/j.jenvman.2013.06.028
13. Defoer N, De Bo I, Van Langenhove H, Dewulf J, Van Elst T. Gas chromatography–mass spectrometry as a tool for estimating odour concentrations of biofilter effluents at aerobic composting and rendering plants. J Chromatogr A 2002;970:259-73. doi:10.1016/S0021-9673(02)00654-4
14. Barnes RD, MacLeod AJ. Analysis of the composition of the volatile malodour emissions from six animal rendering factories. Analyst 1982;107:711-5. doi: 10.1039/AN9820700711
15. Van Langenhove HR, Van Wassenhove FA, Coppin JK, Van Acker MR, Schamp NM. Gas chromatography/mass spectrometry identification of organic volatiles contributing to rendering odors. Environ Sci Technol 1982;16:883-6.
doi: 10.1021/es00106a012
16. Lovreglio P, Barbieri A, Carrieri M, Sabatini L, Fracasso ME, Doria D, et al. Validity of new biomarkers of internal dose for use in the biological monitoring of occupational and environmental exposure to low concentrations of benzene and toluene. Int Arch Occup Environ Health 2010;83:341-56. doi: 10.1007/s00420-009-0469-7
17. Hugler W, Acosta C, Revah S. Biological removal of carbon disulfide from waste air streams. Environmental Progress 1999;18:173-7. doi: 10.1002/ep.670180313
18. Chesley MR. Methamphetamines: an epidemic of clandestine labs and health risk. Washington DC: Department of Emergency Medicine Howard University Hospital;1999.
19. Smith NA, Kelly DP. Oxidation of carbon disulphide as the sole source of energy for the autotrophic growth of Thiobacillus thioparus strain TK-m. J Gen Microbiol 1988;134:3041-8. doi: 10.1099/00221287-134-11-3041
20. Dürre P. Fermentative butanol production. Ann N Y Acad Sci 2008;1125:353-62. doi: 10.1196/annals.1419.009
21. Mudliar S, Padoley K, Bhatt P, Sureshkumar M, Lokhande S, Pandey R, et al. Pyridine biodegradation in a novel rotating rope bioreactor. Bioresour Technol 2008;99:1044-51. doi:10.1016/j.biortech.2007.02.039
22. Pandey R, Padoley K, Mukherji S, Mudliar S, Vaidya A, Rajvaidya A, et al. Biotreatment of waste gas containing pyridine in a biofilter. Bioresour Technol 2007;98:2258-67. doi:10.1016/j.biortech.2006.05.015
23. Chatterjee S, Biswas S, Ganguly S, Mathur AK. Isolation of pyridine degrading bacteria from soils contaminated with petrochemical industry effluents in purba medinipur. J Biol Environ Sci 2013;7:109-19.
24. Ponzoni A, Depari A, Falasconi M, Comini E, Flammini A, Marioli D, et al. Bread baking aromas detection by low-cost electronic nose. Sens Actuators B Chem. 2008;130:100-4.doi:10.1016/j.snb.2007.07.099
25. Sato H, Hirose T, Kimura T, Moriyama Y, Nakashima Y. Analysis of malodorous volatile substances of human waste: feces and urine. J Health Sci 2001;47:483-90. doi: 10.1248/jhs.47.483
26. Kolar P. Low-temperature catalytic oxidation of volatile organic compounds using novel catalysts [dissertation]. Athens: The University of Georgia;2008.
27. Sieg K, Fries E, Püttmann W. Analysis of benzene, toluene, ethylbenzene, xylenes and aldehydes in melted snow water via solid-phase dynamic extraction combined with gas chromatography/mass spectrometry. J Chromatogr A 2008;1178:178-86. doi:10.1016/j.chroma.2007.11.025