Open Access
Research
Changes in timber haul emissions in the context of shifting forest
management and infrastructure
Sean P Healey*
1, Jock A Blackard
1, Todd A Morgan
2, Dan Loeffler
3,
Greg Jones
3, Jon Songster
2, Jason P Brandt
2, Gretchen G Moisen
1and
Larry T DeBlander
1Address: 1US Forest Service, Rocky Mountain Research Station, Inventory, Monitoring and Analysis Program, 507 25thSt., Ogden, UT, 84401, USA, 2Bureau of Business and Economic Research, School of Business Administration, University of Montana, Missoula, MT 59812, USA and 3US Forest
Service, Rocky Mountain Research Station, Human Dimensions Program, 800 E. Beckwith Ave, Missoula, MT 59801, USA
Email: Sean P Healey* - [email protected]; Jock A Blackard - [email protected]; Todd A Morgan - [email protected]; Dan Loeffler - [email protected]; Greg Jones - [email protected]; Jon Songster - [email protected];
Jason P Brandt - [email protected]; Gretchen G Moisen - [email protected]; Larry T DeBlander - [email protected] * Corresponding author
Abstract
Background: Although significant amounts of carbon may be stored in harvested wood products, the extraction of that carbon from the forest generally entails combustion of fossil fuels. The transport of timber from the forest to primary milling facilities may in particular create emissions that reduce the net sequestration value of product carbon storage. However, attempts to quantify the effects of transport on the net effects of forest management typically use relatively sparse survey data to determine transportation emission factors. We developed an approach for systematically determining transport emissions using: 1) -remotely sensed maps to estimate the spatial distribution of harvests, and 2) - industry data to determine landscape-level harvest volumes as well as the location and processing totals of individual mills. These data support spatial network analysis that can produce estimates of fossil carbon released in timber transport.
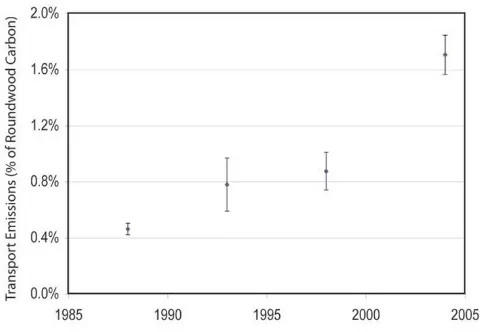
Results: Transport-related emissions, evaluated as a fraction of transported wood carbon at 4 points in time on a landscape in western Montana (USA), rose from 0.5% in 1988 to 1.7% in 2004 as local mills closed and spatial patterns of harvest shifted due to decreased logging on federal lands.
Conclusion: The apparent sensitivity of transport emissions to harvest and infrastructure patterns suggests that timber haul is a dynamic component of forest carbon management that bears further study both across regions and over time. The monitoring approach used here, which draws only from widely available monitoring data, could readily be adapted to provide current and historical estimates of transport emissions in a consistent way across large areas.
Background
Significant amounts of carbon may be stored in harvested wood products. In the United States, for example,
remov-als of atmospheric carbon due to changes in forest prod-uct pools are currently on the order of 50 Tg C per year [1,2]. However, the management activity needed to
trans-Published: 29 October 2009
Carbon Balance and Management 2009, 4:9 doi:10.1186/1750-0680-4-9
Received: 7 August 2009 Accepted: 29 October 2009 This article is available from: http://www.cbmjournal.com/content/4/1/9
© 2009 Healey et al; licensee BioMed Central Ltd.
fer ecosystem carbon to product pools usually involves the release of carbon from fossil fuels. The transport of timber from the stand to processing facilities may be a particularly important source of fossil carbon emission. Such transport can represent more than 50% of all fossil carbon emissions related to forest management [3,4]. Sonne [5] estimated that timber transport in 50-year rota-tion Douglas-fir forests released carbon dioxide equiva-lent to 4.8% of stand storage. While timber transport may represent a significant "cost" of sequestering carbon in harvested wood products, the magnitude of haul emis-sions will clearly vary in relation to the distance timber must travel to reach milling facilities.
To date, logistical obstacles have prevented comprehen-sive tracking of timber transport distances and emissions. While average road distances can be tracked by individual drivers and/or mill operators, record-keeping at the land-scape level would be onerous. Existing efforts to capture haul distances and emissions (e.g. [4,6]) tend only to sur-vey selected mills or drivers. Also, since the spatial distri-butions of both harvests and mills are dynamic over time, it is possible that even comprehensive estimates of haul-related emissions might quickly become out-of-date. For instance, it is broadly recognized that changes in the mill-ing industry in the western United States over the last 2 decades have led to the closure of many local facilities and the consolidation of timber processing within a shrinking number of larger mills [7]. A possible result of this trend might be that logs must now travel farther to be processed, resulting in higher fossil carbon emissions per unit of wood product carbon.
The goals of the research described here were three-fold: 1) to demonstrate a methodology that may be used in the US and other countries having comparable monitoring resources to include all relevant mills in haul distance cal-culation, 2) to assess the degree to which transportation-related emissions reduce the net sequestration of wood product carbon in a study area in western Montana (USA), and 3) to investigate how the fossil carbon "cost" of tim-ber transportation has changed over 2 decades in the con-text of shifting spatial distributions of milling facilities and changing federal forest land management.
The monitoring approach used here relied upon two well-developed, nationally available data sources: timber industry output monitoring and harvest maps produced with time series of Landsat satellite imagery. Timber out-put monitoring, while not originally designed to aid car-bon monitoring, is a potentially rich source of information for timber transport monitoring because it captures the flow of raw materials to processing sites. In the United States, this information is collected nationally through Timber Product Output (TPO) studies carried out
on behalf of the Forest Inventory and Analysis Program (FIA) of the U.S. Forest Service [8-10]. Mill censuses and logging utilization studies are conducted periodically (approximately once every 2-6 years) at the state level to account for all of the destinations of the roundwood har-vested from each local area (county). The volume and spe-cies of incoming timber for each mill can be identified by county of origin.
Likely transport distances may be calculated when this record of timber destinations is combined in a geographic information system (GIS) with remotely sensed informa-tion about timber origins. The locainforma-tion and timing of for-est harvfor-ests may be accurately mapped using historical Landsat satellite imagery. Healey et al. [11] mapped stand-clearing harvests in Oregon and Washington from 1972 (the first year of Landsat imagery availability) to 2002 in 4-year intervals with an overall accuracy of approximately 90% (kappa = 0.8). Other studies have shown similar accuracies [12-14]. Mining these two data sources may provide a more comprehensive picture of timber flows than current survey methods allow, espe-cially over time.
Several tools have been developed in the context of car-bon offset monitoring to quantify carcar-bon sequestration related to forest harvest. Systematic efforts have been made to account for several factors, including: forest type, stand age, region, and product type [15]. However, defen-sible estimates for timber transport emissions are rarely available at the landscape level. More importantly, the underlying relationships between transport emissions and changes in forest management and industry infra-structure have not been explored. As the processing indus-try is impacted by changes in timber availability, global and local competition, the introduction of new products and processes, and changing market conditions, insight is needed into the magnitude and direction of changing transport emissions. The results of this study may shed light on underlying causes and ultimate carbon conse-quences of transport emission trends in the Northern Rockies region of the US. Such insights will be necessary as we try to understand the implications of forest manage-ment for the global carbon cycle.
Results
Estimates of Timber Volume Loss
performed using independent FIA plot measurements. The model showed a root mean squared error (RMSE) of 120 cubic meters/hectare, approximately 68% of the mean observed value. This is consistent with accuracies of similar modelling efforts using the Landsat sensor [16].
Although mapped estimates of harvest volume were used only to spatially distribute known county-level numbers, there may be some cases outside of the United States where industry monitoring data is not available. To test the compatibility of official records with estimates derived from satellite and inventory data, mapped estimates of volume removal were compared to county-level TPO har-vest records. The time periods in these two monitoring efforts were not perfectly aligned. Image-based estimates were generally over 2-year periods, beginning and ending during the growing season, while the 4 dates of TPO data cover single calendar years. Nevertheless, after dividing the map-based estimates by the number of years between images, the magnitude and trend of image-based esti-mates corresponded well with TPO harvest records (Pear-son product moment correlation coefficient 0.61; Figure 1).
Timber Haul Distance and Carbon Emissions
The average likely road distance among the simulations performed here were: 46.3 km in 1988, 80.9 km in 1993, 82.9 km in 1998, and 214 km in 2004. Of these distances, 17.1, 13.0, 20.5, and 26.0 km respectively were over unfinished or local roads. The number of mills processing
the county's timber generally went up through the study period, as did the distance of new mills from the timber-producing areas of the county. In addition to the changing orientation of mills, there was evidence that trends in the positioning of harvests patches played a small role in increasing haul distances. When 1988 harvest locations were paired via 500 simulations with 2004 mill locations (using each mill's share of the county's 2004 harvest), the average simulated haul distance was 204.1 km, which was 4.5% less than when 2004 harvests were sent to 2004 mills. Likewise, when 2004 harvests were sent to 1988 mills, average haul distances were 57.2 km (23.7% higher than when 1988 harvest locations were used). This sug-gests that 1988 harvest locations were closer to processing infrastructure as it existed both in 1988 and 2004. Despite this evidence that harvest positioning made a contribu-tion to increasing haul distance, changes in haul destina-tion (i.e. receiving mill locadestina-tions) nevertheless accounted for most of the increased haul distance.
As haul distances rose throughout the period, carbon emissions as a share of the sequestered product carbon (i.e. as a fraction of the wood volume processed by mills) more than quadrupled from 1988 to 2004 (Figure 2). Bars in Figure 2 represent the standard deviation of estimates resulting from the 500 simulations for each date. Only the emission estimates for 1993 and 1998 were within each other's one-standard deviation bar.
Discussion
Two important trends in the harvest and processing of for-est products occurred between the beginning and end of the study period. According to TPO records [9,17-21],
har-Estimates of growing stock harvest volume using TPO records and Landsat change mapping
Figure 1
Estimates of growing stock harvest volume using TPO records and Landsat change mapping. Landsat-based estimates were derived through the "state model dif-ferencing" (Healey et al., 2006) approach of modelling the change in a biophysical variable such as volume over time. TPO records were available for 1988, 1993, 1998, and 2004, while Landsat intervals were: 1986 to 1988, 1993 to 1995, 1997 to 1998, and 2003 to 2005. Landsat estimates represent the total mapped harvest volume divided by the number of years in the monitoring period.
Change in Ravalli County log transport emissions as a func-tion of the carbon in the roundwood being transported
Figure 2
vest volumes in federally managed national forests in the county dropped 76% between 1988 and 2004, while vol-umes on other lands dropped only 11%. The resulting ownership-related spatial shift in timber production was seen to increase total haul distances in this study. How-ever, changes in the processing industry had a much larger impact on haul distance. Reductions in available timber volume contributed to the closing of many mills in the Interior West (US) region during the study period [9,22]. Although the opening of new smaller-scale log home and log furniture facilities kept the total number of firms rela-tively stable [9,23], the closing of higher-volume sawmills meant that the majority of logs had to be shipped farther to reach surviving mills.
Our results showed that as local mills closer to Ravalli County's timber-producing areas closed, transport emis-sions quadrupled in relation to the carbon sequestered in forest products. More study is needed to determine the overall carbon consequences of shifts in the processing industry, particularly in light of data showing that existing facilities have increased residue utilization, decreased res-idue production, and improved overall efficiency [9]. However, the changing spatial arrangement and number of operating mills had a clear impact on the transporta-tion component of net sequestered carbon.
The GIS-based methods used in this study to identify transportation carbon emissions had several advantages over the questionnaire-type data sources commonly relied upon by product life cycle studies. First, using globally available Landsat data and nationally available industry monitoring, the system considers all mills and likely har-vest sites instead of just a sample. The observed sensitivity of estimates to different configurations of timber sources and destinations suggests that any sample would have to be fairly extensive in order to be adequately representative of landscape-level dynamics. The method of emission cal-culation used here is straightforward, and the resulting comprehensive monitoring may not require significantly more time than conducting extensive surveys. Further, the system's simulation approach allows ready quantification of uncertainty related to the routing of the county's tim-ber. Most importantly, this approach allows emissions monitoring that is consistent over both space and time, permitting analysis of the kinds of management and infra-structure trends discussed above.
The use of a GIS to track timber transport would allow, if needed, monitoring of a variety of transport types. While truck transport is by far the most common means of trans-portation in the study area and throughout much of the world [24], care should be taken to check this assumption locally. In Sweden, for example, although transportation by truck now predominates, river transport was much
more common in the early 1970's [3]. Differential emis-sion loadings could be implemented for certain routes (following river courses or rail routes, for example) in the GIS if there were evidence of significant non-truck trans-port. Even within a single haul, different surfaces and grades likely result in important differences in the rate of fuel consumption. Our simulations used generalized fuel efficiency rates for logging trucks in the western United States, but pending better information about the relation-ship between road type and fuel use, application of differ-ential rates of combustion by road surface would increase the precision of fuel use estimates. Simulated haul dis-tances on unfinished and local roads were reported here to demonstrate that such information may be preserved in this approach.
While the measured magnitude of fossil carbon emissions in relation to the carbon sequestered in forest products was fairly small (1.7% in 2004), realistic accounting of the effects of forest management on ecosystem carbon flux will depend upon accurate quantification of such factors. There are a number of resources designed to help land-owners in the United States account for variables such as forest type and age in determining the carbon "offset" value of their managed stands [15,25-27]. Extending the methods described here to a sample of county-level trans-port emissions could generate systematic, regionally spe-cific factors by which carbon offsets related to forest product sequestration could be reduced to account for haul-related emissions. Extensive historical data to sup-port such an effort are available: TPO monitoring has occurred for decades across the country [8], and consistent maps of historical forest disturbances are available through projects such as the North American Forest Dynamics element of the North American Carbon Pro-gram [28].
care not to over-interpret the magnitude of emission esti-mates resulting from the techniques described here.
Beyond carbon accounting, the network analysis used here may have applications in decisions regarding the location of facilities designed to extract energy from forest biomass. Haul distance is a critical economic considera-tion in the viability of such projects, with the costs of longer hauls precluding the generation of some forms of bioenergy [32]. The network analysis presented here could easily be run using simulated harvest and facility locations to predict haul costs and identify favourable har-vest-facility orientations. Only slight changes would be needed in the calculations to reflect the use of biomass container trucks instead of logging trucks, and to express distance costs in economic terms rather than as a function of carbon emissions.
Conclusion
A full accounting of the effect of forest management on forest carbon exchange is needed if forests are to be actively integrated into plans for reducing atmospheric concentrations of greenhouse gases. This study high-lighted a GIS-based method for comprehensive and con-sistent tracking of logging truck fossil carbon emissions. It also determined that such emissions can vary significantly in response to changes in management practices and industry infrastructure. As future efforts further character-ize the carbon dynamics of complex forest landscapes, it is likely that new applications will continue to be found for existing monitoring data from satellites, forest inven-tory, and the timber industry.
Methods
Study Area and Basic Monitoring Data
Network analysis was used to determine likely haul dis-tances in Ravalli County, Montana, during 4 years: 1988, 1993, 1998, and 2004. Ravalli County (approximately 622,000 hectares) is situated in the Northern Rocky Mountain region of the western United States. The mostly agricultural Bitterroot Valley is at the center of the county, with forested foothills and mountains toward the exterior. Forests in the county are coniferous; lodgepole pine (Pinus contorta) and Douglas-fir (Psuedotsuga menziesii) are the most common tree species by volume, with significant additional stocks of subalpine fir (Abies lasiocarpa), Engle-man Spruce (Picea engelmannii), and ponderosa pine (Pinus ponderosa) [33]. The region has a well-established timber industry, and reliable county-level harvest data goes back at least 50 years [21].
The TPO data used in this analysis came from comprehen-sive censuses of mills, including those outside the county, which processed Ravalli County timber. A decision regarding the boundary of this study was made to study
the transport of all materials harvested in Ravalli County to wherever they were processed. TPO data could just have easily supported the inverse of this approach: i.e. the haul distance of materials harvested anywhere and then trans-ported to Ravalli County for processing. However, this alternative approach for generating average haul distance would have required significantly more image processing to map harvests across a broader area. In this region, mill censuses are carried out on behalf of the US Forest Service approximately every 5 years [9,17-21]. Mill census results include mill-specific volumes by species group and pri-mary product type. While the activities of individual mills are not released to the public, mill-specific volumes and locations may be used internally in projects such as this one as long as reported analyses maintain confidentiality of firm-level proprietary information.
While TPO data defined the destinations and volumes of all timber hauls emanating from Ravalli County for the 4 years studied (1988, 1993, 1998, 2004), haul origins were described through satellite mapping and inventory data. Landsat satellite imagery was acquired from both before and after each of these dates (Table 1). All imagery was radiometrically corrected to surface reflectance using the Landscape Ecosystem Disturbance Adaptive Processing System [34].
This imagery was used with topographic data and forest inventory data to create a model of growing stock volume (net timber volume in the central stem) using Random Forests, a recursive, non-parametric tree-based approach [35]. Inventory data were supplied by the Forest Inventory and Analysis unit (FIA) of the US Forest Service, which maintains a consistent national network of field plots and is responsible for reporting the status and trends of the
Table 1: Acquisition dates for Path 41, Row 28 Landsat 5 satellite imagery used in harvest mapping.
Year Date
1986 7 August
1988 27 July
1993 10 August
1995 31 July
1997 21 August
1998 8 August
2003 21 July
country's forest resources [36]. A total of 472 plots, taken from Ravalli and adjoining counties, were available for model building; an independent set of 337 plots was reserved for model validation. This model was developed in the R statistical environment [37] and was applied to each image in the time series using a freely available pack-age [38].
The resultant maps of growing stock volume were sub-tracted from one another across time periods to produce maps showing the location and intensity of harvests in terms of estimated growing stock volume removal. Areas of volume loss greater than 17.5 cubic meters/hectare were interpreted as disturbances in each period. This threshold was determined empirically, considering the above error in the original growing stock volume model and the appearance of the resulting disturbance maps. Because many sources of error such as unusual topo-graphic shading or rare species mixes are fairly constant for individual areas over time, changes in predicted vol-umes over time using even relatively weak models may be good indicators of disturbance [39]. This method of change detection is called "state model differencing" [39].
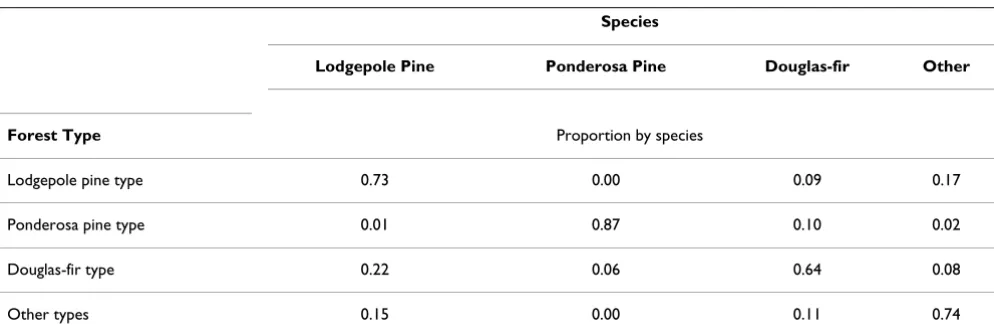
Of the disturbances identified for each of the 4 time peri-ods, patches of harvest were visually delineated using patch spatial properties and through the elimination of likely fires using a publicly available national historical fire database [40]. The predicted harvest volume of each patch was derived from the sum of predicted volume losses (i.e. predicted pre-harvest volume minus predicted post-harvest volume) from each of the patch's constituent pixels. Overall map-based estimates of harvest volume at the county level were checked against TPO-derived records of harvest volume. Forest type, as derived from the majority value from the FIA national forest type map [41], was also attached as an attribute to each mapped harvest. The overall accuracy of this forest type map, as condensed
to the 4 types used here (see Table 2) and assessed against the 89 FIA plots available for Ravalli County, was 78%. Thus, estimates of harvest location, timing, species and volume were available for subsequent network analysis, along with previously described TPO information about the volume and species of timber processed by each mill.
Determining Carbon Emissions
Estimated emissions were based upon the assumptions that logging trucks average 1.7 km per liter of fuel [42,43], and that combustion emissions total 10.52 kg C/liter of diesel (http://www.epa.gov/oms/climate/ 420f05001.htm, accessed June, 2009). Schwaiger and Zimmer [24] reported a range of payload capacities among European nations; the simulations reported here used an average capacity of 27.2 metric tonnes per logging truck, following survey results from Washington state pre-sented by Mason et al. [43]. It was assumed that one m3 of roundwood weighs 0.9 tonnes (following [24]; similar to the rate of 0.87 t/m3used by [3]), although variation in specific gravity certainly occurs among species. Accord-ingly, a factor of 0.0143 kg C/m3/km was used to identify fossil carbon emissions related to timber transport. A fac-tor of 150% was added [3] to account for empty return trips and loading activities. Thus, the final carbon emis-sion factor used in the simulations below was 0.0214 kg C/m3/km. All transport was assumed to occur via logging trucks.
Network Analysis
Since TPO records give historical harvest volumes, the main obstacle in applying the above emission factor (0.0214 kg C/m3/km) is a lack of knowledge of the aver-age haul distance for the county's timber. We used the spa-tial network of mapped Ravalli County harvests and known mill locations to estimate average haul distance. Simulated routings, constrained by the known timber intake of each mill, were used to explore a range of
poten-Table 2: Distribution of measured growing stock volume among species across 4 different forest types in 89 forested FIA plots in Ravalli County (measured from 2003 to 2007).
Species
Lodgepole Pine Ponderosa Pine Douglas-fir Other
Forest Type Proportion by species
Lodgepole pine type 0.73 0.00 0.09 0.17
Ponderosa pine type 0.01 0.87 0.10 0.02
Douglas-fir type 0.22 0.06 0.64 0.08
tial transportation scenarios at 4 points in time: 1988, 1993, 1998, and 2004. The major steps of this network analysis are detailed below.
1. Determine likely haul distance between each mapped harvest polygon and each mill
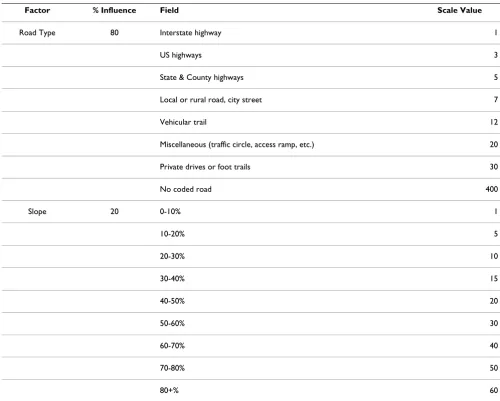
Likely road distances between each pair-wise combination of mapped harvest polygons and known mill locations (hereafter called "patch-mill pairs") were determined using the "Least-Cost-Path" in the ArcGIS environment [44] (see Figure 3). Ancillary spatial data that included the region's topography (National Elevation Dataset, availa-ble from http://seamless.usgs.gov/index.php in May, 2009) and road network were acquired. These spatial var-iables were weighted (see Table 3) to create a "cost" func-tion that was applied to the region. In general, roads were given the lowest cost (with developed roads preferred over dirt roads), and in areas where road layers provided no
connections (a common phenomenon in areas adjacent to harvest sites), topographic considerations became important (gentle slopes preferred over steep). The algo-rithm identified the route minimizing this cost function. For each patch-mill pair, both the total likely road dis-tance and the disdis-tance on unfinished roads (local or rural roads, vehicular trails, areas with no recorded roads) were written to matrices that could be referenced in later stages.
2. Distribute TPO-recorded harvest volume to mapped patches
Satellite-based harvest maps were used to determine the spatial distribution of TPO-recorded county-level harvest volumes. Because sorting and separation of different spe-cies is common at the harvest site, 4 different spespe-cies bins-lodgepole pine, ponderosa pine, Douglas-fir, and a group containing less common species - were "routed" inde-pendently within the simulations. As described earlier, a modelled volume loss could be attributed to each patch.
Table 3: Factor and field weights used in the cost-spread function that produced likely haul routes and distances.
Factor % Influence Field Scale Value
Road Type 80 Interstate highway 1
US highways 3
State & County highways 5
Local or rural road, city street 7
Vehicular trail 12
Miscellaneous (traffic circle, access ramp, etc.) 20
Private drives or foot trails 30
No coded road 400
Slope 20 0-10% 1
10-20% 5
20-30% 10
30-40% 15
40-50% 20
50-60% 30
60-70% 40
70-80% 50
80+% 60
Likely routes (yellow) identified between mapped forest harvests (colored patches) and a single mill (red triangle) in Ravalli County
Figure 3
That patch-level volume was first distributed among the 4 species bins. Distribution by species used each patch's majority value according to a widely used forest type map [41]. This forest type call was combined with a survey-based county-level breakdown of the distribution of vol-ume among species within each forest type [33] (see Table 2) to determine how much of the mapped removal was attributable to each species.
Modelled harvest volumes for each species from each patch were then scaled to TPO-derived county-level num-bers. Specifically, each harvest patch's fraction of all mapped harvest volume within the county for a given spe-cies was multiplied by the actual TPO-based county-level harvest volume for that species. In this way, the overall amount of timber being moved in the simulation matched TPO records and was distributed among mapped harvest patches in proportion to those patches' estimated harvest volume. This also had the effect of reconciling the 2-year mapping intervals (starting and ending during mid-year growing seasons) with the calendar-year time steps of the TPO data and this study.
3. For each simulation, generate a list of mill-patch routes
The preceding steps assigned a harvest volume to mapped harvest patches across the landscape and also identified the location and capacity of mills processing that harvest volume. Still unknown, however, was the routing of tim-ber from each origin (patch) to each destination (mill). 500 simulations involving different pairings of patches and mills were used to develop an understanding of the trend and variability of possible haul distances. Proximity was not incorporated as a factor in the choice of routings because many of the harvests were relatively close to one another and because of professional judgment that differ-ences of a few kilometers are not typically the basis for the choice of a processing facility.
In each simulation, the percentage of patches "sending" their estimated harvest volume to a particular mill was approximately equivalent to that mill's proportion of the county's total harvest (according to TPO records). For every species bin in each patch, a random number between 0 and 1.0 was generated in relation to each mill. Patch-mill pairs were flagged and later included in the simulation if the random number was less than the mill's TPO-derived share of the county's harvest volume for that species. This process was carried out independently for each harvest site and mill, so the volume from a given har-vest was not forced to go to exactly one mill. In aggregate, however, harvest volume from each patch was sent to an average of one mill, and the known capacities of each mill were realistically represented. If a mill processed 30% of Ravalli County's wood products, approximately 30% of
the harvests in each realization would be randomly flagged as points of origin for that mill.
4. For each chosen route, apply emission formula, sum emissions within the simulation, and combine results over all simulations
The list of selected patch-mill pairs generated in the previ-ous step could be related to both the matrix of "least-cost" road distances between each patch and each mill, and to the estimated harvest volume for each patch (divided among 4 species bins and scaled to TPO county-level har-vest records). As a result, the transportation emissions associated with the routings selected in each simulation could be calculated using the emission factor calculated above (0.0214 kg C/m3/km). These emissions were summed over all selected mill-patch pairs within the sim-ulation to produce an estimate of total transport emis-sions. The carbon content of the total county-level volume of transported timber was estimated using a factor of 13.42 kg C/m3 of roundwood, the value given by Skog and Nicholson [45] as the carbon content of "Northern Rocky Mountain softwoods." Total emissions for each simula-tion were divided by the estimated carbon content of the transported wood to produce a ratio of fossil carbon emit-ted to product carbon transporemit-ted.
The average of this ratio over all simulations was taken as an estimate of the transportation emission rate, with the standard deviation providing a measure of uncertainty.
Competing interests
The authors declare that they have no competing interests.
Authors' contributions
SPH performed remote sensing, simulations and was pri-mary author; JAB performed cost-spread analysis: TAM, JS, and JBP analyzed historical TPO data and contributed to Discussion, DL and GJ contributed to simulation design, and GGM and LTD contributed to volume modelling and interpretation of FIA data. All authors read and approved the final manuscript.
Acknowledgements
The authors are grateful for strong support from the NASA Applied Sci-ences Program and the Rocky Mountain Research Station Inventory, Mon-itoring and Assessment Program. Thanks are also due to Jeffrey G. Masek and the NASA LEDAPS project for radiometric correction of Landsat imagery, and to the North American Forest Dynamics project for technical support and guidance. TPO data processing was supported by the USDA-CSREES Wood Utilization Research Program.
References
1. Woodbury PB, Smith JE, Heath LS: Carbon sequestration in the U.S. forest sector from 1990 to 2010. For Ecol and Management
2007, 241:14-27.
3. Lindholm E-L, Berg S: Energy requirement and environmental impact in timber transport. Scan J For Res 2005, 20(2):184-191. 4. González-García S, Berg S, Feijoo G, Moreira MT: Comparative environmental assessment of wood transport models: A case study of a Swedish pulp mill. Science of Total Environment
2009, 15;407(11):3530-9.
5. Sonne E: Greenhouse gas emissions from forestry operations: a life cycle assessment. J Environ Qual 2006, 35:1439-1450. 6. Johnson LR, Lippke B, Marshall JD, Comnick J: Life-cycle impacts of
forest resource activities in the Pacific Northwest and the Southeast United States. Wood Fiber Science 2005, 37:30-46. 7. Perez-Garcia J, Barr JK, Daniels JM: Washington's Sawmilling Sector
Analysis: Capacity Utilization Rates and Timber Outlook. CINTRAFOR Working Paper 99 Seattle: U Washington, Center for International Trade in Forest Products; 2005.
8. Smith BW, Miles PD, Vissage JS, Pugh SA: Forest Resources of the United States, 2002. General Technical Report NC-241 St. Paul, MN: US Dep. Agriculture, Forest Service, North Central Research Station; 2004. 9. Spoelma TP, Morgan TA, Dillon T, Chase AL, Keegan CE, DeBlander
LT: Montana's forest products industry and timber harvest, 2004. Resour. Bull. RMRS-RB-8 Fort Collins, CO: USDA, Forest Service, Rocky Mountain Research Station; 2008.
10. Morgan TA, Spoelma TP, Keegan CE, Chase AL, Thompson MT: Mon-tana logging utilization, 2002. Research Paper RMRS-RP-52 Fort Collins, CO: USDA, Forest Service, Rocky Mountain Research Station; 2005. 11. Healey SP, Cohen WB, Spies TA, Moeur M, Pflugmacher D, Whitley MG, Lefsky M: The relative impact of harvest and fire upon landscape-level dynamics of older forests: lessons from the Northwest Forest Plan. Ecosystems 2008, 11:1106-1119. 12. Franklin SE, Lavigne MB, Wulder MA, Stenhouse GB: Change
detec-tion and landscape structure mapping using remote sensing.
Forestry Chronicle 2002, 78(5):618-625.
13. Kennedy RE, Cohen WB, Schroeder TA: Trajectory-based change detection for automated characterization of forest disturbance dynamics. Rem Sens Env 2007, 110:370-386. 14. Kuemmerle T, Hoster P, Radeloff VC, Perzanowski K, Kruhlov I:
Post-Socialist forest disturbance in the Carpathian border region of Poland, Slovakia, and Ukraine. Ecological Applications
2007, 17(5):1279-1295.
15. Smith JE, Heath LS, Skog KE, Birdsey RA: Forest ecosystem carbon and harvested wood carbon tables and estimation methods for the United States. Gen. Tech. Rep. NE-343 USDA For. Serv., NE Res. Stn., New-town Square, PA; 2006.
16. Hyyppä J, Hyyppä H, Inkinen M, Engdahl M, Linko S, Zhu Y-H: Accu-racy comparison of various remote sensing data sources in the retrieval of forest stand attributes. For Ecol Man 2000, 128(1-2):109-120.
17. Keegan CE: Montana's forest products industry: a descriptive analysis
Bureau of Business and Economic Research, The University of Mon-tana, Missoula, MT; 1980.
18. Keegan CE, Jackson TP, Johnson MC: Montana's forest products indus-try: a descriptive analysis 1981 Bureau of Business and Economic Research, The University of Montana, Missoula, MT; 1983. 19. Keegan CE, Swanson LD, Wichman DP, VanHooser DD: Montana's
forest products industry: a descriptive analysis 1969-1988 Bureau of Busi-ness and Economic Research, The University of Montana, Missoula, MT; 1990.
20. Keegan CE, Wichman DP, Hearst AL, Polzin PE, VanHooser DD:
Montana's forest products industry: a descriptive analysis 1969-1994
Bureau of Business and Economic Research, The University of Mon-tana, Missoula, MT; 1995.
21. Keegan CE, Gebert KM, Chase AL, Morgan TA, Bodmer SE, Van-Hooser DD: Montana's forest products industry: a descriptive analysis 1969-2000 Bureau of Business and Economic Research, The Univer-sity of Montana, Missoula, MT; 2001.
22. Keegan CE, Morgan TA, Gebert KM, Brandt JP, Blatner KA, Spoelma TP: Timber-processing capacity and capabilities in the West-ern United States. J Forestry 2006, 104(5):262-268.
23. Morgan TA, Keegan CE, Spoelma TP, Dillon T, Hearst AL, Wagner FG, DeBlander LT: Idaho's forest products industry: a descriptive analysis. Resour. Bull. RMRS-RB-4 Fort Collins, CO: USDA, Forest Service, Rocky Mountain Res Station; 2004.
24. Schwaiger H, Zimmer B: A comparison of fuel consumption and greenhouse gas emissions fromforest operations in Europe. In Energy, carbon and other material flows in the Life Cycle Assessment of
forestry and forest products: Achievements of Working Group 1 of the COST Action E9 Edited by: Karjalainen T, Zimmer B, Berg S, Welling J, Schwaiger H, Finer L, Cortijo P. Discussion Paper 10. Eur. For. Inst., Joensuu, FinlanD; 2001:33-53.
25. Proctor P, Heath LS, VanDeusen PC, Gove JH, Smith JE: COLE: A web-based tool for interfacing with forest inventory data. In
Proc. of the 4th Annual Forest Inventory and Analysis Symp., New Orleans. 19-21 Nov. 2002 Gen. Tech. Rep. NC-252 Edited by: McRoberts RE, et al. USDA For. Serv. North Central Res. Stn., St. Paul, MN; 2005:167-172.
26. Birdsey RA: Carbon Accounting Rules and Guidelines for the United States Forest Sector. J Env Qual 2006, 35:1518-1524. 27. Reinhardt ED, Crookston NL, Technical Editors: The Fire and
Fuels Extension to the Forest Vegetation Simluator: Adden-dum to RMRS-GTR-116. 2009 [http://www.fs.fed.us/fmsc/fvs/doc uments/gtrs_ffeaddendum.php].
28. Goward SN, Masek JG, Cohen W, Moisen G, Collatz GJ, Healey S, Houghton RA, Huang C, Kennedy R, Law B, Powell S, Turner D, Wulder MA: Forest disturbance and North American carbon flux. EOS Transactions 2008, 89(11):105-116.
29. Healey SP, Cohen WB, Yang Z, Kennedy RE: Remotely sensed data in the mapping of forest harvest patterns. In Forest Distur-bance and Spatial Patterns: Remote Sensing and GIS Approaches Edited by: Wulder MA, Franklin SE. Taylor and Francis, CRC Press; 2007:63-84.
30. Olsson H: Changes in satellite-measured reflectances caused by thinning cuttings in boreal forest. Remote Sensing of Environ-ment 1990, 50:221-230.
31. Sader SA, Bertrand M, Wilson EH: Satellite change detection of forest harvest patterns on an industrial forest landscape. For-est Science 2003, 49(3):341-353.
32. Polagye BL, Hodgson KT, Malte PC: An economic analysis of bio-energy option using thinning from overstocked forests. Bio-mass and Bioenergy 2007, 31(2-3):105-125.
33. FIA Miles PD, Brand GJ, Alerich CL, Bednar LF, Woudenberg SW, Glover JF, Ezzell EN: The Forest Inventory and Analysis Database: Data-base Description and Users Manual Version 1.0. General Technical Report NC-218 St. Paul, MN: US Dep. Agriculture, Forest Service, North Central Research Station; 2001.
34. Masek JG, Huang C, Wolfe R, Cohen WB, Hall F, Kutler J, Nelson P: North American forest disturbance mapped from a decadal Landsat record. Rem Sens of Env 2008, 112:2914-2926.
35. Breiman L: Random Forests. Machine Learning 2001, 45:5-32. 36. Reams GA, Smith WD, Hansen MH, Bechtold WA, Roesch FA,
Moi-sen GG: The Forest Inventory and Analysis sampling frame. In The Enhanced Forest Inventory and Analysis Program - national sampling design and estimation procedures Edited by: Bechtold WA, Patterson PL. U.S. Dep. of Ag. Forest Service, Asheville, NC; 2005:11-26. 37. R Development Core Team: R: A language and environment for
statisti-cal computing 2008 [http://www.R-project.org]. (Vienna, Austria: R Foundation for Statistical Computing)
38. Freeman E, Frescino TS: modelmap: Creates Random Forest and Stochastic Gradient Boosting Models, and applies them to GIS .img files to build detailed prediction maps. R package version 1.1 2008.
39. Healey SP, Yang Z, Cohen WB, Pierce JD: Application of two regression-based methods to estimate the effects of partial harvest on forest structure using Landsat data. Rem Sens Env
2006, 101:115-126.
40. MTBS: Monitoring Trends in Burn Severity Project: Fire Perimeter Database, 1984-2006 [http://mtbs.gov/dataaccess.html]. accessed on 12 May, 2009.
41. Ruefenacht B, Finco MV, Nelson MD, Czaplewski R, Helmer EH, Blackard JA, Holden GR, Lister AJ, Salajanu D, Weyermann D, Win-terberger K: Conterminous US and Alaska forest type map-ping using Forest Inventory and Analysis data. PERS 2008, 74(11):1379-1389.
42. EIA: Energy Information Administration: Motor Vehicle Fuel Rates, 1973-2007 [http://www.eia.doe.gov/emeu/mer/pdf/pages/ sec1_17.pdf]. 5 August 2009.
Publish with BioMed Central and every scientist can read your work free of charge "BioMed Central will be the most significant development for disseminating the results of biomedical researc h in our lifetime."
Sir Paul Nurse, Cancer Research UK
Your research papers will be:
available free of charge to the entire biomedical community
peer reviewed and published immediately upon acceptance
cited in PubMed and archived on PubMed Central
yours — you keep the copyright
Submit your manuscript here:
http://www.biomedcentral.com/info/publishing_adv.asp
BioMedcentral 44. ESRI (Environmental Systems Research Institute): Cost-Spread
Algorithm description. 2009 [http://webhelp.esri.com/arcgisdesk top/9.3/index.cfm?TopicName=Cost%20Path].