R E S E A R C H A R T I C L E
Open Access
Prevalence of kidney damage in Chinese
elderly: a large-scale population-based
study
Honglan Wei
1†, Yaqiong Yan
2†, Jie Gong
2*and Junwu Dong
1*Abstract
Background:In China, both population aging and kidney damage has become emerging public health challenges. Despite the number of elders is huge, data on kidney damage in this population are scarce. The present study aimed to describe the prevalence of kidney damage among older adults in Wuhan, China.
Methods:To describe the prevalence of kidney damage among Chinese elderly, the health screening data of 350, 881 adults older than 65 years in Wuhan, China were collected and analyzed. Kidney damage was defined as eGFR less than 60 mL/min per 1·73 m2or the presence of proteinuria. Decreased renal function was defined as an eGFR < 60 mL/min/1.73 m2. Proteinuria was defined as urine protein≥1+ and without urine WBC or nitrite positive. The associated risk factors of eGFR decline and kidney damage were analyzed by multivariate logistic regression. Results:The age-standardized prevalence of kidney damage, decreased renal function and proteinuria was 17.2, 13.5 and 5.3%. Among the patients, up to 74.4% was stage 3. The prevalence of kidney damage and eGFR decline were higher in suburbs than in urban (18.3% vs 16.0 and 14.6% vs 12.4%). Factors independently associated with kidney damage were age, female, BMI, abdominal circumference, hypertension, diabetes, stroke and coronary heart disease.
Conclusions:Kidney damage has become an important public health problem in Chinese elderly. More attention should be paid to elderly lived in suburbs or rural area in our further work.
Keywords:Kidney damage, Epidemiology, Chinese elderly
Background
Population aging is an emerging worldwide public health challenge in the twenty-first century, which is especially prominent in low- and middle-income countries [1]. It is estimated that over 1.5 billion individuals worldwide will be 65 years or older by 2050 [1]. China is the world’s most populous country and the largest developing coun-try, in which population aging is particularly serious. China only used 18 years (1981–1999) to enter the aging society and the rate of aging is accelerating. According to the sixth national census in 2010, 118.8 million
Chinese were 65 years or older, accounting for 8.87% of the total Chinese population. The proportion rose 1.91 points than 10 years ago and was expected increase to 16.23% of the population in 2030 [2].
Aging is associated with an increased prevalence of chronic diseases, such as diabetes, hypertension, heart disease and stroke. Patients with these chronic diseases suffer from chronic kidney disease (CKD) risk multiplier. Except that, age is an independent risk factor of CKD [3]. In developing countries, CKD is highly prevalent [4]. Evidently, CKD, as a major global public health problem over the last decade, is especially prevalent in the elderly population in developing countries [5]. The costs of care at the elderly patients with CKD were huge [6].
Delayed diagnosis of CKD in the elderly potentially lead to further damage and increase the risk of death or disability [7]. Early identification and treatment of older
© The Author(s). 2019Open AccessThis article is distributed under the terms of the Creative Commons Attribution 4.0 International License (http://creativecommons.org/licenses/by/4.0/), which permits unrestricted use, distribution, and reproduction in any medium, provided you give appropriate credit to the original author(s) and the source, provide a link to the Creative Commons license, and indicate if changes were made. The Creative Commons Public Domain Dedication waiver (http://creativecommons.org/publicdomain/zero/1.0/) applies to the data made available in this article, unless otherwise stated. * Correspondence:[email protected];[email protected]
†Honglan Wei and Yaqiong Yan contributed equally to this work.
2
Wuhan Center for Disease Control and Prevention, Wuhan, Hubei 430000, People’s Republic of China
individuals with CKD are needed worldwide [7]. The in-cidence of acute kidney injury (AKI) is also higher in older CKD than in young people [8]. In China, despite the number of elders is huge, data on kidney damage (whether CKD or AKI) in this population are scarce. To our knowledge, there was no large-scale population-based studies described the prevalence of kidney damage in Chinese older adults. The present study aimed to de-scribe the prevalence of kidney damage among older adults in Wuhan, China.
Methods
Setting and participants
The design of this study was a population-based study of kidney damage among individuals older than 65 years in Wuhan, China. Wuhan consists of 17 districts and has 854, 833 elderly. Under a scheme launched by Wuhan municipal government, Wuhan Center for Disease Control and Prevention provided health screening for 372,990 older adults in 11 urban districts and 6 suburban districts from May 2012 to March 2013. The participants were voluntary and informed consent. The health screening included health status questionnaire (eg, age, sex, education, health history, smoking and alcohol consumption), blood pressure, height, weight, waist circumference and core laboratory tests, containing blood tests, urinalysis, liver function, kidney function, fasting plasma glucose (FPG), blood lipids, abdominal B ultrasound, ECG and chest X-ray. All blood and urine samples were analyzed at the central laboratory, which successfully completed a standardization and certifi-cation program. The individuals with abnormal physical or laboratory tests at screening were recommended to the related departments to review and treat in the general hospital.
Screening protocol and assessment criteria Proteinuria
Urinary protein was measured from a fresh morning spot urine sample with the Automatic Urine Analyzer (Roche Diagnostics, Germany). The result was reported as negative, trace, +, ++, +++ or ++++. Proteinuria was defined as urine protein≥1+ and without urine WBC or nitrite positive.
eGFR
To measure the estimated glomerular filtration rate (eGFR), blood was collected by venepuncture after an overnight fast of at least 10 h. Serum creatinine was measured with Jaffe’s kinetic. The Modification of Diet in Renal Disease (MDRD) equation for Chinese CKD patients was used to calculate the eGFR [9].
eGFR (mL/min/1.73 m2) = 175 × Scr(mg/dL)-1.24× age(year)-0.179[female× 0.79].
Decreased renal function was defined as an eGFR < 60 mL/min/1.73 m2. Kidney damage was defined as eGFR less than 60 mL/min per 1·73 m2or the presence of pro-teinuria. Renal function was classified based on eGFR as follows: G1 (eGFR≥90 ml/min/1.73 m2), G2 (eGFR, 60– 89 ml/min/1.73 m2),G3(eGFR, 30–59 ml/min/1.73 m2), G4 (eGFR,15–29 ml/min/1.73 m2
), G5 (eGFR< 15 ml/ min/1.73 m2).
Hypertension
All participants were measured the blood pressure by a mercury sphygmomanometer after quiet rest for at least 15 min. Systolic blood pressure (BP)≥140 mmHg or dia-stolic BP≥90 mmHg for two times, or with a history of hypertension and use of antihypertensive medication was defined as hypertension.
Diabetes
The fasting plasma glucose≥7 mmol/L, and/or 2-h post-prandial plasma glucose≥11.1 mmol/L, or with the his-tory of diabetes was defined as diabetes.
Hyperlipidemia
Hyperlipidemia was defined as total cholesterol≥6.22 mmol/L and (or) triglycerides≥2.26 mmol/L.
Obesity
Obesity was defined as body mass index (BMI) > 28, and central obesity was defined as a waist measurement > 85 cm for men or > 80 cm for women.
Statistical analysis
Data management and analyses were performed on SAS software, version 9.13 (SAS Institute, Cary, NC. USA). Continuous data were presented as mean ± SD. Mean com-parison was performed by t test. The age-standardized prevalence of kidney damage, decreased renal function and proteinuria were calculated using the direct standardization method. The standardized population is based on the popu-lation composition of the 6th National Census in 2010. The data comes from the National Bureau of Statistics of the People’s Republic of China. The ratio was compared by Chi-square test. The associated risk factors of eGFR decline and kidney damage was analyzed by multivariate logistic regression, and P-value less than 0.05 was taken as the threshold for statistical significance.
Results
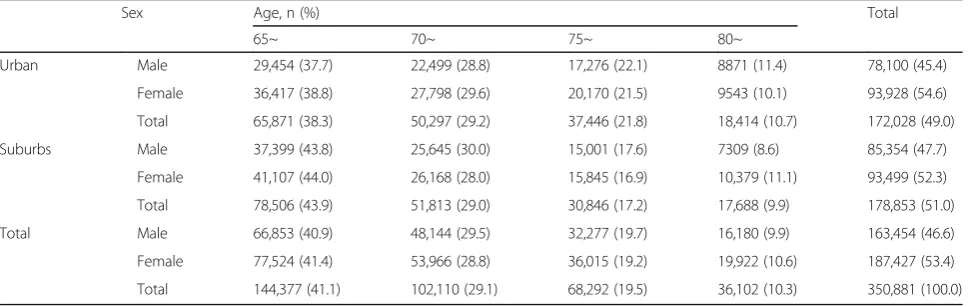
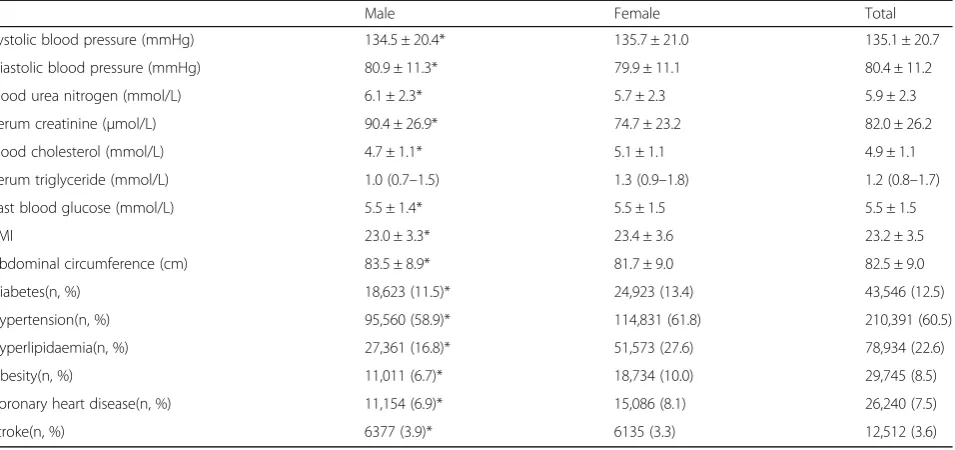
average age of urban participants was 72.2 ± 5.6 years, and the participants from suburban areas were 71.6 ± 5.6 years. Table 1 shows the distribution of age and sex in different districts. In total, 144,377 were 65 to 69 years, accounting for 41.1%. 29.1% of the participants were 70 to 74 years and 19.5% were 75 to 79 years. 10.3% were 80 years or older. The clinical characteristics of the study population are shown in Table2.
Prevalence of decreased renal function
In urban, 11.7% males and 11.4% females had de-creased renal function (p= 0.059). In suburbs, the proportion of eGFR< 60 mL/min/1.73 m2 was 11.0% in males, which was lower than in females (15.7%) (p= 0.000). In total, 11.4% male participants and 13.5% fe-male participants had decreased renal function (p = 0.000). The eGFR of 43,949 participants was lower than 60 mL/min/1.73 m2, accounting for 12.5%. The proportion of decreased renal function in suburbs participants was higher than in urban participants (13.4% versus 11.6%, p= 0.000) (Table 3). To research the prevalence of renal function decline in different age groups, the participants were divided into groups by 5-year ages. The percentages of G3 and G4 were increased with age both in urban and suburbs (p = 0.000). In urban, 0.2% was G5 in participants aged 80 years or older and in other groups was only 0.1%. In suburbs, the percentages of G5 had no difference in various groups. After adjusted for age, 11.8% partici-pants from urban were G3, which was lower than in suburbs (14.0%, p = 0.000). There was no difference of G4 and G5 percentages in urban and suburbs after adjusted for age. In total, 12.9% of participants was G3, 0.5% G4 and 0.1% G5 after adjusted for age (p = 0.000). The age-standardized prevalence of decreased renal function in urban was 12.4%, in suburbs was 14.6 and in total was 13.5%. (Table 4).
Prevalence of proteinuria
In urban, 4, 230 males had proteinuria, accounting for 5.4%, which was higher than in females (4.8%,p= 0.000). In suburbs, 4539 (5.3%) males and 4629(5.0%) females had proteinuria (p= 0.000). In all participants, the per-centage of proteinuria in males was 5.4%, which was higher than in females (4.9%, p= 0.000). In total, 17,858 (5.1%) participants had proteinuria and the prevalence of proteinuria in urban and suburbs was the same (Table5
and Fig.1). After adjusted for age, the percentage of pro-teinuria was 5.3% in all participants.
The prevalence of proteinuria was increased with age both in urban and suburbs. In group of age 70~74 years, 5.2% par-ticipants from urban had proteinuria, which was higher than in suburbs (p= 0.000). In other groups, the prevalence of proteinuria was higher in suburbs than in urban (p= 0.000, Fig.2). After adjusted with age, the percentage of proteinuria in suburbs was 5.4%, which was 5.2% in urban (p= 0.000).
Prevalence of kidney damage
Twelve thousand fifty-seven males from urban had kidney damage, accounting for 15.4%, which was higher than in suburbs (14.9%,p= 0.002). The prevalence of kidney dam-age in females from urban was 14.8%, which was lower than in suburbs (19.2%, p= 0.000). In total, 15.2% males and 17.0% females had kidney damage (p = 0.000). The prevalence of kidney damage in urban was 15.1%, which was lower than in suburbs (17.1%,p= 0.000) (Table5and Table 6). Fifty-six thousand five hundred forty-three (16.1%) participants had kidney damage, and the percent-age was 17.2% after adjusted for percent-age (Table5).
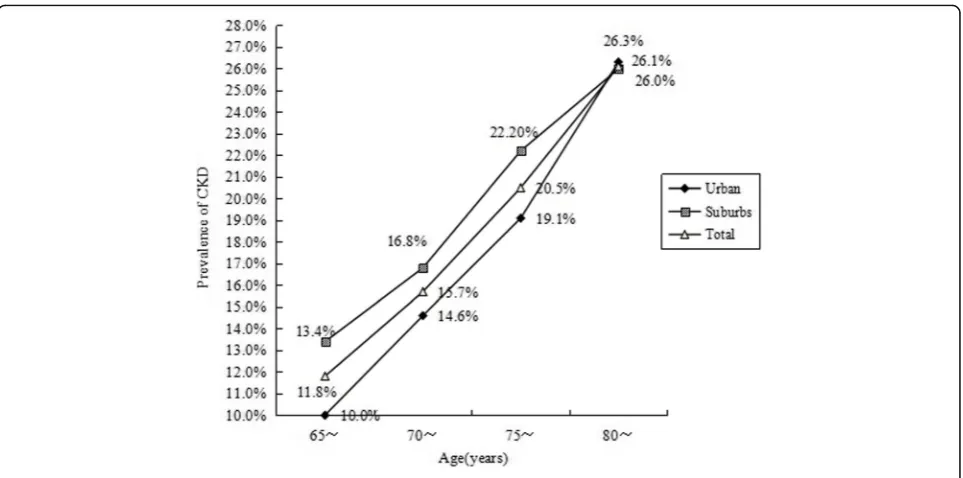
In the group of older than 80 years, 26.3% participants from urban had kidney damage, which was 26.0% in sub-urbs (p= 0.517). But in the groups of ages 65–69 years, 70-74 years and 75-79 years, the kidney damage preva-lence in urban was lower than in suburbs (p= 0.000). In total, 11.8% participants ages 65–69 years, 15.7% partici-pants ages 70–74 years, 20.5% participartici-pants ages 75–79
Table 1Age and sex distribution of study population
Sex Age, n (%) Total
65~ 70~ 75~ 80~
Urban Male 29,454 (37.7) 22,499 (28.8) 17,276 (22.1) 8871 (11.4) 78,100 (45.4)
Female 36,417 (38.8) 27,798 (29.6) 20,170 (21.5) 9543 (10.1) 93,928 (54.6)
Total 65,871 (38.3) 50,297 (29.2) 37,446 (21.8) 18,414 (10.7) 172,028 (49.0)
Suburbs Male 37,399 (43.8) 25,645 (30.0) 15,001 (17.6) 7309 (8.6) 85,354 (47.7)
Female 41,107 (44.0) 26,168 (28.0) 15,845 (16.9) 10,379 (11.1) 93,499 (52.3)
Total 78,506 (43.9) 51,813 (29.0) 30,846 (17.2) 17,688 (9.9) 178,853 (51.0)
Total Male 66,853 (40.9) 48,144 (29.5) 32,277 (19.7) 16,180 (9.9) 163,454 (46.6)
Female 77,524 (41.4) 53,966 (28.8) 36,015 (19.2) 19,922 (10.6) 187,427 (53.4)
years and 26.1% participants ages 80 years or older had kidney damage (p= 0.000, Fig.3).
In total, there were 56,543 participants had kidney dam-age. Among the kidney damage participants, 38,685 (68.4%) patients had eGFR decline, but without proteinuria; 12,594 (22.3%) patients with proteinuria and normal renal func-tion; only 5264 (9.3%) patients had both proteinuria and de-creased renal function. 42,081 (74.4%) was stage 3, 1545 (2.7%) stage 4 and only 323 (0.6%) was stage 5 .
Associated risk factors of eGFR decline and kidney damage
Age, sex, blood urea nitrogen, serum creatinine, blood cholesterol, serum triglyceride, fast blood glucose, BMI,
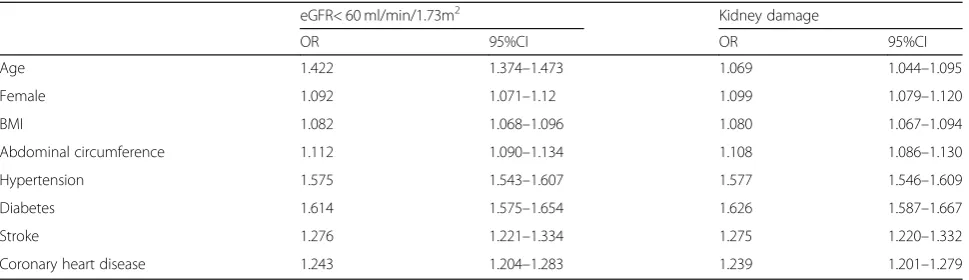
abdominal circumference, history of hypertension, dia-betes, hyperlipidaemia, obesity, stroke and coronary heart disease were analyzed by the multivariate logistic regression and age, female, BMI, abdominal circumfer-ence, history of hypertension, diabetes, stroke and cor-onary heart disease were all independently associated with eGFR decline and kidney damage (Table7).
Discussion
Although much is known about kidney damage in elderly, a great deal remains to be researched. To our knowledge, this study is the first large-scale population-based study to research the prevalence of kidney damage in Chinese eld-erly. In this study population, the age-standardized preva-lence of kidney damage, decreased renal function and proteinuria was 17.2, 13.5 and 5.3%. Based on these re-sults, 20.4 million Chinese aged 65 years or older have kid-ney damage, and 16.0 million have decreased renal function. Several studies have reported the high preva-lence of chronic kidney disease in Chinese [3, 10–14]. However, fewer large-scale population-based studies fo-cused on Chinese elderly [15]. We used the same standard to define urine protein and low eGFR as used in a large study from Taiwan, which showed 37.2% participants aged 65 years or older had CKD [10]. It is more than two times higher than our results. In the United States, the preva-lence of CKD among older adults ranges from 25.9 to 44% [16–18]. In Canada, 31 to 35.7% elderly had CKD when the eGFR was estimated by the MDRD equation [19–22]. In Northern Senegal, the prevalence of CKD in elderly was 14.3%, which was lower than our results [23].
Table 2Clinical characteristics of study population
Male Female Total
Systolic blood pressure (mmHg) 134.5 ± 20.4* 135.7 ± 21.0 135.1 ± 20.7
Diastolic blood pressure (mmHg) 80.9 ± 11.3* 79.9 ± 11.1 80.4 ± 11.2
Blood urea nitrogen (mmol/L) 6.1 ± 2.3* 5.7 ± 2.3 5.9 ± 2.3
Serum creatinine (μmol/L) 90.4 ± 26.9* 74.7 ± 23.2 82.0 ± 26.2
Blood cholesterol (mmol/L) 4.7 ± 1.1* 5.1 ± 1.1 4.9 ± 1.1
Serum triglyceride (mmol/L) 1.0 (0.7–1.5) 1.3 (0.9–1.8) 1.2 (0.8–1.7)
Fast blood glucose (mmol/L) 5.5 ± 1.4* 5.5 ± 1.5 5.5 ± 1.5
BMI 23.0 ± 3.3* 23.4 ± 3.6 23.2 ± 3.5
Abdominal circumference (cm) 83.5 ± 8.9* 81.7 ± 9.0 82.5 ± 9.0
Diabetes(n, %) 18,623 (11.5)* 24,923 (13.4) 43,546 (12.5)
Hypertension(n, %) 95,560 (58.9)* 114,831 (61.8) 210,391 (60.5)
Hyperlipidaemia(n, %) 27,361 (16.8)* 51,573 (27.6) 78,934 (22.6)
Obesity(n, %) 11,011 (6.7)* 18,734 (10.0) 29,745 (8.5)
Coronary heart disease(n, %) 11,154 (6.9)* 15,086 (8.1) 26,240 (7.5)
Stroke(n, %) 6377 (3.9)* 6135 (3.3) 12,512 (3.6)
*P< 0.05
Table 3The percentages of decreased renal function in urban and suburbs
Sex Grades, n (%) Total
G3 G4 G5
Urban Male 8698 (11.2) 382 (0.5) 77 (0.1) 9157 (11.7)
Female 10,217 (10.9) 419 (0.5) 102 (0.1) 10,738 (11.5)
Total 18,915 (11.0) 801 (0.5) 179 (0.1) 19,895 (11.6)
Suburbs Male 8939 (10.5) 369 (0.4) 63 (0.1) 9371 (11.0)
Female 14,227 (15.2) 375 (0.4) 81 (0.1) 14,683 (15.7) *
Total 23,166 (12.9) 744 (0.4) 144 (0.1) 24,054 (13.4) *
Total Male 17,637 (10.8) 751 (0.5) 140 (0.1) 18,528 (11.4)
Female 24,444 (13.0) 794 (0.4) 183 (0.1) 25,421 (13.5) *
Total 42,081 (12.0) 1545 (0.4) 323 (0.1) 43,949 (12.5)
In this study, we found 15.2% males and 17.0% females had kidney damage. It suggested that the prevalence of kidney damage was gender-different and females had a higher prevalence of kidney damage than males. The same phenomenon was revealed in some other large studies [24]. In Canada, Garg et al. reported 27.1% males and 38.8% females aged ≥65 years had CKD [20]; Hemmelgarn et al. found 32% males and 38.2% females aged≥66 years had CKD [21]. In Switzerland, the preva-lence of CKD in male and female participants older than 65 years was 12.9 and 35.9% when the eGFR was esti-mated by the MDRD equation [25]. In Australian aged 65 years or older, 51.8% males and 57.2% females had CKD when the eGFR was estimated with CG equation [26]. The researchers from Japan and Iceland also found the females elderly had a higher prevalence of CKD than males [27, 28], but the results of study from Italy was converse [29]. The mechanism of gender-different preva-lence of CKD is still unclear, which may be associated with the difference between females and males in glom-erular structure, glomglom-erular haemodynamics, and the hormone metabolism [30].
Our results revealed the prevalence of decreased renal function, proteinuria increased in parallel with age,
which was consistent with the results from Australia [26]. The studies from SardiNIA [31], Canada [20], USA [32], Italy [29], Norway [33] and Iceland [27] also re-ported that the prevalence of CKD was rising with in-creasing age.
Among the kidney damage participants, proteinuric kidney damage only accounted for 22.3%, but up to 74.4% patients was stage 3. In Canada elderly, the per-centage of CKD stage 3 was higher than CKD stage 4–5 in any age groups (by 5-years) and in any sex [20]. In Australia, up to 53.1% participants aged 65 years or older was CKD stage 3, but only 1.7% elderly had eGFR< 30 mL/min/1.73 m2 [26]. It suggested that the elderly with CKD mostly are CKD stage 3. Whether these patients’ renal function is persistently stable or rapid progress re-quires further observation. Focusing attention on elderly people with CKD stage 3 may prove to be a more cost-effective approach to preventing ESRD in elderly, al-though further work is required to confirm this hypoth-esis [34].
The data from the current study suggest that the prevalence of proteinuria in urban and suburbs residents was the same, but the prevalence of decreased renal function in suburbs residents was higher than in urban
Table 4The percentages of renal function decline in different age groups
Crude, n (%) Adjusted(95%CI)
65~ 70~ 75~ 80~
Urban
G3 4247 (6.5) 5266 (10.5) 5508 (14.7) 3894 (21.2) 11.8 (11.7–11.9)
G4 154 (0.2) 203 (0.4) 213 (0.6) 231 (1.3) 0.5 (0.48–0.52)
G5 52 (0.1) 54 (0.1) 42 (0.1) 31 (0.2) 0.1 (0.09–0.11)
Suburbs
G3 7631 (9.7) 6564 (12.7) 5294 (17.2) 3677 (20.8) 14.0 (13.9–14.1) *
G4 196 (0.3) 211 (0.4) 182 (0.6) 155 (0.9) 0.5 (0.48–0.52)
G5 50 (0.1) 44 (0.1) 30 (0.1) 20 (0.1) 0.1 (0.09–0.11)
Total
G3 11,878 (8.2) 11,830 (11.6) 10,802 (15.8) 7571 (21.0) 12.9 (12.8–13.0) *
G4 350 (0.2) 414 (0.4) 395 (0.6) 386 (1.1) 0.5 (0.48–0.52)
G5 102 (0.1) 98 (0.1) 72 (0.1) 51 (0.1) 0.1 (0.09–0.11)
*P< 0.05
Table 5Prevalence of decreased renal function, proteinuria and kidney damage
eGFR< 60 mL/min/1.73 m2 Proteinuria Kidney damage
Total (n)
Positive (n)
Prevalence (%)
Total (n)
Positive (n)
Prevalence (%)
Total (n)
Positive (n)
Prevalence (%)
Urban 172,088 19,895 11.6 172,088 8690 5.1 172,088 25,933 15.1
Suburbs 178,853 24,054 13.4* 178,853 9168 5.1 178,853 30,610 17.1*
Total 350,881 43,949 12.5 350,881 17,858 5.1 350,881 56,543 16.1
residents. The prevalence of kidney damage in suburbs residents was higher than in urban residents in any age groups. Zhang LX et al. reported that more rural resi-dents had CKD than urban resiresi-dents in Chinese general population (average age 49.6 ± 15.2 years) [3]. The result was consistent with ours. But in their study, fewer rural residents had eGFR decline than urban residents, but more had albuminuria [3]. It may because their partici-pants were younger than ours and the prevalence of eGFR decline was obviously lower than albuminuria (1.7% vs. 9.4%) [3]. In China, suburbs and rural residents are more to farm for a living. They often come into con-tact with pesticides at work or in life. Some study has re-ported that phosphate fertilizer is a main source of arsenic in areas affected with chronic kidney disease of unknown etiology in Sri Lanka [35]. Except that, for sub-urbs and rural residents, Medicare amount paid by the government is lower than urban residents. Therefore,
fewer suburbs and rural residents can have health care examination every year. Then, the diseases without spe-cial clinical symptoms, such as CKD, always are discov-ered late. To treat the end-stage renal disease, the expense will be much higher than treating early kidney disease. The government and population will bear a heavier financial burden, which will result in a vicious cycle in suburbs and rural areas [6]. It suggests that fo-cusing attention on elderly suburbs and rural residents may reduce the cost of kidney diseases effectively.
Strengths and limitations of the study
The present study is the first large-scale population-based study to research the prevalence of kidney damage in Chinese elderly. But it had several limitations. First, uric protein was only detected by dipstick urinalysis, which has less favorable diagnostic properties than urine albumin-creatinine ratio (ACR) for the assessment of Fig. 1Prevalence of proteinuria by sex in different districts
proteinuria [36]. To research the relationship between kidney function, proteinuria and adverse outcomes, Hemmelgarn BR et al. assessed proteinuria by urine dip-stick or ACR. Their results suggested that dipdip-stick urin-alysis can provide reliable prognostic information and the magnitude of excess risk observed with heavy pro-teinuria appeared similar whether assessed by dipstick or by ACR [37]. The research showed that both sensitivity and specificity of dipstick proteinuria were > 80% in older patients. Dongmin Lim et al. suggested that urine dipstick test can be used for screening in older outpa-tients with ACR ≥300 mg/g. However, they cannot rec-ommend the test as a screening tool with ACR≥30 mg/g as the reference owing to its low sensitivity [38]. Except that, ACR is much more expensive than dipstick urinaly-sis. The researchers from the USA which followed up the costs in a cohort of patients older than 50 years, the results showed that targeted annual microalbuminuria screening, relative to no screening, cost effective only in people with diabetes, hypertension, or both [39]. Second, the eGFR decline is associated with the age, the eGFR decline in elderly whether correlated with the diseases
progress is needed to further research. Third, eGFR was not directly measured in the study population. We only used the simplified Chinese MDRD Study equation to estimate eGFR, which may over- or underestimate the actual eGFR in the elderly. A study from German re-ported that the prevalence of CKD in the elderly was very variable based on the used estimating equation, which showed that prevalence of CKD (eGFR < 60 mL/ min/1.73 m2) was 34.3% by MDRD, 33.0% by CKD-EPI, and 14.6% by the CysC-based eGFR [19]. Further study will be needed to explore an equation which is more suitable for estimating eGFR of Chinese elderly. Fourth, this article is not a cross-sectional survey. The partici-pants based on voluntary consent, which may select less healthy people, such as hypertension or diabetes. In 2010, The 3rd Chronic Non-communicable Disease & Risk Factor Surveillance in China was conducted in 31 provinces and Xinjiang Production & Construction Corps, which showed the prevalence of hypertension and diabetes in Chinese adults aged > = 60 years were 66.9 and 19.6% [40]. In our participants, they were 60.5 and 12.5%. So we think the selection bias can be rule out.
Table 6Prevalence of kidney damage by sex in different districts
Crude, n (%) Adjusted for age
(%)(95%CI)
Male Female Total
Urban 12,057 (15.4) * 13,876 (14.8) 25,933 (15.1) 16.0 (15.9–16.1)
Suburbs 12,708 (14.9) 17,902 (19.2) * 30,610 (17.1) * 18.3 (18.2–18.4) *
Total 24,765 (15.2) 31,778 (17.0) * 56,543 (16.1) 17.2 (17.1–17.3)
*P< 0.05
Conclusions
Our results show that kidney damage has become an important public health problem in Chinese elderly. Among the older patients, stage 3 is prominent and spe-cial attention should be paid to which in our further work. We also found that decreased renal function in suburbs residents was higher than in urban residents, improve the income and medicare amount of which in future may alleviate the social financial burden effectively.
Abbreviations
95% CI:95% confidence interval; ACR: Albumin-creatinine ratio; AKI: Acute kidney diseas; BMI: Body mass index; BP: Blood pressure; CKD: Chronic kidney disease; eGFR: Estimated glomerular filtration rate; ESRD: End-stage renal disease; FPG: Fasting plasma glucose; MDRD: Modification of Diet in Renal Disease
Acknowledgements
Not applicable.
Authors’contributions
DJW and GJ conceived and designed the study. WHL screened the abstract and full text, assessed studies and drafted the manuscript. YYQ performed statistical analyses. GJ revised the manuscript. All authors read the manuscript and approved the final version.
Funding
Hubei Province Natural Science Fund 2014CFC1047 guided the design of the study.
and Wuhan Health and Family Planning Commission research projects WG15A02, WX18Q31 guided the collection, analysis, and interpretation of data and writing the manuscript.
Availability of data and materials
All data that support the conclusions of this manuscript are included within the article.
Ethics approval and consent to participate
The Biological and Medical Ethics Committee of Puai Hospital, Tongji Medical College, Huazhong University of Science and Technology (Wuhan, China) approved the study. All participants have written informed consent before the study.
Consent for publication
Not applicable.
Competing interests
The authors declare that they have no competing interests.
Received: 11 May 2019 Accepted: 16 August 2019
References
1. Ganguly S. Good health adds life to years. J Indian Med Assoc. 2012;110(4): 212–3.
2. Zhang KD, Guo P. Chinese population aging and the elderly status of blue book. Beijing: China Society Press; 2010.
3. Zhang LX, Wang F, Wang L, Wang W, Liu BC, Liu J, Chen MH, He Q, Liao YH, Yu XQ, Chen N, Zhang J, Hu Z, Liu HY, Hong DQ, Ma LJ, Liu H, Zhou XL, Chen JH, Pan L, Chen W, Wang WM, Li XM, Wang HY. Prevalence of chronic kidney disease in China: a cross-sectional survey. Lance. 2012;379(9818):815–22.
4. Nugent RA, Fathima SF, Feigl AB, Chyung D. The burden of chronic kidney disease on developing nations: a 21st century challenge in global health. Nephron Clin Pract. 2011;118(3):c269–77.
5. Glassock RJ, Warnock DG, Delanaye P. The global burden of chronic kidney disease: estimates, variability and pitfalls. Nat Rev Nephrol. 2017;13(2):104–14.
6. Chen B, Fan VY, Chou Y-J, Kuo C-C. Costs of care at the end of life among elderly patients with chronic kidney disease: patterns and predictors in a nationwide cohort study. BMC Nephrol. 2017;18:36–50.
7. Tonelli M, Riella M. Chronic kidney disease and the aging population. Nephrol Dial Transplant. 2014;29(2):221–4.
8. Holmes J, Phillips D, Donovan K, Geen J, Williams JD, Phillips AO. Acute kidney injury, age, and socioeconomic deprivation: evaluation of a national data set. Kidney Int Rep. 2019;6:824–32.
9. Ma YC, Zuo L, Chen JH, Luo Q, Yu XQ, Li Y, Xu JS, Huang SM, Wang LN, Huang W, Wang M, Xu GB, Wang HY. Modified glomerular filtration rate estimating equation for Chinese patients with chronic kidney disease. J Am Soc Nephrol. 2006;17(10):2937–44.
10. Wen CP, Cheng TY, Tsai MK, Chang YC, Chan HT, Tsai SP, Chiang PH, Hsu CC, Sung PK, Hsu YH, Wen SF. All-cause mortality attributable to chronic kidney disease: a prospective cohort study based on 462 293 adults in Taiwan. Lancet. 2008;371(9631):2173–82.
11. Chen W, Chen WQ, Wang H, Dong XQ, Liu QH, Mao HP, Tan JQ, Lin JX, Zhou FY, Luo N, He HJ, Richard JJ, Zhou SF, Yu XQ. Prevalence and risk factors associated with chronic kidney disease in an adult population from southern China. Nephrol Dial Transplant. 2009;24(4):1205–12.
12. Zhang L, Zhang P, Wang F, Zuo L, Zhou Y, Shi Y, Li G, Jiao S, Liu Z, Liang W, Wang H. Prevalence and factors associated with CKD: a population study from Beijing. Am J Kidney Dis. 2008;51(3):373–84.
13. Chen W, Liu Q, Wang H, Chen WQ, Johnson RJ, Dong XQ, Li HY, Ba S, Tan JQ, Luo N, Liu T, He HJ, Yu XQ. Prevalence and risk factors of chronic kidney disease: a population study in the Tibetan population. Nephrol Dial Transplant. 2011;26(5):1592–9.
14. Lin B, Shao L, Luo Q, Ou-yang L, Zhou F, Du B, He Q, Wu J, Xu N, Chen J. Prevalence of chronic kidney disease and its association with metabolic diseases: a cross-sectional survey in Zhejiang province, Eastern China. BMC Nephrol. 2014;15:36.
15. Liu W, Yu F, Wu YH, Fang XW, Hu WX, Chen J, Zhou RL, Lin XG, Hao WK. A retrospective analysis of kidney function and risk factors by chronic kidney
Table 7Factors associated with kidney damage
eGFR< 60 ml/min/1.73m2 Kidney damage
OR 95%CI OR 95%CI
Age 1.422 1.374–1.473 1.069 1.044–1.095
Female 1.092 1.071–1.12 1.099 1.079–1.120
BMI 1.082 1.068–1.096 1.080 1.067–1.094
Abdominal circumference 1.112 1.090–1.134 1.108 1.086–1.130
Hypertension 1.575 1.543–1.607 1.577 1.546–1.609
Diabetes 1.614 1.575–1.654 1.626 1.587–1.667
Stroke 1.276 1.221–1.334 1.275 1.220–1.332
disease epidemiology collaboration (CKD-EPI) equation in elderly Chinese patients. Ren Fail. 2015;37(8):1323–8.
16. Mazidi M, Rezaie P, Covic A, Malyszko J, Rysz J, Kengne AP, Banach M. Telomere attrition, kidney function, and prevalent chronic kidney disease in the United States. Oncotarget. 2017;8(46):80175–81.
17. National chronic kidney disease fact sheet: general information and national estimates on chronic kidney disease in the United States.http://www.cdc. gov/diabetes/pubs/pdf/kidney_Factsheet.pdf. 2010.
18. Stevens LA, Li S, Wang C, Huang C, Becker BN, Bomback AS, Brown WW, Burrows NR, Jurkovitz CT, McFarlane SI, Norris KC, Shlipak M, Whaley-Connell AT, Chen SC, Bakris GL, McCullough PA. Prevalence of CKD and comorbid illness in elderly patients in the United States: results from the kidney early evaluation program (KEEP). Am J Kidney Dis. 2010;55(3 Suppl 2):S23–33. 19. Rothenbacher D, Klenk J, Denkinger M, Karakas M, Nikolaus T, Peter R,
Koenig W, for the ActiFE Study Group. Prevalence and determinants of chronic kidney disease in community-dwelling elderly by various estimating equations. BMC Public Health. 2012;12:343.
20. Garg AX, Papaioannou A, Ferko N, Campbell G, Clarke JA, Ray JG. Estimating the prevalence of renal insufficiency in seniors requiring long-term care. Kidney Int. 2004;65(2):649–53.
21. Hemmelgarn BR, Zhang J, Manns BJ, Tonelli M, Larsen E, Ghali WA, Southern DA, McLaughlin K, Mortis G, Culleton BF. Progression of kidney dysfunction in the community-dwelling elderly. Kidney Int. 2006;69(12):2155–61. 22. Arora P, Vasa P, Brenner D, Iglar K, McFarlane P, Morrison H, Badawi A.
Prevalence estimates of chronic kidney disease in Canada: results of a nationally representative survey. CMAJ. 2013;185(9):E417–23.
23. Seck SM, Doupa D, Guéye L, Ba I. Chronic kidney disease epidemiology in northern Senegal a cross-sectional study. IJKD. 2014;8(4):286–91. 24. Carrero JJ, Hecking M, Chesnaye NC, Jager KJ. Sex and gender disparities in
the epidemiology and outcomes of chronic kidney disease. Nat Rev Nephrol. 2018;14(3):151–64.
25. Nitsch D, Felber DD, von EA GJM, Downs SH, Leuenberger P, Tschopp JM, Brndli O, Keller R, Gerbase MW, Probst-Hensch NM, Stutz EZ, Ackermann -Liebrich U, SAPALDIA team. Prevalence of renal impairment and its association with cardiovascular risk factors in a general population: results of the Swiss SAPALDIA study. Nephrol Dial Transplant. 2006;21(4):935–44. 26. Chadban SJ, Briganti EM, Kerr PG, Dunstan DW, Welborn TA, Zimmet PZ,
Atkins RC. Prevalence of kidney damage in Australian adults: the AusDiab kidney study. J Am Soc Nephrol. 2003;14(7 Suppl 2):S131–8.
27. Ninomiya T, Kiyohara Y, Kubo M, Tanizaki Y, Doi Y, Okubo K, Wakugawa Y, Hata J, Oishi Y, Shikata K, Yonemoto K, Hirakata H, Iida M. Chronic kidney disease and cardiovascular disease in a general Japanese population: the Hisayama study. Kidney Int. 2005;68(1):228–36.
28. Viktorsdottir O, Palsson R, Andresdottir MB, Aspelund T, Gudnason V, Indridason OS. Prevalence of chronic kidney disease based on estimated glomerular filtration rate and proteinuria in Icelandic adults. Nephrol Dial Transplant. 2005;20(9):1799–807.
29. Cirillo M, Laurenzi M, Mancini M, Zanchetti A, Lombardi C, De Santo NG. Low glomerular filtration in the population: prevalence, associated disorders, and awareness. Kidney Int. 2006;70(4):800–6.
30. Silbiger SR, Neugarten J. The role of gender in the progression of renal disease. Adv Ren Replace Ther. 2003;10(1):3–14.
31. Antonello P, Jennifer BG, Marco M, Doloretta P, Alice A, Maria GP, Liana F, Lenuta B, Nicolò C, Alessandro D, Francesco L, Gonçalo RA, David S, Francesco C. Prevalence of CKD and its relationship to eGFR related genetic loci and clinical risk factors in the SardiNIA study cohort. J Am Soc Nephrol. 2014;25(7):1533–44.
32. McClellan W, Warnock DG, McClure L, Campbell RC, Newsome BB, Howard V, Cushman M, Howard G. Racial differences in the prevalence of chronic kidney disease among participants in the reasons for geographic and racial differences in stroke (REGARDS) cohort study. J Am Soc Nephrol. 2006;17(6):1710–5. 33. Hallan SI, Coresh J, Astor BC, Asberg A, Powe NR, Romundstad S, Hallan HA,
Lydersen S, Holmen J. International comparison of the relationship of chronic kidney disease prevalence and ESRD risk. J Am Soc Nephrol. 2006; 17(8):2275–84.
34. Weiss JW, Boyd CM. Managing complexity in older patients with CKD. Clin J Am Soc Nephrol. 2017;12(4):559–61.
35. Jayasumana C, Fonseka S, Fernando A, Jayalath K, Amarasinghe M, Siribaddana S, Gunatilake S, Paranagama P. Phosphate fertilizer is a main source of arsenic in areas affected with chronic kidney disease of unknown etiology in Sri Lanka. Springerplus. 2015;4(1):1–8.
36. Ciavarella A, Silletti A, Forlani G, Morotti L, Borgnino LC, D’Apote M, Vannini P. A screening test for microalbuminuria in type 1 (insulin-dependent) diabetes. Diabetes Res Clin Pract. 1989;7(4):307–12.
37. Hemmelgarn BR, Manns BJ, Lloyd A, James MT, Klarenbach S, Quinn RR, Wiebe N, Tonelli M. Relation between kidney function, proteinuria, and adverse outcomes. JAMA. 2010;303(5):423–9.
38. Lim D, Lee D-Y, Cho SH, Kim OZ, Cho SW, An SK, Kim HW, Moon KH, Lee MH, Kim B. Diagnostic accuracy of urine dipstick for proteinuria in older outpatients. Kidney Res Clin Pract. 2014;33(4):199–203.
39. Hoerger TJ, Wittenborn JS, Segel JE, Burrows NR, Imai K, Eggers P, Pavkov ME, Jordan R, Hailpern SM, Schoolwerth AC, Williams DE. A health policy model of CKD: 2. The cost-effectiveness of microalbuminuria screening. Am J Kidney Dis. 2010;55(3):463–73.
40. Wang ZH, Wang LH, Li YC, Zhang M, Hu N, Wang LM. Current status of diabetes, hypertension and dyslipidemia among older Chinese adults in 2010. Chin J Prev Med. 2012;46(10):922–6.
Publisher’s Note