R E S E A R C H
Open Access
PathNet: a tool for pathway analysis using
topological information
Bhaskar Dutta, Anders Wallqvist and Jaques Reifman
*Abstract
Background:Identification of canonical pathways through enrichment of differentially expressed genes in a given pathway is a widely used method for interpreting gene lists generated from high-throughput experimental studies. However, most algorithms treat pathways as sets of genes, disregarding any inter- and intra-pathway connectivity information, and do not provide insights beyond identifying lists of pathways.
Results:We developed an algorithm (PathNet) that utilizes the connectivity information in canonical pathway descriptions to help identify study-relevant pathways and characterize non-obvious dependencies and connections among pathways using gene expression data. PathNet considers both the differential expression of genes and their pathway neighbors to strengthen the evidence that a pathway is implicated in the biological conditions
characterizing the experiment. As an adjunct to this analysis, PathNet uses the connectivity of the differentially expressed genes among all pathways to score pathway contextual associations and statistically identify biological relations among pathways. In this study, we used PathNet to identify biologically relevant results in two Alzheimer’s disease microarray datasets, and compared its performance with existing methods. Importantly, PathNet identified de-regulation of the ubiquitin-mediated proteolysis pathway as an important component in Alzheimer’s disease progression, despite the absence of this pathway in the standard enrichment analyses.
Conclusions:PathNet is a novel method for identifying enrichment and association between canonical pathways in the context of gene expression data. It takes into account topological information present in pathways to reveal biological information. PathNet is available as an R workspace image from http://www.bhsai.org/downloads/ pathnet/.
Keywords:Canonical pathways, Pathway enrichment, Pathway association, Pathway interaction, Pathway topology
Background
High-throughput technologies enable the study of bio-logical processes at the systems level. However, analyzing the large amount of data generated by high-throughput techniques and translating these data into biological knowledge is currently a critical bottleneck in systems biology. To study a disease at the system level, DNA microarrays are routinely used to provide a comparison of gene expression patterns in control vs. disease condi-tions. Because this comparison usually reveals a large number of differentially expressed genes, it is difficult, if not impossible, to analyze the effect of each gene indi-vidually. In addition, high-throughput data often contain
considerable noise, making individual or isolated gene observations less likely to be relevant. Using statistical methods to summarize the data can help reduce noise and increase the reproducibility of the results [1]. However, translating these results into biological know-ledge remains challenging.
The most commonly used methods for summarizing gene expression data rely on enrichment analysis of dif-ferentially expressed genes to identify and rank Gene Ontology (GO) terms and canonical pathways in order to characterize the underlying biological nature of the data. Comprehensive reviews of these approaches are available [2-4]. While the hierarchically ordered GO terms describe the properties of gene products, canon-ical pathways describe the connectivity between genes and gene products involved in a given biological pro-cess. The simplest and most widely used method for * Correspondence:[email protected]
DoD Biotechnology High Performance Computing Software Applications Institute, Telemedicine and Advanced Technology Research Center, U.S. Army Medical Research and Materiel Command, Ft. Detrick, MD 21702, USA
identifying pathways based on gene expression data is the hypergeometric test [5], which assesses whether the number of differentially expressed genes in a pathway is significantly higher than what would be expected by chance. A popular alternative to the hypergeometric test for assessing the relevance of pathways is the gene set enrichment analysis (GSEA) [6]. This method considers the relative positions of pre-defined gene sets (pathways) in a rank-ordered list of differentially expressed genes, in order to determine if a pathway is relevant to the experi-mental study.
Well-studied canonical pathways provide extensive in-formation about how the genes and gene products inter-act and regulate each other. However, most of the pathway analysis methods, including the hypergeometric test and GSEA, treat pathways as lists of genes and do not take into account the connectivity information em-bedded within the pathway. More recently, some studies [7-9] have included such topological information for calculating enrichment of signaling pathways, by assign-ing different weights to genes based on their location in the pathway. Nevertheless, these methods still consider each pathway as an isolated entity, where, in reality, pathways are not isolated; they may share genes. In fact, out of 130 non-metabolic pathways from the Kyoto Encyclopedia of Genes and Genomes (KEGG) database [10], 88 pathways have 20% or fewer genes unique to that pathway, while only 6 pathways have 80% or more unique genes. In fact, all pathways shared at least one gene with another pathway. Thus, to fully take into ac-count the biological information collected and encoded in a database such as KEGG, all pathways should be pooled together to allow for exploitation of inter-pathway connectivity information. However, none of the current methods for pathway analysis incorporates intra-and inter-pathway connectivity information for enrich-ment analysis.
In this study, we have attempted to address these issues by developing an algorithm for examining path-way enrichment that uses differential gene expression (or other molecular profiling data) to analyze Pathways based on Network information (PathNet). To incorpor-ate inter-pathway connectivity, we combined KEGG pathways (from www.kegg.com) to create apooled path-way. For enrichment analysis, PathNet first identifies the association of each gene with a disease (referred to as direct evidence) by comparing gene expression data in control patients vs. patients with the disease. Then, PathNet identifies the association of each gene’s neigh-bors with the disease (referred to as indirect evidence) based on the inter- and intra-pathway connectivity infor-mation present in the pooled pathway. Finally, PathNet combines the direct and indirect evidences to obtain the significance of the combined evidence. Based on the
statistical significance of the combined evidence for all genes, PathNet uses the hypergeometric test to uncover the pathways associated with the disease.
As genes in pathways function in a coordinated fash-ion, association studies between pathways in the context of gene expression data can unravel the underlying com-plexity of biological processes. Li et al. [11] proposed that pathways are more likely to interact when the num-ber of protein-protein interactions (PPI) between pro-teins from two pathways are greater than what would be expected by chance. Based on this assumption, they cre-ate a network of pathways and identify the activcre-ated pathway modules in a given study by mapping the gene expression data enriched pathways onto the network. Recently, Kelder et al. [12] identified indirect associa-tions between pathways by integrating pathway informa-tion, PPI networks, and gene expression data. Liu et al. [13] estimated crosstalk by mapping gene expression on PPIs between proteins from the Alzheimer’s disease (AD) pathway and other pathways sharing genes with the AD pathway. As PPI networks are usually noisy, identifying indirect associations using PPI network might produce false positive associations. In contrast with other approaches, PathNet assesses the association in the context of gene expression data based on intra-and inter-pathway connectivity in the pooled pathway. This association of specific pathways, beyond the mere overlap of genes annotated as belonging to more than one pathway, can reveal otherwise hidden pathway de-pendencies (and hence biological insights) that are not directly attainable from enrichment analysis alone.
To illustrate the utility of PathNet, we applied it to two AD microarray datasets and analyzed the results in the context of existing knowledge. In addition, we show how the statistical scores of the associations between pathways through gene expression data facilitated the identification of a biological association between the AD pathway and ubiquitin-meditated proteolysis pathway.
Methods
Pathway network from KEGG pathways
Additional file 1. All 130 pathways were combined to create apooled pathway, and the R package, named ‘An interface to the BOOST graph library,' from Bioconductor (http://www.bioconductor.org/packages/rel-ease/bioc/html/ RBGL.html) was used to convert this information into the adjacency matrix (A). The adjacency matrix is a non-symmetric square matrix, where the number of rows (and columns) represents the number of genes present in the pooled pathway. The diagonal elements of matrix A were set to zero to exclude self-interactions. The non-diagonal element Aijrepresents the directed KEGG protein interaction between nodesiandj:
Aij¼ 1 if there is an interaction from nodeito nodej 0 otherwise
ð1Þ
In the case of a bidirectional interaction, two edges are introduced, one from nodeito nodejand another from node j to node i. Although the bulk of the genes annotated in KEGG pathways are present on most microarray chips, about 10% of the genes are typically
missing. In order to only include information derived from experimental data, we re-constructed the adjacency matrix for each chip-set by deleting rows and columns of genes that were not examined experimentally. In order to be consistent in the analysis presented below, we also redefined thepooled pathwayfor each chip-set to include only genes for which experimental data exists. PathNet automatically carries out this step from the input files.
Pathway enrichment analysis
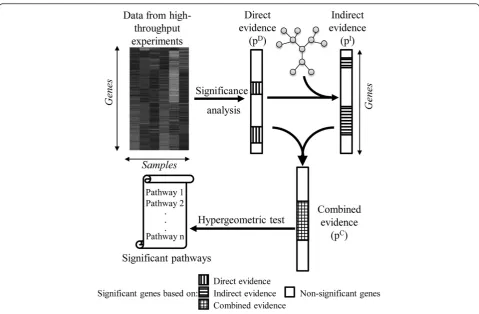
PathNet combines two types of evidence for pathway enrichment analysis, referred to as direct evidence and indirect evidence (Figure 1). Direct evidence accounts for the differential expression of gene i between two experimental conditions (control and disease), while indirect evidence considers the differential expression of the neighbors of gene i in thepooled pathway. The nominal p-values associated with the direct and indirect evidences of each gene were combined to obtain the p-value of the combined evidence,which is subsequently used for the pathway enrichment analysis.
We used the t-test to calculate a nominal p-value for the direct evidence (piD) in order to gauge whether the average expression of gene i was different between the two experimental conditions. The lower the pD-value, the more likely it is that the observed difference in gene expression is significant. Alternative methods, such as SAM [14] or ANOVA [15], can also be used to estimate pD.
To ascertain the significance of the indirect evidence, we need to test whether the expression of each neighbor of gene i is or is not different between the two experi-mental conditions. To characterize this difference, we first calculated the indirect evidence score (SIi), which
incorporates the topological information of the path-ways. This score captures a weighted level of differential expression of the neighbors of gene i, and is calculated using the following equation:
SIi¼ X j∈G;i≠j
Aij log10 pDj
ð2Þ
where G denotes the set of all genes present in the pooled pathway, Aij is defined as in Eq. (1), and pjD denotes the nominal p-value of the direct evidence for gene jwhich is used to assign the weight of the contri-bution. The nominal p-value associated with the indirect evidence (piI) was inferred by testing if the observed score SIi was greater than the corresponding random values created by shuffling the pjD-values in the pooled pathway. In each of the N shuffles, all pjD-values were scrambled by randomly re-assigning their indices. As the connectivity in the pooled pathway remained fixed, for each gene i in the nth shuffle, we calculated the corre-sponding random score SIiR(n). Next, for each genei, we formally re-constructed the probability density distribu-tion funcdistribu-tion for the random scores piR. Practically, we estimated the piI-values by counting the number of ran-dom scores larger than the actual scores, as follows:
pIi≡
Z1
SIi
PRið Þx dx≈1 N
XN
n¼1
1 ifSIR
ið Þn >SIi 0 otherwise
ð3Þ
In our calculations, we used N = 2,000 shuffles. As the estimated piI-values are integer multiples of 1/N, we cannot accurately estimate piI-values if they are less than 1/N. To address this issue, we assigned 1/N as the mini-mum piI-value. The lower the piI-value, the more likely it is that the observed weighted gene expression pattern around geneiis not a random pattern.
We obtained the p-value of the combined evidence (piC) for each geneiby using Fisher’s method [16] to ag-gregate the nominal p-values associated with the direct
and indirect evidences (piD and piI). Previous studies [17,18] have shown that this method is optimal for com-bining independent p-values, when compared to other methods. In our case, the indirect evidence associated with a gene is dependent only on the magnitude of the differential gene expression of its neighbors, and not on its own expression levels, which formally ensures inde-pendence between the p-values. Additional file 2 shows pD- versus pI-values for the datasets we used and there was no obvious dependency of these values on each other. We also verified that the set of pD- and pI -values were linearly independent for all comparisons by calculating a non-significant correlation coefficient in each test set. Accordingly, for genei, the two probabilities were combined based on Fisher’s method, using the following equation:
pCi ¼
Z1
2ln pD ipIi
ð Þ
P χ24 ð4Þ
where P(χ42) denotes the probability density function of the χ2distribution with 4 degrees of freedom. Note that, even if the pD- and pI-values were correlated, they could still be combined using a modified version of Fisher’s method [19].
For genes that are isolated and not connected in any pathway, there are no pI-values to consider, hence pC= pD. Finally, we selected genes with piC < 0.05 as differentially expressed and used the hypergeometric test to calculate pathway enrichment. For all hypergeometric tests, we used the‘phyper’function of the R programming language.
Contextual association between pathways
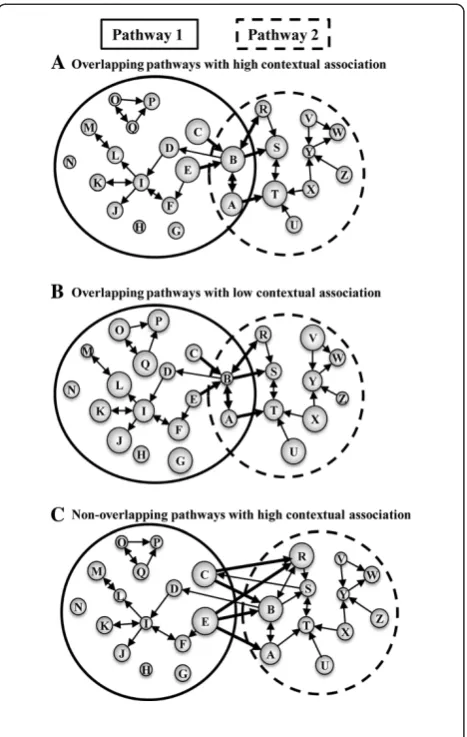
As discussed above, KEGG pathways are not isolated; some genes are shared between pathways. Thus, differ-ential gene expression in one pathway may be directly linked to differential gene expression in another path-way. Whereas the existing pathway annotations provide a static association among genes and pathways, gene expression data for particular conditions provide context-dependent information. Here, we considered all connections in the pooled pathway to identify possible contextual pathway-pathway associations based on a weighted measure of differential gene expression among shared pathway genes. Figure 2 outlines three ways in which differential gene expression data can link two pathways that either directly share genes or are linked via gene connections annotated in other pathways.
α and β. The SCαβfrom pathwayα to pathway βis cal-culated using the following equation:
SCαβ¼
X
i∈gα X
j∈gβ
Aij log10 pDi
log10 pDj
ð5Þ
where gα and gβ denote the set of genes in pathway α and β, respectively, Aij is defined as in Eq. (1), and pi/jD denotes the nominal p-value of the direct evidence for gene i/j used to construct the weight for each Aijvalue. Note that as Aii≡0, the SCαβdoes not contain self inter-actions and only includes gene pairs that have been con-nected to each other via the pooled pathway. The formulation uses only the pD-values associated with the direct evidence and not the pC-values, which already contain pathway information via the indirect evidence as calculated in Eq. (2). A higher SCαβ indicates a stronger contextual association between the pathways.
To evaluate the probability of finding a SCαβ greater than expected by chance alone, we followed the same procedure used to estimate the p-values for the indirect evidence. The p-value associated with the SCαβ(pαβ) was inferred by testing if the observed score SCαβ were greater than the corresponding random values created by shuffling all the pD-values in the pooled pathway N times. With the connectivity in the pooled pathway fixed, for each pathway pair α and β in the nth shuffle, we calculated the corresponding random score SCαβR(n). We then formally re-constructed, for each pathway pair
α and β, the probability density distribution function for the random scores PαβR. Finally, we estimated the pαβ-values by counting the number of random scores larger than the actual scores for each pathway pair:
pαβ≡
Z1
SCαβ
PRαβð Þx dx≈1 N
XN
n¼1
1 ifSCR
αβð Þn >SCαβ
0 otherwise
ð6Þ
We usedN= 2,000 shuffles to estimate the pαβ-values. The lower the pαβ-value, the more likely it is that the observed weighted gene expression pattern connecting pathwaysαandβare not a random pattern.
We also tested the extent to which the genes from pathways α and βoverlap, based on common genes be-tween the pathways. This information is only based on the KEGG database and is not dependent on gene ex-pression data, i.e., we used the full complement of KEGG genes to estimate this overlap. The hypergeo-metric test was used to estimate if the observed overlap was statistically significant.
Figure 2Schematic representation of three scenarios of contextual association between pathways.Each illustration (A-C) shows two pathways (sets of both connected and isolated genes inside ellipsoids) with varying degrees of overlapping genes. The size of the circles (genes) represents the level of differential gene expression between control and disease patients (the higher the significance associated with the expression change, the larger the circle). The lines and arrows represent KEGG-derived interactions between genes as annotated in thepooled pathway, and the thick lines represent edges connecting genes from Pathway 1 to Pathway 2. (A) Overlapping pathways with high contextual association. Whereas Pathway 1 and Pathway 2 can be associated because genesAandBare shared between the two pathways, the fact that overlapping genes are directly connected to other differentially expressed genes (thick connections to large circles) enhances this association. (B) Overlapping pathways with low contextual association. The pathway maps are exactly the same as in case (A). However, Pathway 1 is“less”associated with Pathway 2 in the context of gene expression data, as the genes connected by thick edges are modestly differentially expressed (thick connections to small circles). (C) Non-overlapping pathways with high contextual association. Although, Pathway 1 and Pathway 2 do not share any genes, genes from these two pathways are connected based on inter-pathway connectivity inferred from thepooled pathway.
Microarray datasets
We evaluated the performance of the PathNet algorithm using two microarray datasets generated by two different research groups. Both datasets were downloaded from the National Center for Biotechnology Information’s Gene Ex-pression Omnibus (GEO) database (http://www.ncbi.nlm. nih.gov/geo/) and involved AD-related studies. The first dataset (GEO ID: GDS810) [20], which we refer to as the disease progression dataset, investigated the expression profile of genes from the hippocampal region of the brain as a function of the progression of the disease (incipient, moderate, and severe). We refer to the second dataset [21] as the brain regions dataset. This dataset examined the effect of AD in six different brain regions: the entorhinal cortex, hippocampal field CA1, middle temporal gyrus, posterior cingulate cortex, superior frontal gyrus, and pri-mary visual cortex (GEO ID: GSE5281). Because different regions of the brain are involved in controlling different biological processes, this dataset can provide insights into the tissue-specific activation of pathways. The entorhinal cortex region samples were obtained from patients in the early stages of AD, while the remaining samples were obtained from patients in the later stages of the disease.
In thedisease progression dataset, the expression of each gene in patients with incipient, moderate, and severe dis-ease was compared with control patients using the t-test. In the brain regions dataset, gene expression was compared between diseased and control patients for each brain region. We applied the proposed pathway enrichment method for each of these nine comparisons (three from thedisease pro-gression datasetand six from thebrain regions dataset).
Results and discussions
Comparison of PathNet with existing algorithms in identifying pathways biologically relevant to AD
We used PathNet to identify the enrichment of pathways in each of the nine comparisons described above. We also compared the results of PathNet with three existing algo-rithms for pathway analysis that are currently in wide use: the hypergeometric test [5]; gene set enrichment analysis (GSEA) [6]; and signaling pathway impact analysis (SPIA) [8]. The GSEA and SPIA packages were downloaded from the Broad Institute (http://www.broadinstitute.org/gsea/ index.jsp) and Bioconductor (http://www.bioconductor. org) Web sites, respectively. For GSEA, we used the pro-vided Java-version of the program with a pre-ranked gene list. To ensure the comparability of results, we used the same version of the KEGG pathways (downloaded in November 2010) for all comparisons. Finally, to account for multiple comparisons, we corrected the pathway enrichment p-values for family-wise error rate (corrected p-values are represented as pFWER) and used a significance threshold of 0.05 for all comparisons. The results of all nine comparisons using each of the four pathway analysis
methods are provided in Additional file 3, Additional file 4, and Additional file 5. Here, we summarize the results and the biological relevance of our findings.
Our primary aim was to determine if these methods could identify whether the AD pathway (KEGG ID: 5010) is significantly enriched in AD patients vs. control patients. Figure 3 shows the degree of enrichment of the AD pathway for each of the comparisons, as measured by pFWER. Figure 3A shows that using the disease progression dataset,none of the methods could identify significant enrichment in the AD pathway during the early (incipient) stages of the disease. As the disease pro-gresses, the significance of the enrichment increased in all four methods. During the late (severe) stages of the disease, three of the four methods could identify signifi-cant enrichment in the AD pathway. Notably, at moder-ate stages of the disease, only PathNet was able to determine that the AD pathway was significantly enriched in AD patients.
In the brain regions dataset, all of the methods could identify significant enrichment of the AD pathway in the middle temporal gyrus region and posterior cingulate cortex regions, however, none identified AD enrichment in the entorhinal cortex or superior frontal gyrus regions (Figure 3B). One plausible reason is that the entorhinal cortex samples were from patients with incipient disease. Interestingly, only PathNet could identify significant en-richment of the AD pathway in the primary visual cor-tex. There is strong evidence in the literature that the primary visual cortex region is indeed affected by AD [22,23]; hence, this is likely not a false positive finding. In each of the comparisons, PathNet consistently yielded the lowest p-value (pFWER) for the AD pathway.
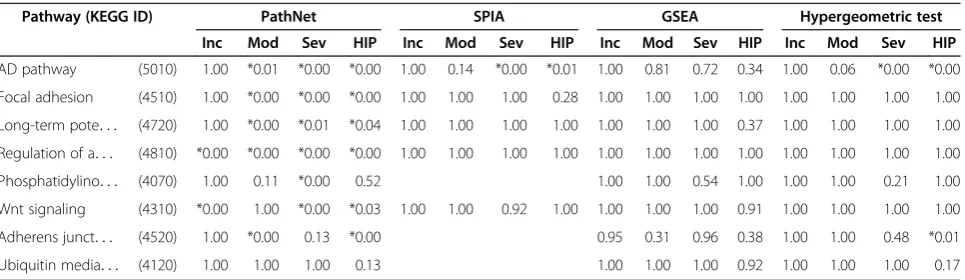
To test the sensitivity of PathNet with respect to the other three pathway analysis methods, we compared the enrichment levels of seven pathways that have been fre-quently associated with AD in the literature. Table 1 shows the results from the three stages of the disease using thedisease progression dataset, with samples taken from the hippocampus region of the brain, and the results in the brain regions dataset, with samples from the hippocampal field CA1. PathNet correctly identified most of these pathways as significantly enriched while the other three methods failed to do so. The complete set of results is provided in Additional file 3, which cor-roborates the favorable performance of PathNet.
To test the specificity of PathNet, we investigated the biological relevance of pathways co-enriched with the AD pathway. Table 2 shows that in six out of the nine comparisons where the AD pathway was enriched, we analyzed pathways co-enriched with the AD pathway. Eight pathways were co-enriched with the AD pathway in five or more of the six cases. Of these eight pathways, six were related either to AD (regulation of actin cyto-skeleton; adherens junction; focal adhesion; and
long-term potentiation) or to other neurological diseases (Parkinson’s disease and Huntington’s disease). Both the Parkinson’s disease pathway and the Huntington’s disease pathway show significant overlap with the AD pathway, which explains why they were frequently co-enriched. There is evidence in the literature to support the association of each of these co-enriched pathways with AD. This qualitatively implies that most of the sig-nificantly enriched pathways identified by PathNet are unlikely to be biological false positives.
The samples from thedisease progression datasetwere collected from the hippocampal field CA1 region. Simi-larly, the brain regions dataset provides results of sam-ples for patients with severe disease with samsam-ples also collected from the hippocampal field CA1 region. There-fore, the data from these two samples, collected in the hippocampus for severe AD patients, should be compar-able and the overlap of their significantly enriched path-ways can be considered as a measure of the quality of the pathway analysis methods. Figure 4 shows the num-ber of significantly enriched pathways from each dataset and their overlaps. We used the hypergeometric test to compute the significance of the overlap, where the results suggest that PathNet yielded the highest level of significance in overlap when compared to the other methods.
In summary, we compared the results obtained when using PathNet for pathway analysis vs. the results obtained with three existing widely used methods. We found that PathNet was able to:1)identify the AD path-way as significant in cases where the existing methods failed; 2) detect significantly enriched pathways that are known to be biologically relevant to AD; and3)detect a higher level of significance in overlap of the enriched pathways in two independent datasets that are expected to be comparable.
Table 1 Enrichment of pathways associated with AD
Pathway (KEGG ID) PathNet SPIA GSEA Hypergeometric test
Inc Mod Sev HIP Inc Mod Sev HIP Inc Mod Sev HIP Inc Mod Sev HIP
AD pathway (5010) 1.00 *0.01 *0.00 *0.00 1.00 0.14 *0.00 *0.01 1.00 0.81 0.72 0.34 1.00 0.06 *0.00 *0.00
Focal adhesion (4510) 1.00 *0.00 *0.00 *0.00 1.00 1.00 1.00 0.28 1.00 1.00 1.00 1.00 1.00 1.00 1.00 1.00
Long-term pote. . . (4720) 1.00 *0.00 *0.01 *0.04 1.00 1.00 1.00 1.00 1.00 1.00 1.00 0.37 1.00 1.00 1.00 1.00
Regulation of a. . . (4810) *0.00 *0.00 *0.00 *0.00 1.00 1.00 1.00 1.00 1.00 1.00 1.00 1.00 1.00 1.00 1.00 1.00
Phosphatidylino. . . (4070) 1.00 0.11 *0.00 0.52 1.00 1.00 0.54 1.00 1.00 1.00 0.21 1.00
Wnt signaling (4310) *0.00 1.00 *0.00 *0.03 1.00 1.00 0.92 1.00 1.00 1.00 1.00 0.91 1.00 1.00 1.00 1.00
Adherens junct. . . (4520) 1.00 *0.00 0.13 *0.00 0.95 0.31 0.96 0.38 1.00 1.00 0.48 *0.01
Ubiquitin media. . . (4120) 1.00 1.00 1.00 0.13 1.00 1.00 1.00 0.92 1.00 1.00 1.00 0.17
Enrichment (pFWER: family-wise error rate corrected p-values) of pathways associated with Alzheimer’s disease (AD) using four different pathway analysis methods
(i.e., PathNet: the present study,SPIA: signaling pathway impact analysis,GSEA: gene set enrichment analysis, and the hypergeometric test), from thedisease
progression dataset(Inc: incipient, Mod: moderate, and Sev: severe) and from thebrain regions dataset(HIP: hippocampal field CA1 region). The complete set of data is included in Additional files3, Additional files4, and Additional files5. The statistically significant pFWER-values (pFWER< 0.05) for each pathway and method
Estimation of false positive rates
We verified that PathNet’s identification of pathways was driven by the differential gene expression data - and not only from the inherent connectivity of the pathways themselves - by testing the performance of PathNet on randomized input data. In the severe stage of thedisease progression data, we randomly shuffled the gene names 1,000 times and estimated the pFWER values for 130 pathways from PathNet. The randomization of gene names ensures that the direct evidences and number of differentially expressed genes in the shuffled data is the same as in the original data. The distribution of pFWER values given in Additional file 6 show that false positive rates from PathNet were low because 95% of the pFWER values were equal to 1. The false positive rate of PathNet at a pFWERcutoff of 0.05 (used in our analysis) was 0.02. We further investigated if the difference in pathway top-ology contributes to variations of false positive rates among pathways. We calculated false positive rates for each pathway from 1,000 random shuffles and plotted the distribution of false positive rates for 130 pathways (Additional file 7). The maximum false positive rate was 0.07, implying that none of the pathways have a signifi-cantly high probability of being identified as a false posi-tive. Hence, we cannot consider PathNet’s results to be an artifact of the pathway definitions themselves.
Contextual association between pathways
In this study, we introduced the concept of a contextual association between pathways, i.e., pathway connections that are influenced by differential gene expression of neighboring genes rather than just the static overlap of genes in pathways (Figure 2). Unlike the case of static overlap, these associations are specific to, and dependent on, the biological conditions of the particular study. These calculations identify pathway pairs where the dif-ferentially expressed genes linked to each other in the two pathways are present at a greater frequency than would be expected by chance alone.
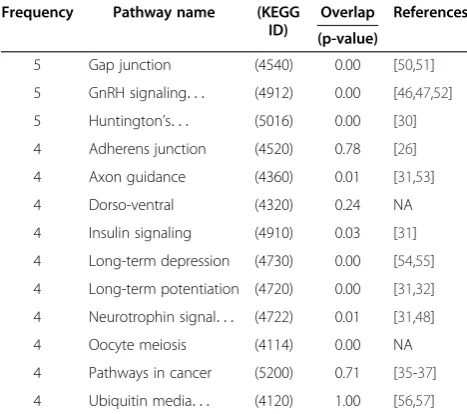
We used PathNet to identify pathway associations in each of the two AD datasets described above. Because we are interested in analyzing datasets related to AD, we specifically analyzed pathways that have statistically sig-nificant contextual association with the AD pathway. We focused on six comparisons (moderate and severe samples in the disease progression dataset; and primary visual cortex, hippocampal field CA1, middle temporal gyrus, and posterior cingulate cortex regions in thebrain regions dataset), where PathNet identified the AD path-way as statistically enriched. The results from all com-parisons are provided in Additional file 8. Among the AD contextually associated pathways, Table 3 lists the most frequently appearing pathways in these six compar-isons (selected as occurring at least three times). We Figure 4Overlap of pathways.Number of enriched pathways that
overlap between two comparable datasets (hippocampal field CA1 region for patients with severe AD), using four different methods (i.e., PathNet: the present study, SPIA: signaling pathway impact analysis, GSEA: gene set enrichment analysis, and the
hypergeometric test). As an example, PathNet identified 22 and 17 statistically significant pathways from thebrain regions datasetand thedisease progression dataset, respectively. Ten of these pathways overlapped. The statistical significances of the overlaps from each of the four methods were tested using the hypergeometric test; p-values were as follows: pPathNet= 2.0 × 10⁻⁵, pSPIA= 1.5 × 10⁻⁴, pGSEA= 1.0, phypergeometric= 3.3 × 10⁻⁴.
Table 2 Pathways co-enriched with the AD pathway
Frequency Pathway name (KEGG ID) References
6 *Bacterial invasion. . . (5100) [24]
6 *Regulation of actin. . . (4810) [25]
5 *Adherens junction (4520) [26]
5 *Focal adhesion (4510) [27-29]
5 *Huntington's disease (5016) [30]
5 *Long-term potenti. . . (4720) [31,32]
5 *Parkinson's disease (5012) [30,33]
5 *PathogenicEscher. . . (5130) NA
4 Endocytosis (4144) [34]
4 Melanoma (5218) [35-37]
4 Pathways in cancer (5200) [35-37]
4 Shigellosis (5131) NA
3 ECM-receptor (4512) [38]
3 Endometrial cancer (5213) [35-37]
3 ErbB signaling (4012) [39]
3 Fc gamma R- (4666) [31]
3 Glioma (5214) [40]
3 MAPK signaling (4010) [41]
3 Phosphatidylinosit. . . (4070) [42,43]
3 Progesterone-med. . . (4914) NA
3 Proteasome (3050) [44,45]
List of pathways co-enriched with the Alzheimer’s disease (AD) pathway in the
six out of nine comparisons (moderate and severe samples in the disease progression dataset; and primary visual cortex, hippocampal field CA1, middle temporal gyrus, and posterior cingulate cortex regions in the brain regions
dataset) where the AD pathway is enriched. The‘Frequency’column shows the
identified six pathways from this list that are related to neurological disorders in general and AD in par-ticular: gonadotropin releasing hormone (GnRH) sig-naling; neurotrophin sigsig-naling; long-term potentiation; Huntington’s disease; long-term depression; axon guidance; and ubiquitin-mediated proteolysis. GnRH regulates the release of luteinizing hormone, which is elevated in AD patients. The luteinizing hormone is known to be involved in the formation of beta amyloid (Aβ), which is a patho-logical hallmark of AD [46,47], and the neurotrophin signaling pathway regulates the signaling of neurons [48]. In AD and other neurodegenerative conditions, neurotro-phin receptors (NTRs), such as p7NTR, bind to Aβand nerve growth factors to promote cell death [49]. However, only two of these six pathways (long-term potentiation and Huntington’s disease) were identified as co-enriched (in at least three out of six cases) in the pathway enrich-ment analysis (Table 2).
If two pathways have significant overlap, i.e., they share a large number of genes, there is an increased chance that they will be associated with each other. However, contextual association is dependent not only on the extent of overlap, but also on the differential ex-pression levels of genes that connect the two pathways. To investigate if the contextual association provided in-formation beyond what could be expected by simply analyzing the shared genes between the corresponding pathway and the AD pathway, we calculated the p-value
of the direct overlap of genes in each pathway with the AD pathway, using the hypergeometric test (Table 3). A low p-value indicates that the pathway has a significantly high overlap with the AD pathway, and that the path-ways are strongly associated with each other based on previous knowledge encoded in the pathway definitions themselves. Interestingly, in 31% of the cases we observed that pathways with limited overlap had signifi-cant contextual association with each other. For ex-ample, ubiquitin-mediated proteolysis is one of the pathways that do not share any genes with the AD path-way, and yet we found that, in four out of six compari-sons, this pathway was contextually associated with the AD pathway (Table 3, Column 4). We therefore investi-gated the relationship between the AD and ubiquitin-mediated proteolysis pathways further. Figure 5 shows that there are 112 edges connecting genes between these two pathways, which imply a possible association be-tween them. However, because these edges connect genes from two non-overlapping pathways, we could not have identified this relationship if we had treated the pathways separately, or if we had used methods that re-late pathways based solely on overlapping genes. It is well established that deregulation of ubiquitin-mediated proteolysis can lead to the formation of neurofibrillary tangles (NFTs) from hyper-phosphorylated tau protein [31,56,57]. NFTs are one of the pathological hallmarks of AD, and the number of NFTs increases with the progres-sion of the disease [31]. However, this biologically rele-vant pathway is not statistically enriched from any of the four pathway analysis methods used here (Table 1), sug-gesting that our contextual association between path-ways can distil biological information that could not be obtained from enrichment analysis alone.
In summary, the following observations were made: 1) enrichment analysis using PathNet performed better than the three existing pathway analysis methods in identifying biologically relevant pathways, 2) contextual pathway-pathway analysis can reveal biological insights that may not be obtained from enrichment analysis alone, and 3) the enrichment of pathways associated with AD changes with disease progression.
Conclusion
In this study, we developed PathNet, a method for path-way analysis based on high-throughput molecular profil-ing data, usprofil-ing inter- and intra-pathway connectivity information. PathNet calculates both pathway enrich-ment and contextual associations between pathways. We have shown that PathNet was able to identify the AD pathway and other biologically relevant pathways in multiple scenarios while three other widely used path-way analysis methods (hypergeometric test, GSEA, and SPIA) often failed to do so. PathNet also identified Table 3 Contextual association of pathways
Frequency Pathway name (KEGG ID)
Overlap References
(p-value)
5 Gap junction (4540) 0.00 [50,51]
5 GnRH signaling. . . (4912) 0.00 [46,47,52]
5 Huntington’s. . . (5016) 0.00 [30]
4 Adherens junction (4520) 0.78 [26]
4 Axon guidance (4360) 0.01 [31,53]
4 Dorso-ventral (4320) 0.24 NA
4 Insulin signaling (4910) 0.03 [31]
4 Long-term depression (4730) 0.00 [54,55]
4 Long-term potentiation (4720) 0.00 [31,32]
4 Neurotrophin signal. . . (4722) 0.01 [31,48]
4 Oocyte meiosis (4114) 0.00 NA
4 Pathways in cancer (5200) 0.71 [35-37]
4 Ubiquitin media. . . (4120) 1.00 [56,57]
Pathways that were contextually associated [p < 0.05 calculated from Eq. (6)] with the AD pathway from six comparisons (moderate and severe samples in the disease progression dataset; and primary visual cortex, hippocampal field CA1, middle temporal gyrus, and posterior cingulate cortex regions in the brain regions dataset). For comparison purpose, the fourth column shows the p-value of overlapping genes of a pathway and the AD pathway based on
hypergeometric test. The‘References’column in the table provides support for
pathways contextually associated with the AD pathway. Literature studies support the biological relevance of the results identified using PathNet.
The existing methods used for pathway enrichment consider each pathway as a separate entity. In contrast, PathNet considers both inter-pathway and intra-pathway connectivity for pathway enrichment. This connectivity information, in the form of a significance-level weighted gene-gene connection, corroborates and strengthens the direct evidence of differential gene expression readily derived from microarray data when a gene’s neighbors on the pathway are also differentially expressed. The method properly accounts for highly connected genes that are part of multiple pathways via comparison with the appropriate probability density function generated from topology-preserving randomized data. The un-biased nature of this method was confirmed by the estimated low false positive rates. However, if no con-nectivity information is available for a gene, PathNet still includes the microarray-derived evidence for identifying pathway enrichment. This ensures that we do not penalize genes that have no information available regard-ing their connectivity.
In PathNet, indirect evidence of a gene is calculated based on gene expression levels of its neighbors using Eqs. (1–3). Hence, indirect evidence of the gene cannot be estimated if neighboring gene expression is not mea-sured in the microarray analysis. In such cases, the com-bined evidence of a gene is replaced with the direct evidence. In the limiting case where none of the genes’ neighbors expression levels are measured, PathNet con-verges to a standard hypergeometric test.
Currently, there is no gold standard for quantitatively testing and comparing the performance of pathway en-richment methods. As an alternative, we have selected a well-studied disease (i.e., AD), where considerable amount of knowledge already exists about the deregula-tion of its biological processes and multiple high-quality microarray datasets are available, to examine important aspects of the disease. This allowed us to assess the per-formance of PathNet based on an in-depth analysis of the biological relevance of the results, directly compare its performance with other existing pathway enrichment methods, and ascertain each method’s ability to retrieve the relevant biological information.
Availability and requirements
Software name:PathNet
Download site:http://www.bhsai.org/downloads/pathnet/
Operating system:Platform independent
License:GPL version 3
Programming language:R version 2.14.1 or later
Additional files
Additional file 1:KEGG directionality assignments.This file gives the types of edge directionality used in the KEGG pathway.
Additional file 2:Scatter-plots of direct and indirect evidences.A figure showing the relationship between direct and indirect evidences for the nine different comparisons used in this work.
Additional file 3:Hypergeometric test and PathNet results.An Excel spreadsheet of the results of all nine comparisons using the
hypergeometric test and PathNet.
Additional file 4:GSEA results.An Excel spreadsheet of the results of all nine comparisons using GEAS.
Additional file 5:SPIA results.An Excel spreadsheet of the results of all nine comparisons using SPIA.
Additional file 6:Randomized distributions of pFWER.Distribution of
pFWERfrom PathNet derived from the null distribution scenario and obtained from data randomization.
Additional file 7:Estimated false positive rate.Distribution of estimated false positive rates based on an analysis of all pathways.
Additional file 8:Contextual AD pathway association.An Excel spreadsheet of the pathways identified to have a statistically significant contextual association with the AD pathway.
Abbreviations
Aβ: Beta amyloid; AD: Alzheimer’s disease; EC: Entorhinal cortex; GEO: Gene expression omnibus; GSEA: Gene set enrichment analysis;
GnRH: Gonadotropin releasing hormone; GO: Gene Ontology; HIP: Hippocampal field CA1; KEGG: Kyoto encyclopedia of genes and genomes; MTG: Middle temporal gyrus; NFTs: Neurofibrillary tangles; NTRs: Neurotrophin receptors; PC: Posterior cingulate cortex; PPI: Protein-protein interaction; SFG: Superior frontal gyrus; SPIA: Signaling pathway impact analysis; VCX: Primary visual cortex.
Competing interests
The authors declare that they have no competing interests.
Authors' contributions
BD, AW, and JR conceived of the algorithm. BD implemented the algorithm, performed the study, and wrote the first draft of the manuscript. All authors contributed to the manuscript writing and approved the final manuscript.
Acknowledgements
This work was supported by the Military Operational Medicine Research Program of the U.S. Army Medical Research and Materiel Command, Ft. Detrick, Maryland, as part of the U.S. Army's Network Science Initiative. The opinions and assertions contained herein are the private views of the authors and are not to be construed as official or as reflecting the views of the U.S. Army or the U.S. Department of Defense. This paper has been approved for public release with unlimited distribution.
Received: 5 July 2012 Accepted: 3 August 2012 Published: 24 September 2012
References
1. Manoli T, Gretz N, Grone HJ, Kenzelmann M, Eils R, Brors B:Group testing for pathway analysis improves comparability of different microarray datasets.Bioinformatics2006,22(20):2500–2506.
2. Goeman JJ, Buhlmann P:Analyzing gene expression data in terms of gene sets: methodological issues.Bioinformatics2007,23(8):980–987. 3. Da Huang W, Sherman BT, Lempicki RA:Bioinformatics enrichment tools:
paths toward the comprehensive functional analysis of large gene lists.
Nucleic Acids Res2009,37(1):1–13.
4. Liu Q, Dinu I, Adewale AJ, Potter JD, Yasui Y:Comparative evaluation of gene-set analysis methods.BMC Bioinformatics2007,8:431.
5. Fisher L, Van Belle G:Biostatistics: a methodology for the health sciences. New York: Wiley; 1993.
6. Subramanian A, Tamayo P, Mootha VK, Mukherjee S, Ebert BL, Gillette MA, Paulovich A, Pomeroy SL, Golub TR, Lander ES,et al:Gene set enrichment analysis: a knowledge-based approach for interpreting genome-wide expression profiles.Proc Natl Acad Sci USA2005,102(43):15545–15550. 7. Draghici S, Khatri P, Tarca AL, Amin K, Done A, Voichita C, Georgescu C, Romero R:A systems biology approach for pathway level analysis.
Genome Res2007,17(10):1537–1545.
8. Tarca AL, Draghici S, Khatri P, Hassan SS, Mittal P, Kim JS, Kim CJ, Kusanovic JP, Romero R:A novel signaling pathway impact analysis.Bioinformatics
2009,25(1):75–82.
9. Thomas R, Gohlke JM, Stopper GF, Parham FM, Portier CJ:Choosing the right path: enhancement of biologically relevant sets of genes or proteins using pathway structure.Genome Biol2009,10(4):R44.
10. Kanehisa M, Araki M, Goto S, Hattori M, Hirakawa M, Itoh M, Katayama T, Kawashima S, Okuda S, Tokimatsu T,et al:KEGG for linking genomes to life and the environment.Nucleic Acids Res2008,36(Database issue):D480–484. 11. Li Y, Agarwal P, Rajagopalan D:A global pathway crosstalk network.
Bioinformatics2008,24(12):1442–1447.
12. Kelder T, Eijssen L, Kleemann R, van Erk M, Kooistra T, Evelo C:Exploring pathway interactions in insulin resistant mouse liver.BMC Syst Biol2011,
5:127.
13. Liu ZP, Wang Y, Zhang XS, Chen L:Identifying dysfunctional crosstalk of pathways in various regions of Alzheimer's disease brains.BMC Syst Biol
2010,4(Suppl 2):S11.
14. Tusher VG, Tibshirani R, Chu G:Significance analysis of microarrays applied to the ionizing radiation response.Proc Natl Acad Sci USA2001,
98(9):5116–5121.
15. Draghici S, Kulaeva O, Hoff B, Petrov A, Shams S, Tainsky MA:Noise sampling method: an ANOVA approach allowing robust selection of differentially regulated genes measured by DNA microarrays.
Bioinformatics2003,19(11):1348–1359.
16. Fisher RA:Statistical methods for research workers. 4th edition. Edinburgh: Oliver and Boyd; 1932.
17. Littell R, Folks J:Asymptotic optimality of Fisher's method of combining independent tests.J Am Stat Assoc1971,66(336):802–806.
18. Littell R, Folks J:Asymptotic optimality of Fisher's method of combining independent tests ii.J Am Stat Assoc1973,68(341):193–194.
19. Brown M:A method for combining non-independent, one-sided tests of significance.Biometrics1975,31(4):987–992.
20. Blalock EM, Geddes JW, Chen KC, Porter NM, Markesbery WR, Landfield PW:
Incipient Alzheimer's disease: microarray correlation analyses reveal major transcriptional and tumor suppressor responses.Proc Natl Acad Sci USA2004,101(7):2173–2178.
21. Liang WS, Dunckley T, Beach TG, Grover A, Mastroeni D, Walker DG, Caselli RJ, Kukull WA, McKeel D, Morris JC,et al:Gene expression profiles in anatomically and functionally distinct regions of the normal aged human brain.Physiol Genomics2007,28(3):311–322.
22. Armstrong RA:Visual field defects in Alzheimer's disease patients may reflect differential pathology in the primary visual cortex.Optom Vis Sci
1996,73(11):677–682.
23. Newberg A, Cotter A, Udeshi M, Brinkman F, Glosser G, Alavi A, Clark C:
Brain metabolism in the cerebellum and visual cortex correlates with neuropsychological testing in patients with Alzheimer's disease.Nucl Med Commun2003,24(7):785–790.
24. Honjo K, van Reekum R, Verhoeff NP:Alzheimer's disease and infection: do infectious agents contribute to progression of Alzheimer's disease?
Alzheimers Dement2009,5(4):348–360.
25. Penzes P, Vanleeuwen JE:Impaired regulation of synaptic actin cytoskeleton in Alzheimer's disease.Brain Res Rev2011,67(1–2):184–192. 26. Takeichi M, Abe K:Synaptic contact dynamics controlled by cadherin and
catenins.Trends Cell Biol2005,15(4):216–221.
27. Grace EA, Busciglio J:Aberrant activation of focal adhesion proteins mediates fibrillar amyloid beta-induced neuronal dystrophy.J Neurosci
2003,23(2):493–502.
28. Caltagarone J, Jing Z, Bowser R:Focal adhesions regulate Aβsignaling and cell death in Alzheimer's disease.Biochim Biophys Acta2007,
1772(4):438–445.
29. Sheng B, Song B, Zheng Z, Zhou F, Lu G, Zhao N, Zhang X, Gong Y:
Abnormal cleavage of APP impairs its functions in cell adhesion and migration.Neurosci Lett2009,450(3):327–331.
30. Heindel WC, Salmon DP, Shults CW, Walicke PA, Butters N:
Neuropsychological evidence for multiple implicit memory systems: a comparison of Alzheimer's, Huntington's, and Parkinson's disease patients.J Neurosci1989,9(2):582–587.
31. Querfurth HW, LaFerla FM:Alzheimer's disease.N Engl J Med2010,
362(4):329–344.
32. Malenka RC, Malinow R:Alzheimer's disease: recollection of lost memories.Nature2011,469(7328):44–45.
33. Sagar HJ:Clinical similarities and differences between Alzheimer's disease and Parkinson's disease.J Neural Transm Suppl1987,24:87–99. 34. Kurup P, Zhang Y, Xu J, Venkitaramani DV, Haroutunian V, Greengard P,
35. Behrens MI, Lendon C, Roe CM:A common biological mechanism in cancer and Alzheimer's disease?Curr Alzheimer Res2009,6(3):196–204. 36. Bennett DA:Is there a link between cancer and Alzheimer disease?
Neurology2009,75(13):1216–1217.
37. Plun-Favreau H, Lewis PA, Hardy J, Martins LM, Wood NW:Cancer and neurodegeneration: between the devil and the deep blue sea.PLOS Genet2010,6(12):e1001257.
38. Bellucci C, Lilli C, Baroni T, Parnetti L, Sorbi S, Emiliani C, Lumare E, Calabresi P, Balloni S, Bodo M:Differences in extracellular matrix production and basic fibroblast growth factor response in skin fibroblasts from sporadic and familial Alzheimer's disease.Mol Med2007,13(9–10):542–550. 39. Gondi CS, Dinh DH, Klopfenstein JD, Gujrati M, Rao JS:MMP-2
downregulation mediates differential regulation of cell death via ErbB-2 in glioma xenografts.Int J Oncol2009,35(2):257–263.
40. Lehrer S:Glioblastoma and dementia may share a common cause.Med Hypotheses2010,75(1):67–68.
41. Zhu X, Lee HG, Raina AK, Perry G, Smith MA:The role of mitogen-activated protein kinase pathways in Alzheimer's disease.Neurosignals2002,11(5):270–281. 42. Chiang HC, Wang L, Xie Z, Yau A, Zhong Y:PI3 kinase signaling is involved
in Aβ-induced memory loss in Drosophila.Proc Natl Acad Sci USA2010,
107(15):7060–7065.
43. Mercado-Gomez O, Hernandez-Fonseca K, Villavicencio-Queijeiro A, Massieu L, Chimal-Monroy J, Arias C:Inhibition of Wnt and PI3K signaling modulates GSK-3beta activity and induces morphological changes in cortical neurons: role of tau phosphorylation.Neurochem Res2008,
33(8):1599–1609.
44. Oddo S:The ubiquitin-proteasome system in Alzheimer's disease.
J Cell Mol Med2008,12(2):363–373.
45. Upadhya SC, Hegde AN:Role of the ubiquitin proteasome system in Alzheimer's disease.BMC Biochem2007,8(Suppl 1):S12.
46. Casadesus G, Webber KM, Atwood CS, Pappolla MA, Perry G, Bowen RL, Smith MA:Luteinizing hormone modulates cognition and amyloid-β deposition in Alzheimer APP transgenic mice.Biochim Biophys Acta2006,
1762(4):447–452.
47. Meethal SV, Smith MA, Bowen RL, Atwood CS:The gonadotropin connection in Alzheimer's disease.Endocrine2005,26(3):317–326. 48. Chao MV, Rajagopal R, Lee FS:Neurotrophin signalling in health and
disease.Clin Sci (Lond)2006,110(2):167–173.
49. Coulson EJ:Does the p75 neurotrophin receptor mediate Aβ-induced toxicity in Alzheimer's disease?J Neurochem2006,98(3):654–660. 50. Cruz NF, Ball KK, Dienel GA:Astrocytic gap junctional communication is
reduced in amyloid-β-treated cultured astrocytes, but not in Alzheimer's disease transgenic mice.ASN Neuro2010,2(4):201–213.
51. Mei X, Ezan P, Giaume C, Koulakoff A:Astroglial connexin immunoreactivity is specifically altered atβ-amyloid plaques in beta-amyloid precursor protein/presenilin1 mice.Neuroscience2010,171(1):92–105.
52. Webber KM, Casadesus G, Bowen RL, Perry G, Smith MA:Evidence for the role of luteinizing hormone in Alzheimer disease.Endocr Metab Immune Disord Drug Targets2007,7(4):300–303.
53. Bai G, Chivatakarn O, Bonanomi D, Lettieri K, Franco L, Xia C, Stein E, Ma L, Lewcock JW, Pfaff SL:Presenilin-dependent receptor processing is required for axon guidance.Cell2011,144(1):106–118.
54. Li S, Hong S, Shepardson NE, Walsh DM, Shankar GM, Selkoe D:Soluble oligomers of amyloidβprotein facilitate hippocampal long-term depression by disrupting neuronal glutamate uptake.Neuron2009,
62(6):788–801.
55. Shankar GM, Li S, Mehta TH, Garcia-Munoz A, Shepardson NE, Smith I, Brett FM, Farrell MA, Rowan MJ, Lemere CA,et al:Amyloid-βprotein dimers isolated directly from Alzheimer's brains impair synaptic plasticity and memory.Nat Med2008,14(8):837–842.
56. Layfield R, Cavey JR, Lowe J:Role of ubiquitin-mediated proteolysis in the pathogenesis of neurodegenerative disorders.Ageing Res Rev2003,
2(4):343–356.
57. Lopez Salon M, Morelli L, Castano EM, Soto EF, Pasquini JM:Defective ubiquitination of cerebral proteins in Alzheimer's disease.J Neurosci Res
2000,62(2):302–310.
doi:10.1186/1751-0473-7-10
Cite this article as:Duttaet al.:PathNet: a tool for pathway analysis using topological information.Source Code for Biology and Medicine2012
7:10.
Submit your next manuscript to BioMed Central and take full advantage of:
• Convenient online submission
• Thorough peer review
• No space constraints or color figure charges
• Immediate publication on acceptance
• Inclusion in PubMed, CAS, Scopus and Google Scholar
• Research which is freely available for redistribution