R E S E A R C H A R T I C L E
Open Access
Sample size determination for mediation
analysis of longitudinal data
Haitao Pan
1, Suyu Liu
2, Danmin Miao
3*and Ying Yuan
2*Abstract
Background:Sample size planning for longitudinal data is crucial when designing mediation studies because sufficient statistical power is not only required in grant applications and peer-reviewed publications, but is essential to reliable research results. However, sample size determination is not straightforward for mediation analysis of longitudinal design.
Methods:To facilitate planning the sample size for longitudinal mediation studies with a multilevel mediation model, this article provides the sample size required to achieve 80% power by simulations under various sizes of the mediation effect, within-subject correlations and numbers of repeated measures. The sample size calculation is based on three commonly used mediation tests: Sobel’s method, distribution of product method and the bootstrap method.
Results:Among the three methods of testing the mediation effects, Sobel’s method required the largest sample size to achieve 80% power. Bootstrapping and the distribution of the product method performed similarly and were more powerful than Sobel’s method, as reflected by the relatively smaller sample sizes. For all three methods, the sample size required to achieve 80% power depended on the value of the ICC (i.e., within-subject correlation). A larger value of ICC typically required a larger sample size to achieve 80% power. Simulation results also illustrated the advantage of the longitudinal study design. The sample size tables for most encountered scenarios in practice have also been published for convenient use.
Conclusions:Extensive simulations study showed that the distribution of the product method and bootstrapping
method have superior performance to the Sobel’s method, but the product method was recommended to use in practice in terms of less computation time load compared to the bootstrapping method. A R package has been developed for the product method of sample size determination in mediation longitudinal study design.
Keywords:Sample size determination, Mediation analysis, Longitudinal study
Background
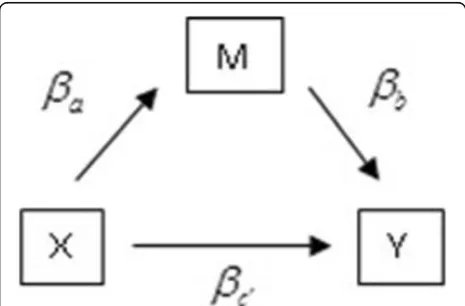
Mediation analysis is a statistical method that helps researchers to understand the mechanisms underlying the phenomena they study. It has broad application in psychology, prevention research, and other social sciences. A simple mediation framework (see Fig. 1) involves three variables: the independent variable, dependent variable and mediating variable [4, 27]. The aim of mediation analysis is to determine whether the
relation between the independent and dependent vari-ables is due, wholly or in part, to the mediating varivari-ables. Since the seminal work of Baron and Kenney [4], exten-sive research has been conducted in mediation analysis, including that of [7, 22, 25]; [34]; and [18], among others. A comprehensive review of mediation analysis can be found in the book by [27].
When planning a mediation study, the investigator commonly determines the required sample size. An appropriately chosen sample size is critical for the success of the study. If the sample size is too small, the study may lack adequate statistical power to detect an effect size of practical importance, which leads the investigator to incorrectly conclude that an efficacious intervention is inefficacious. Reviews of the
* Correspondence:[email protected];[email protected] 3Department of Medical Psychology, Fourth Military Medical University, Xi’an 710032, China
2Department of Biostatistics, Department of Biostatistics, Unit 1411, Anderson Cancer Center, The University of Texas MD, 1515 Holcombe Blvd, Houston, TX 77030, USA
Full list of author information is available at the end of the article
psychological literature suggest that insufficient statis-tical power is a common problem in psychological studies [1, 29, 30]. On the other hand, an unnecessar-ily large sample size is wasteful and increases the dur-ation of the study. Because of the importance of sample size, funding agencies such as the National In-stitutes of Health routinely require investigators to justify the sample size for funded projects.
Unfortunately, sample size determination is not straightforward for mediation analysis. No simple for-mula is available to carry out this task. Using Monte Carlo simulations, Fritz and MacKinnon [14] investi-gated power calculations for the simple mediation model and provided guidance in choosing sample sizes for me-diation studies with independent data. Their results, however, are not applicable to longitudinal studies, in which data are correlated.
A longitudinal study design is common in psycho-logical and social research [13]. Compared with a cross-sectional study design, the longitudinal design requires fewer subjects and allows investigators to study the tra-jectory of each subject. In longitudinal studies, repeated measures are collected from each subject over time. Since measures collected from the same subject are more likely to be similar when compared to those col-lected from other subjects, data from the same subject tend to be correlated. Analyzing such correlated data re-quires special statistical methods, such as the multilevel model [33]. In this article, assuming a multilevel medi-ation model and using Monte Carlo simulmedi-ation, we in-vestigate sample size determination for longitudinal mediation studies. Our objective is to provide practical guidance and easy-to-use R software to help researchers determine the sample size when designing longitudinal mediation studies.
Methods
This section starts by formulating single-level mediation model, then multilevel mediation model for longitudinal data is described. We focus on lower-level multilevel mediation model and relevant model assumptions are discussed.
Simple single-level mediation model
LetYdenote the dependent (or outcome) variable,X de-note the independent variable, and M denote the medi-ating variable (or mediator). A single-level mediation model (Fig. 1) can be expressed in the form of three re-gression equations:
Y¼β01þβcXþε1 ð1Þ
Y¼β02þβc0XþβbMþε2 ð2Þ
M¼β03þβaXþε3; ð3Þ
where βc quantifies the relation between the independ-ent variable and dependindepend-ent variable (i.e., the total effect ofX onY); βc0 quantifies the relation between the inde-pendent variable and deinde-pendent variable after adjusting for the effect of the mediating variable (i.e., the direct ef-fect ofX onYadjusted for M);βbquantifies the relation between the mediating variable and dependent variable after adjusting for the effects of the independent vari-able; βa measures the relation between the independent variable and mediating variable;β01,β02, andβ03are
in-tercepts; and ε1, ε2, and ε3 are error terms that follow
normal distributions with mean 0 and respective vari-ances ofσ21;σ22, andσ23.
The mediation effect can be defined by two ways:
βc−βc' and βaβb [16, 17, 27]. For the single-level
me-diation model, the two definitions of the meme-diation effect are equivalent [28], but they are generally dif-ferent in the multilevel mediation models we will describe.
Multilevel mediation model for longitudinal data
For correlated longitudinal data, the simple mediation model, which assumes independence of observations, is not appropriate. Using the single-level mediation model for longitudinal data leads to biased estimates of stand-ard errors and confidence intervals [3].
among the observations from the same subject, and yield valid statistical inference. For a comprehensive coverage of multilevel modeling techniques, see the book by Raudenbush & Bryk [33].
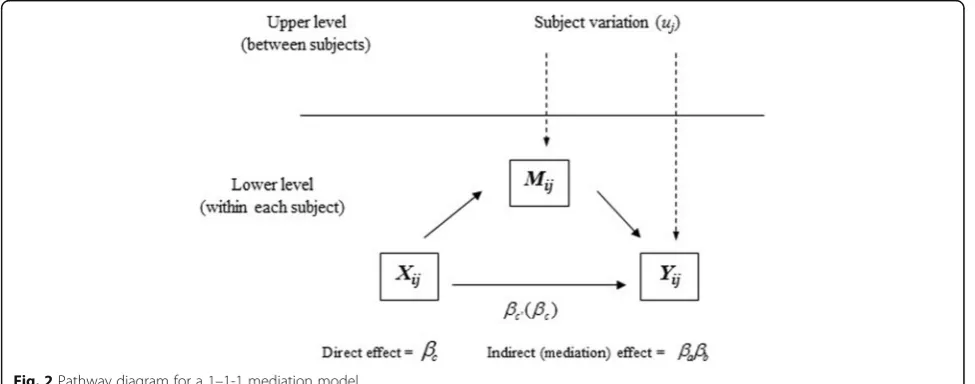
The multilevel mediation model is much more complex than the single-level model because mediation effects can occur at the different model levels. Two kinds of mediation, upper-level mediation and lower-level mediation, can be distinguished in the context of multilevel mediation models [5]. In upper-level medi-ation, the initial causal variable for which the effect is mediated is an upper-level variable. In lower-level medi-ation, the mediator is a lower-level variable. Krull [21] and MacKinnon [22] offered examples of upper-level me-diation, while [18] studied lower-level meme-diation, in which the mediation links varied randomly across the upper-level units. In this study, we focus on a specific type of lower-level mediation model (Fig. 2) that is appropriate for ana-lyzing longitudinal studies. In this model, an initial variable X is mediated in the lower level (i.e., measurement level), but the mediator M and outcome Y are affected by upper-level (i.e., subject upper-level) variations. A simple scenario for this model is a longitudinal experimental study in which subjects are randomly assigned to a treatment (time-invari-ant) or the multiple treatments can be assigned to a same subject in cross-over design (i.e., initial variable X, in this paper, variable X is treated as time-varying), and mediating variable M, such as a psychosocial measure, is believed to change individual behavior (i.e., dependent variable Y) over time.
The lower-level mediation model
Let Xij, Yij, and Mij denote the independent variable,
dependent variable, and mediating variable, respectively, for the ith observation from the jth subject. The
lower-level mediation model in Fig. 2 can be expressed in the form of the following two-level regression equations,
Lower:Yij¼β01jþβcXijþε1ij ð4Þ
Upper:β01j¼γ1þu1j ð5Þ
Lower :Yij¼β02jþβc0XijþβbMijþε2ij ð6Þ
Upper:β02j¼γ2þu2j ð7Þ
Lower:Mij¼β03jþβaXijþε3ij ð8Þ
Upper:β03j¼γ3þu3j ð9Þ
where at the lower (or within-subject) level, similar to the simple single-level mediation model,βcmeasures the total
effect of the independent variable on the dependent vari-able;βc'measures the direct effect of the independent vari-able on the dependent varivari-able, adjusted for the mediating variable;βbmeasures the effect of the mediating variable
on the dependent variable, adjusted for the independent variable;βa measures the effect of the independent
vari-able on the mediating varivari-able; andβ01j,β02j, andβ03jare
subject-specific intercepts that differ from subject to sub-ject, as reflected by the subscript j in these parameters. These subject-specific intercepts are also known as ran-dom intercepts. The termsε1ij,ε2ij, andε3ijare lower-level
(or within-subject) error terms that follow normal distri-butions with a mean of zero and respective variances σ21; σ2
2, andσ23. At the upper (or between-subject) levelγ1,γ2,
and γ3are overall or population average intercepts; and u1j, u2j, and u3j are upper-level (between-subject) error
terms that follow normal distributions with a mean of zero and respective variancesτ2
1;τ22, andτ23.
In the multilevel model, the upper-level errors induce within-subject correlations. Let yij and yi0j denote the
thand i′-th measures for the same subjectj, thenyijand
yi0j are correlated as
cov yij; ;yi0j
¼ cov β02jþβc0XijþβbMijþε2ij;β02jþβc0Xi0jþβbMi0jþε2i′j
¼ cov β02j;β02j
¼τ2 2
Such within-subject correlation is often measured by the intraclass correlation coefficient (ICC), which is defined as
ICC¼within‐subject covariance overall variance
Under the above two-level mediation model, the value of ICC forYis given by
ICC¼ τ 2 2
σ2
2þτ22: ð
10Þ
Larger values of ICC represent strong within-subject correlations, i.e., measures from the same subject are more similar. When ICC = 0, measures from the same subject are independent.
Due to the within-subject correlation, the two defini-tions of the mediation effects,βc−βc'and βaβb, are
gen-erally not equivalent in multilevel models [21], although they are equivalent in the single-level mediation model. The different behaviors of multilevel and single-level models are caused by the fact that the weighting matrix used to estimate the multilevel model is typically not identical to single-level equations. The non-equivalence between βc−βc' and βaβb, however, is unlikely to be
problematic because the difference between the two esti-mates is typically small and unsystematic and tends to vanish at large sample sizes [21]. In this article, we focus onβaβbas the measure of the mediation effect.
Test of the mediation effect
As the independence assumption is violated, conven-tional statistical methods, such as the ordinary least squares method, are not appropriate for estimating the multilevel mediation model. Instead, maximum likeli-hood methods and/or empirical Bayes methods are typically used. Let^βa and^βbdenote the maximum likeli-hood estimates of βa and βb, respectively. Then, the maximum likelihood estimate of the mediation effect is given byβ^a^βb. To test whether the mediation effectβaβb
equals zero, three approaches can be taken.
Sobel’s method
Sobel’s method is a widely used test of the mediation ef-fect, based on the first-order multivariate delta method [35, 36]. In this approach, assuming β^aand ^βbare inde-pendent, the standard deviation of^βaβ^bis estimated by
^sβaβb¼
ffiffiffiffiffiffiffiffiffiffiffiffiffiffiffiffiffiffiffiffiffiffiffiffiffiffiffi ^
s2βaβ^
2
bþ^s2βbβ^
2
a
r
; ð11Þ
where ^s2βaand ^s2βbare the squared standard errors of β^a
and ^βb, respectively. The 100(1-α)% confidence interval (CI) of the mediation effect is given by
^
βaβ^b−z1−α=2^sβaβb;β^a^βbþz1−α=2^sβaβb
; ð12Þ
where z1−α/2is the (1−α/2)th quantile of the standard normal distribution. If α= 0.05, the familiar 95% CI re-sults. If this CI does not contain zero, we reject the null hypothesis and conclude that the mediation effect is statistically significant.
Sobel’s method relies on the assumption thatβ^a^βb, the product of two normal random variables ^βa and β^b, is normally distributed. However, several studies have shown that the distribution of the product of two normal random variables is not actually normal, but skewed [23]. The violation of the normality assump-tion compromises the performance of Sobel’s method and leads to invalid CIs [26]. To address this problem, [26] discussed several improved CIs that account for the fact thatβ^aβ^bis not normally distributed, including the CI based on the distribution of the product of two normal random variables and the CI based on the bootstrap method [6, 34].
Distribution of the product method
Instead of assuming the normality of ^βaβ^b, the distribu-tion of the product method proposed by MacKinnon and Lockwood (2001) constructs the CI of the mediation effect based on the distribution of the product of two normal random variables. Although such a distribution does not take a simple closed form, Meeker et al. [31] provided tables of critical values for this distribution that can be used to construct the CI. Alternatively, the crit-ical values can also be obtained based on the empircrit-ical distribution of the product of two normal random variables through Monte Carlo simulations. Let δlower
and δupper denote critical values that correspond to the
lower and upper bounds of the CI, then the CI of the mediation effect is given by
^
βaβ^b−δlower^sβaβb;β^aβ^bþδupper^sβaβb
: ð13Þ
Bootstrap method
are unknown. In this study, we use the percentile boot-strap [6] to construct the CI for the mediation effect. We repeatedly resample the original data with replace-ment, obtaining the so-called bootstrap samples. For each of the bootstrap samples, we estimate the mediation effect using the maximum likelihood method. These estimates form the empirical distribution of the mediation effect. Let qα/2 and q1−α/2 denote the (α/2)th and (1−α/2)th percentiles of this empirical distribution; then the 100(1−α)% CI of the mediation effect is given by
qα=2;q1−α=2
: ð14Þ
When conducting bootstrap resampling for the multi-level mediation model, in principle, we should resample both the upper-level (subjects) and lower-level (mea-sures) units. However, in a multilevel context, we should be careful of not breaking the structure of the dataset, therefore, a resampling scheme for multilevel models must take into account the hierarchical data structure. There are three approaches can be applied to bootstrap two-level models: the parametric bootstrap, the residual bootstrap, and the cases bootstrap. We chose the cases bootstrap since it requires minimal assumptions of hier-archical dependency in the data being assumed to be specified correctly. de Leeuw & Meijer [9] suggest that when the number of lower-level units (measures) is small, the approach of resampling only the upper level and keeping the lower level intact yields more accurate estimates. In our simulation, the number of lower-level units is small (i.e., 2 to 5), thus we only resampled the upper-level units. To be specific, the algorithm for cases bootstrap is as follows:
1. Draw a sample of size J with replacement from the upper level units; that is, draw a sample {jk;k¼1;
⋯;J} (with replacement) of upper level numbers. 2. For each k, draw a sample of entire cases, with
replacement, from (the original) upper level unitj
¼jk. This sample has the same sizenk¼nj
k ¼nj as the original unit from which the cases are drawn. Then, for each k, we have a set of data {(Yik;Xik;
Mik),i¼1;⋯;nk}.
3. Compute estimates for all parameters of the two-level model.
4. Repeat steps 1–3 B times.
Simulation study
We conducted a simulation study to determine the sam-ple size that is needed to achieve 80% power when using Sobel’s method, the distribution of the product method, and the bootstrap method for longitudinal mediation studies. In our simulation, we varied three factors. The first one is the effect size of the mediation effect β^a^βb.
We considered four values of βaand βb: 0.14, 0.26, 0.39
and 0.59, respectively corresponding to smaller, medium, halfway (between medium and large), and large effect sizes. These values yielded 16 combinations of effect sizes of the mediation effect. Another factor is the ICC. We considered five values of ICC, 0.1, 0.3, 0.5, 0.7 and 0.9, to cover various within-subject correlations from low to high. The last factor is the number of repeated measures. We considered 2, 3, 4 and 5 repeated mea-sures for each subject. For other parameters, we set the overall interceptsγ2and γ3 as zero. Since there were no repeated measurements in Fritz et al. [14] and the sam-ples were all drawn from a standard normal distribution, for fair comparisons, we set marginal variances of Yij
and Mij, that is,σ22þτ22 and σ23þτ23, as 1. Based on the
definition of ICC, we haveτ2
2¼τ23¼ICC.
To simulate data, we first simulated the independent variable X from the standard normal distribution, then generated random intercepts β02j and β03j according to
eqs. (7) and (9). Conditional on the values of β02j and β03j, we generated the dependent variableYand
mediat-ing variableMaccording to eqs. (6) and (8).
To determine the power of the three test methods, under each of the parameter settings, we generated 1000 simulated datasets, and applied the methods to each of the datasets to test the mediation effect. We calculated the power of the methods as the proportion of tests that rejected the null hypothesis of no mediation effects, i.e., the CI excluded zero. For the bootstrap method, we based the construction of the CI on 500 bootstrap samples.
To determine the sample size that yields 80% power, we started with an initial guess of the sample size. If we found the power achieved with that sample size to be too low, we increased the sample size; and if we found the power to be too high, we decreased the sample size. We repeated this procedure until the sample size allowed us to reach the level of power nearest to 80%.
Results
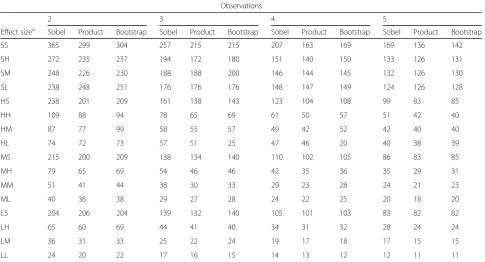
Tables 1, 2, 3, 4 and 5 show the sample sizes necessary to achieve 80% power under five different ICCs (ICC = 0.1, 0.2, 0.4, 0.6, 0.9). For completeness, results with other ICCs, say, 0.3, 0.5, 0.7, and 0.8, are also shown, which can be found in the Additional file 1: Tables S1-S4, respectively. In each table, the 16 mediation effect sizes are denoted by two letters, with the first one refer-ring to the size ofβa, and the second letter referring to
the size ofβb. We use S for small (0.14), M for medium
(0.39), L for large (0.59) and H for halfway (0.26) be-tween large and medium effect sizes, e.g., the effect size ML indicatesβa= 0.39 andβb= 0.59.
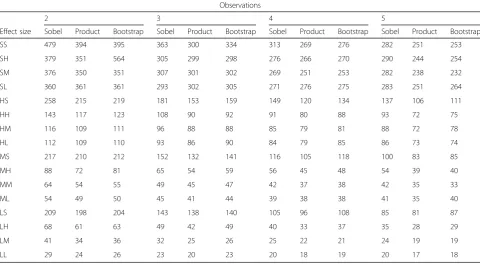
achieve 80% power. Bootstrapping and the distribution of the product method performed similarly and were more powerful than Sobel’s method, as reflected by the relatively smaller sample sizes. For instance, when the mediation effect size was medium (i.e., SM) and the ICC was 0.2, with 4 repeated measures, Sobel’s method re-quired 191 subjects to achieve 80% power, whereas the distribution of the product and bootstrap methods re-quired 188 and 185 subjects, respectively, to achieve the same power.
For all three methods, the sample size required to achieve 80% power depended on the value of the ICC (i.e., within-subject correlation). A larger value of ICC typically required a larger sample size to achieve 80% power. For example, under the design with two repeated measures and using the distribution of the product method, to detect a small effect size of SS, a sample size of 299 was needed when ICC = 0.1, while a sample size of 420 was needed when ICC = 0.4.
Simulation results also illustrated the advantage of the longitudinal study design. Compared with the results reported by Fritz and MacKinnon [14] for the cross-sectional study, the required sample size under the lon-gitudinal design was substantially smaller. When the ICC was low, such as 0.1, the required sample size under the longitudinal study design was a fraction of that under the cross-sectional design, and was approximately equal to the sample size of the cross-sectional study
divided by the number of repeated measures. For ex-ample, under the longitudinal design with three repeated measures and using the distribution of the product method, the sample size under the longitudinal design was 215 to detect a small effect size of SS, which was ap-proximately one-third of that required under the cross-sectional design (667). Even when the ICC was relatively high, we still observed dramatic sample size savings. For example, when ICC = 0.6 and using the bootstrap method, to detect the mediation effect size SM, the cross-sectional design required 422 subjects, while the longitudinal design with 4 repeated measures only re-quired 351 subjects. This observation is in accordance to findings in literatures [19].
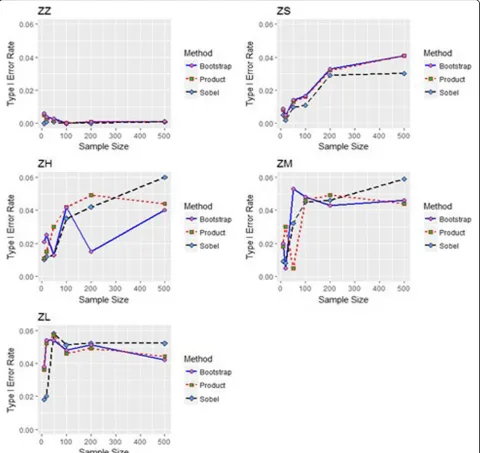
Figure 3 shows the type I error rates for the sample sizes corresponding to 5 examples of zero mediation ef-fects when ICC = 0.3 for three repeated measures. A par-ameter combination of zero/zero (ZZ) had error rates around zero for all numbers of observations and sample sizes across the mediation tests. The distribution of the product method had the most precise rates; whereas Sobel’s method had less type I error probability and bootstrapping inflated the error rates in the case of a zero/0.59 (ZL) parameter, as with small sample sizes. However, the rates approached 0.05 when the number of sample sizes increased. Other scenarios taking various ICCs and repeated measures showed results similar to those in Fig. 3 and they are not shown in the paper.
Table 1Estimated numbers of required subjects for 2, 3, 4 and 5 observations with ICC = 0.1
Observations
2 3 4 5
Effect sizea Sobel Product Bootstrap Sobel Product Bootstrap Sobel Product Bootstrap Sobel Product Bootstrap
SS 365 299 304 257 215 215 207 163 169 169 136 142
SH 272 235 237 194 172 180 151 140 150 133 126 131
SM 248 226 230 188 188 200 146 144 145 132 126 130
SL 238 248 251 176 176 176 148 147 149 124 126 128
HS 238 201 209 161 138 143 123 104 108 99 83 85
HH 109 88 94 78 65 69 61 50 57 51 42 40
HM 87 77 99 58 55 57 49 42 52 42 40 40
HL 74 72 73 57 51 25 47 46 20 40 38 39
MS 215 200 209 138 134 140 110 102 105 86 83 85
MH 79 65 69 54 46 46 42 35 36 35 29 31
MM 51 41 44 38 30 33 29 23 28 24 21 23
ML 40 36 38 29 27 28 24 22 25 20 18 20
LS 204 206 204 139 132 140 105 101 103 83 82 82
LH 65 60 69 44 41 40 34 31 32 28 24 24
LM 36 31 33 25 22 24 19 17 18 17 15 15
LL 24 20 22 17 16 15 14 13 12 12 11 11
a
Effect size: The first letter is the size ofβa, the second letter is the size ofβb;Sis small (0.14),Mis medium (0.39),Lis large (0.59) andHis halfway (0.26) between
Discussion
Assuming a two-level mediation model and using Monte Carlo simulations, we determined the sample sizes re-quired to achieve 80% power for longitudinal mediation studies under various practical settings. The simulation results provide guidance for researchers when choosing
appropriate sample sizes in the design of longitudinal mediation studies. Our simulations also show that the distribution of the product and bootstrap methods are more powerful than Sobel’s method for testing the medi-ation effect. In addition, the required sample size is closely related to the ICC. A high ICC generally requires
Table 2Estimated numbers of required subjects for 2, 3, 4 and 5 observations with ICC = 0.2
Observations
2 3 4 5
Effect size Sobel Product Bootstrap Sobel Product Bootstrap Sobel Product Bootstrap Sobel Product Bootstrap
SS 408 330 341 291 244 234 239 204 201 201 169 175
SH 301 282 283 231 226 230 201 185 190 177 163 160
SM 294 287 279 226 220 218 191 188 185 163 166 170
SL 282 267 278 223 213 211 188 182 182 166 163 164
HS 240 206 224 166 137 139 129 107 107 108 89 84
HH 120 97 104 87 72 79 71 59 58 61 53 60
HM 95 87 90 74 65 68 61 56 60 56 49 52
HL 88 85 85 72 65 70 61 57 54 51 49 48
MS 213 194 202 148 138 141 112 102 111 90 81 85
MH 81 68 73 59 49 53 47 39 37 39 32 30
MM 56 46 50 40 33 33 34 27 28 28 25 23
ML 47 38 37 32 31 28 29 27 23 25 24 24
LS 215 189 204 136 136 140 105 103 108 85 82 85
LH 66 60 65 45 39 40 36 32 34 30 26 28
LM 38 32 33 27 24 24 21 18 18 19 16 14
LL 25 22 22 19 17 15 16 14 12 14 12 13
Table 3Estimated numbers of required subjects for 2, 3, 4 and 5 observations with ICC = 0.4
Observations
2 3 4 5
Effect size Sobel Product Bootstrap Sobel Product Bootstrap Sobel Product Bootstrap Sobel Product Bootstrap
SS 479 394 395 363 300 334 313 269 276 282 251 253
SH 379 351 564 305 299 298 276 266 270 290 244 254
SM 376 350 351 307 301 302 269 251 253 282 238 232
SL 360 361 361 293 302 305 271 276 275 283 251 264
HS 258 215 219 181 153 159 149 120 134 137 106 111
HH 143 117 123 108 90 92 91 80 88 93 72 75
HM 116 109 111 96 88 88 85 79 81 88 72 78
HL 112 109 110 93 86 90 84 79 85 86 73 74
MS 217 210 212 152 132 141 116 105 118 100 83 85
MH 88 72 81 65 54 59 56 45 48 54 39 40
MM 64 54 55 49 45 47 42 37 38 42 35 33
ML 54 49 50 45 41 44 39 38 38 41 35 40
LS 209 198 204 143 138 140 105 96 108 85 81 87
LH 68 61 63 49 42 49 40 33 37 35 28 29
LM 41 34 36 32 25 26 25 22 21 24 19 19
a larger sample size to detect a given effect size. The simulation results show that when the ICC is high, above 0.8 for instance, the required sample sizes in these scenarios are close to the values provided in Fritz et al. [14], suggesting that we should choose cross-sectional studies instead of longitudinal studies since the former is
relatively easy to conduct but does not lose power. How-ever, in real studies, especially in psychotherapy clinical trial studies, a meta-analysis of ICCs found that ICCs varied widely, ranging from 0 to 0.729, with an average around 0.08 [8]. Similar results have been found in clinical trial data [12, 20] and clinical practice data
Table 4Estimated numbers of required subjects for 2, 3, 4 and 5 observations with ICC = 0.6
Observations
2 3 4 5
Effect size Sobel Product Bootstrap Sobel Product Bootstrap Sobel Product Bootstrap Sobel Product Bootstrap
SS 551 467 477 438 378 385 400 326 333 351 326 326
SH 451 426 453 376 369 370 363 349 350 332 326 334
SM 451 438 451 380 377 380 357 346 351 326 323 333
SL 454 444 445 385 376 380 344 326 340 326 313 324
HS 289 234 239 200 171 179 171 136 157 145 120 127
HH 156 132 130 127 111 122 111 101 108 104 93 96
HM 142 125 132 115 111 113 107 102 105 100 98 98
HL 133 131 127 115 111 112 102 97 97 100 97 99
MS 226 194 202 157 145 148 129 108 118 106 88 85
MH 99 80 91 76 62 73 63 52 60 57 48 52
MM 72 62 70 61 51 53 54 47 48 49 46 48
ML 63 59 61 53 52 52 49 49 49 47 46 46
LS 211 201 204 138 132 135 117 105 108 91 79 87
LH 72 62 65 52 45 49 43 36 38 37 31 32
LM 45 38 39 35 29 34 30 24 28 26 23 24
LL 33 31 32 28 24 25 25 24 25 23 21 23
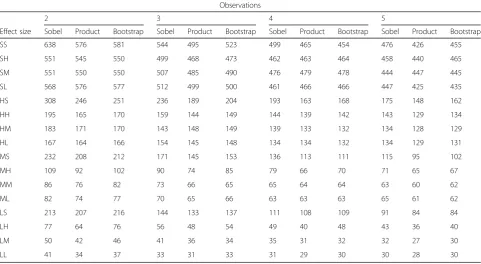
Table 5Estimated numbers of required subjects for 2, 3, 4 and 5 observations with ICC = 0.9
Observations
2 3 4 5
Effect size Sobel Product Bootstrap Sobel Product Bootstrap Sobel Product Bootstrap Sobel Product Bootstrap
SS 638 576 581 544 495 523 499 465 454 476 426 455
SH 551 545 550 499 468 473 462 463 464 458 440 465
SM 551 550 550 507 485 490 476 479 478 444 447 445
SL 568 576 577 512 499 500 461 466 466 447 425 435
HS 308 246 251 236 189 204 193 163 168 175 148 162
HH 195 165 170 159 144 149 144 139 142 143 129 134
HM 183 171 170 143 148 149 139 133 132 134 128 129
HL 167 164 166 154 145 148 134 134 132 134 129 131
MS 232 208 212 171 145 153 136 113 111 115 95 102
MH 109 92 102 90 74 85 79 66 70 71 65 67
MM 86 76 82 73 66 65 65 64 64 63 60 62
ML 82 74 77 70 65 66 63 63 63 65 61 62
LS 213 207 216 144 133 137 111 108 109 91 84 84
LH 77 64 76 56 48 54 49 40 48 43 36 40
LM 50 42 46 41 36 34 35 31 32 32 27 30
[24, 32, 37]. In studies in the field of education, small ICCs are also common [15], with 0.20 as a median value.
Another interesting finding for multilevel mediation is that the power of testing the mediation effect de-pends on not only the overall value of the mediation effects βaβb, but also the values of the individual
re-gression coefficients βa and βb. For instance, the
sam-ple size required to detect the effect size of LS is different from that required to detect the effect size SL. In other words, the sample size depends on the
value of βaβb, but not the individual values of βa and βb [14]. For example, the number of subjects needed
to detect the effect size LS was equal to that required to detect the effect size SL. The different behavior of multilevel mediation compared to single-level medi-ation is due to the within-cluster correlmedi-ation in the multilevel model. Therefore, when conducting power calculations for longitudinal mediation studies, in addition to the mediation effect βaβb, it is equally
im-portant to report the effect size of βa and βb.
Our simulation studies showed that the bootstrap and the distribution of the product methods have similar performance in testing the mediation effect. However, as the bootstrap is much more computer-intensive and time-consuming, we recommend using the distribution of the product method in practice. One limitation is that in the paper, coefficients βc, βa, βb and βc′ in the model were treated as fixed-effects
coefficients only. More flexible model by treating these as random-effects variables and two-level random-slopes model can also be considered. Another limitation is that in practice, effects size estimates are just estimates, not the true values, so uncertainty needs to be considered in the effect size estimates for sample size planning. Interested readers can consult the papers by [2, 10] for more information. There is a recent paper [38] discusses power and sample size for mediation model in longitudinal studies, however, in their model, the mediator was assumed to be time-invarying instead of time-variant in our research.
Conclusion
Mediation analysis using longitudinal data allows re-searchers to investigate biological pathways and identi-fies their direct and indirect contribution to interested outcome variable. However, though this method is com-mon in psychological and social research, sample size determination is still a challenging problem. This paper gives a way of using multilevel model for longitudinal data to provide the sample size under various sizes of the mediation effect, within-subject correlations and numbers of repeated measures via simulations by using three methods, Sobel, distribution of product and boot-strap. We found that the bootstrap and distribution of the product methods had comparable results and were more powerful than the Sobel’s method in terms of rela-tively smaller sample sizes. We recommend to use the distribution of product method due to its less computa-tional load. For the mediation model of longitudinal data, the sample size depended on the ICC (i.e., the intra-subject correlation), number of repeated measure-ments, “position” of βa and βb. Sample size tables for
commonly encountered scenarios in practice were also provided for researchers’convenient use.
Additional file
Additional file 1:Estimated numbers of required subjects with ICC = 0.3, 0.5, 0.7 and 0.8. (DOCX 27 kb)
Acknowledgements
The authors thank the associate editor and two reviewers for very insightful and constructive comments that substantially improved the article.
Funding
Yuan’s research was partially supported by grants CA154591, CA016672, and 5P50CA098258 from the National Cancer Institute. Miao’s research was partially supported by Military Health Care Key Projects during the Twelfth Five-year Plan Period. The above funds supported the authors to conduct statistical analysis, program code for producing results and write the manuscript and interpret the results.
Availability of data and materials Not applicable.
Authors’contributions
HP: idea for the study, programming, interpretation of results, writing of manuscript. YY: idea for the study, results checking, interpretation of results, writing of manuscript. SL: idea for the study, interpretation of results, writing of manuscript. DM: interpretation of results, writing of manuscript. All authors read and approved the final manuscript.
Ethics approval and consent to participate Not applicable. This work contains no human data.
Consent for publication Not applicable.
Competing interests
The authors declare that they have no competing interests.
Publisher’s note
Springer Nature remains neutral with regard to jurisdictional claims in published maps and institutional affiliations.
Author details
1Department of Biostatistics, St. Jude Children’s Research Hospital, Memphis, TN 38105, USA.2Department of Biostatistics, Department of Biostatistics, Unit 1411, Anderson Cancer Center, The University of Texas MD, 1515 Holcombe Blvd, Houston, TX 77030, USA.3Department of Medical Psychology, Fourth Military Medical University, Xi’an 710032, China.
Received: 25 May 2017 Accepted: 11 January 2018
References
1. Abraham WT, Russell DW. Statistical power analysis in psychological research. Soc Personal Psychol Compass. 2008;2(1):283–301.
2. Anderson SF, Maxwell SE. Addressing the "replication crisis": using original studies to design replication studies with appropriate statistical power. Multivar Behav Res. 2017:1–20.
3. Barcikowski R. Statistical power with group mean as the unit of analysis. J Educ Stat. 1981;6:267–85.
4. Baron RM, Kenny DA. The moderator-mediator variable distinction on social psychological research: conceptual, strategic, and statistical considerations. J Pers Soc Psychol. 1986;51:1173–82.
5. Bauer DJ, Preacher KJ, Gil KM. Conceptualizing and testing random indirect effects and moderated mediation in multilevel models: new procedures and recommendations. Psychol Methods. 2006;11:142–63.
6. Bollen KA, Stine R. Direct and indirect effects: classical and bootstrap estimates of variability. Sociol Methodol. 1990;20:115–40.
8. Crits-Christoph P, Mintz J. Implication of therapist effects for the design and analysis of comparative studies of psychotherapies. J Consult Clin Psychol. 1991;59:20–6.
9. de Leeuw J, Meijer E. Handbook of multilevel analysis. New York: Springer; 2008. 10. Du H, Wang L. A Bayesian power analysis procedure considering uncertainty in
effect size estimates from a meta-analysis. Multivar Behav Res. 2016;51(5):589–605. 11. Efron B. Bootstrap methods: another look at the jackknife. Ann Stat. 1979;7:1–26. 12. Elkin I, Falconnier L, Martinovich Z, Mahoney C. Therapist effects in the
NIMH Treatment of Depression Collaborative Research Program. Psychother Res. 2006;16:144–60.
13. Frees EW. Longitudinal and panel data: analysis and applications in the social sciences. Cambridge: Cambridge University Press; 2004. 14. Fritz MS, Mackinnon DP. Required sample size to detect the mediated
effect. Psychol Sci. 2007;18:233–9.
15. Hox JJ. Multilevel analysis: techniques and applications. Mahwah, NJ: Erlbaum; 2002.
16. Judd CM, Kenny DA. Estimating the effects of social interventions. Cambridge: Cambridge University Press; 1981a.
17. Judd CM, Kenny DA. Process analysis: estimating mediation in treatment evaluations. Eval Rev. 1981b;5:602–19.
18. Kenny DA, Korchmaros JD, Bolger N. Lower level mediation in multilevel models. Psychol Methods. 2003;8:115–28.
19. Killip S, Mahfoud Z, Pearce K. What is an Intracluster correlation coefficient? Crucial concepts for primary care researchers. Ann Fam Med. 2004;2(3):204– 8. https://doi.org/10.1370/afm.141
20. Kim D-M, Wampold BE, Bolt DM. Therapist effects in psychotherapy: a random effects modeling of the NIMH TDCRP data. Psychother Res. 2006;16: 161–72.
21. Krull JL, MacKinnon DP. Multilevel mediation modeling in group-based intervention studies. Eval Rev. 1999;23:418–44.
22. Krull JL, Mackinnon DP. Multilevel modeling of individual and group level mediated effects. Multivar Behav Res. 2001;36:249–77.
23. Lomnicki ZA. On the distribution of product of random variables. J R Stat Soc. 1967;29:513–24.
24. Lutz, Wolfgang; Leon, Scott C.; Martinovich, Zoran; Lyons, John S.; Stiles, William B. Therapist effects in outpatient psychotherapy: a three-level growth curve approach. J Couns Psychol, Vol 54(1), Jan 2007, 32–39. 25. MacKinnon DP, Dwyer JH. Estimating mediated effects in prevention
studies. Eval Rev. 1993;17:144–58.
26. MacKinnon DP, Lockwood CM, Williams J. Confidence limits for the indirect effect: distribution of the product and resampling methods. Multivar Behav Res. 2004;39:99–128.
27. MacKinnon DP. Introduction to statistical mediation analysis. New York: Lawrence Erlbaum Associates; 2008.
28. MacKinnon DP, Warsi G, Dwyer JH. A simulation study of mediated effect measures. Multivar Behav Res. 1995;30:41–62.
29. Maxwell SE. The persistence of underpowered studies in psychological research: causes, consequences, and remedies. Psychol Methods. 2004;9(2):147. 30. Maxwell SE, Kelley K, Rausch JR. Sample size planning for statistical power
and accuracy in parameter estimation. Annu Rev Psychol. 2008;59:537–63. 31. Meeker WQ Jr, Cornwell LW, Aroian LA. The product of two normally
distributed random variables. In: Kennedy WJ, Odeh RE, editors. Selected tables in mathematical statistics, vol. VII. Providence, RI: American Mathematical Society; 1981.
32. Okiishi J, Lambert MJ, Nielsen SL, Ogles BM. Waiting for Supershrink: an empirical analysis of therapist effects. Clinical Psychology and Psychotherapy. 2003;10:361–73.
33. Raudenbush SW, Bryk AS. Hierarchical linear models: applications and data analysis methods. 2nd ed. Newbury Park, CA: Sage; 2002.
34. Shrout PE, Bolger N. Mediation in experimental and nonexperimental studies: new procedures and recommendations. Psychology Methods. 2002;7:422–45.
35. Sobel ME. Asymptotic confidence intervals for indirect effects in structural equation models. Sociol Methodol. 1982;13:290–312.
36. Sobel ME. Direct and indirect effects in linear structural equation models. Sociological Methods and Research. 1987;16:155–67.
37. Wampold BE, Brown GS. Estimating variability in outcomes attributable to therapists: a naturalistic study of outcomes in managed care. J Consult Clin Psychol. 2005;73:914.
38. Wang C, Xue X. Power and sample size calculations for evaluating mediation effects in longitudinal studies. Stat Methods Med Res. 2016 Apr;25(2):686–705.
• We accept pre-submission inquiries
• Our selector tool helps you to find the most relevant journal
• We provide round the clock customer support
• Convenient online submission
• Thorough peer review
• Inclusion in PubMed and all major indexing services
• Maximum visibility for your research
Submit your manuscript at www.biomedcentral.com/submit