R E S E A R C H
Open Access
Road traffic noise and registry based use of
sleep medication
Jorunn Evandt
1*, Bente Oftedal
1, Norun Hjertager Krog
1, Svetlana Skurtveit
2,3, Per Nafstad
4,5, Per E. Schwarze
1,
Eva Skovlund
2,6, Danny Houthuijs
7and Gunn Marit Aasvang
1Abstract
Background:Road traffic noise has been associated with adverse health effects including sleep disturbances. Use of sleep medication as an indicator of sleeping problems has rarely been explored in studies of the effects of traffic noise. Furthermore, using registry data on sleep medications provides an opportunity to study the effects of noise on sleep where attribution of sleep problems to noise is not possible.
Methods:We used questionnaire data from the population-based study Health and Environment in Oslo (HELMILO) (2009–10) (n= 13,019). Individual data on sleep medications was obtained from the Norwegian Prescription Database (NorPD). Noise levels (Lnight) were modeled for the most exposed façade of the building at each participant’s home address. Logistic regression models adjusted for potential confounders were used to analyze the association between traffic noise and sleep medication use both for one whole year and for the summer season. The results were reported as changes in the effect estimate per 5 decibel (dB) increase in noise level.
Results:We observed no association between traffic noise and sleep medication use during one year [odds ratio (OR) = 1.00; 95% confidence interval (CI): 0.96, 1.04]. For sleep medication use in the summer season, there was a positive, however non-significant association (OR = 1.04; 95% CI: 0.99, 1.10). Among individuals sleeping with the bedroom window open, the association increased slightly and was borderline statistically significant (OR = 1.06; 95% CI: 1.00, 1.12).
Conclusions:We found no evidence of an association between traffic noise and sleep medication use during one year. However, for the summer season, there was some suggestive evidence of an association. These findings indicate that season may play a role in the association between traffic noise and sleep, possibly because indoor traffic noise levels are likely to be higher during summer due to more frequent window opening. More studies are, however, necessary in order to confirm this.
Keywords:Traffic noise, Prescription registry, Sleep medication, Hypnotics, Sleep, Insomnia, Directed acyclic graph, Population-based study.
Background
Sleep disturbances are considered the main health bur-den in relation to environmental noise exposure. The World Health Organization (WHO) has estimated that noise-induced sleep disturbances lead to nearly 1 million disability adjusted life-years (DALYs) in Western Europe [1]. Furthermore, an increasing number of people will be
exposed to noise levels above guideline values as traffic volumes and urbanization continue to grow [2].
A number of both experimental and epidemiological studies have demonstrated an impact of road traffic noise on sleep disturbances such as difficulties falling asleep, awakenings, sleep stage changes, and autonomic responses [3–10]. Furthermore, poor sleep has been hy-pothesized to be a mediator in the association between noise and adverse health effects such as diabetes, adipos-ity, and myocardial infarction [11–14] as well as mental health problems [15–17].
* Correspondence:jorunn.evandt@fhi.no
1Division of Infection Control and Environmental Health, Department of Air
Pollution and Noise, Norwegian Institute of Public Health, P.O. Box 4404 Nydalen, N-0403 Oslo, Norway
Full list of author information is available at the end of the article
Although there are strong indications of an association between traffic noise and sleep disturbances, studies on the association between road traffic noise and sleep medication use are scarce. In previous studies of noise and sleep medication use, the medication use has either been reported subjectively [10, 18, 19] or been drawn from a registry recording individual purchase of medica-tions [20, 21]. The registry based studies have, however, not exclusively studied sleep medication use, but have also included other types of medication such as antide-pressants and anxiolytics.
We have previously studied the association between traffic noise and self-reported sleep disturbances and self-reported sleep medication use, and found that traffic noise was related to difficulties falling asleep and waking up too early [10]. However, no association with self-reported sleep medication use was found [10]. Applying registry based sleep medication use as an outcome rather than sleep disturbances and medication use based on self-reports provides an opportunity to study the effects of noise on sleep avoiding attribution to noise. Other methods for studying the relation between noise and sleep unaffected by attribution to noise include physio-logical measurements of sleep such as polysomnography and actigraphy. These methods are, however, often not suitable for large samples. When the data on sleep medi-cations are obtained from a prescription registry, the outcome will be based on a physician’s evaluation of the patients’need for sleep medications. Furthermore, it can represent a patient’s coping strategy, since they visit a physician in order to get help with their sleeping prob-lems. Registry data on sleep medications is also assumed to be a more valid outcome than self-reports, because self-reports are prone to information bias because the respondents could e.g. misunderstand how the drug in question is classified [22].
Noise annoyance has been found to vary according to season and a higher prevalence has been reported during summer than winter [23, 24]. These findings may be due to peoples’ tendency to keep their bedroom windows open during the warmer season, thereby increasing the indoor noise levels from outdoor sources. Although these studies specifically address noise annoyance, it is not unlikely that seasonal variations may influence other effects of traffic noise such as sleep disturbances and sleep medication use. Furthermore, a study on noise and blood pressure reported a stronger association at tem-peratures above 15 °C [25]. The authors further indi-cated that this possibly could be explained by higher indoor traffic noise levels as many people sleep with the window open during warm periods. To our knowledge, no previous study has assessed if the association be-tween traffic noise and sleep outcomes could differ ac-cording to season.
A stronger association between traffic noise and sleep disturbances has previously been reported among indi-viduals with high levels of trait anxiety [6]. This finding may also be relevant for sleep medication use, as it indi-cates that people with high levels of mental distress are particularly vulnerable to nighttime traffic noise.
In the present study, we investigated the association between road traffic noise and dispensed sleep medica-tions from a prescription registry. Furthermore, we assessed whether the association was different during the summer season, than during the whole year. We also investigated whether the association differed according to degree of mental distress.
Methods
Study population
We used data from the Health and Environment in Oslo (HELMILO) study, conducted in 2009–10. In this study, a questionnaire was received by 27,097 Oslo inhabitants born in the years 1924–25, 1940–41, 1955, 1960 and 1970. The response rate was 48% (n= 13,019). By using the unique personal identification number assigned to all Norwegian citizens, the questionnaire data was linked to the geographic coordinates of each participant’s home address. A total of 881 participants were excluded be-cause they had lived at their current address for less than one year, had moved out of Oslo before returning the questionnaire, or had not been assigned a noise ex-posure level due to missing or uncertain information about geographic coordinates of the residential address. The Regional Committee for Medical Research Ethics in Norway approved the study and each participant pro-vided written informed consent.
Registry based sleep medication use
Information on registry based sleep medication use was obtained from the Norwegian Prescription Database (NorPD). NorPD contains individual data on all pre-scription drugs dispensed at Norwegian pharmacies since 2004. The personal identification number makes it possible to access information on dispensed prescription drugs at an individual level [26]. We extracted data on dispensed hypnotics, coded as N05C according to the Anatomical Therapeutic Chemical (ATC) classification system [27]. A participant who had filled at least one prescription of hypnotics during the year 2009 was de-fined as a user of sleep medications.
Noise exposure assessment
Nighttime road and rail traffic noise (Lnight, A-weighted
nighttime equivalent noise level, 2300–0700 h) was modeled for the most exposed façade of the building and assigned to each participant’s home address using geographic coordinates. The noise levels were calculated by the City of Oslo according to the Nordic Prediction Method for Road Traffic and Railway Noise, respectively [29–32]. Geographic information system (GIS) method-ology was applied in the software package CadnaA [33]. The grids for the noise calculations were 5 × 5 m and calculation height was 4 m above terrain. Within each grid, the noise level was interpolated at points along the façade with 3 m distance. Road traffic data included in the model (traffic counts, percentage heavy vehicles, speed limits, diurnal distribution) were obtained from the Norwegian Public Roads Administration and the City of Oslo. Other inputs to the model were digitalized terrain data in 3D including topography, soft vs. hard ground, location of buildings, and noise screens. For railway noise, input data included traffic frequency, signed speed, and train type obtained from the Norwe-gian state-owned company, Bane NOR, responsible for traffic management of railway property. Similar data for tram and subway traffic was obtained from Sporveien Oslo AS, a municipally owned public transport operator in Oslo.
The noise exposure data we used, had originally been calculated for the strategic noise mapping of Oslo, which is conducted every five years in accordance with the European Environmental Noise Directive [34]. We had access to detailed continuous noise data calculated for the strategic noise mappings for the years 2006 and 2011. The noise mapping for 2011 [35] was the one per-formed closest in time to the study period (2009–2010), and therefore most participants were assigned a noise level for 2011. However, in the time between the study period and 2011, some buildings and noise screens had either been erected or demolished, and the road network had been restructured in some areas. Thus, in some cases the traffic noise data assessed for 2006 were evalu-ated as more representative than the 2011 data. We therefore assigned the noise level calculated for 2006 to the dwellings where the noise level had either increased or decreased substantially [+/− 3 dB (dB)] following these local changes (2.2% of dwellings).
Covariates
In the procedure of selecting covariates to the statistical models, we used a directed acyclic graph (DAG) [36, 37]. The DAG was developed using the web-based software DAGitty [38]. In order to decide which variables to be included in the DAG, we reviewed previous relevant re-search. Since we considered sleep medication use as an
indicator for sleep disturbances, we included variables relevant for the association between traffic noise exposure and sleep disturbances. In Additional file 1: Figure S1, we have presented a simplified version of the DAG. The full version of the DAG can be accessed at www.dagitty.net/ mAeotvC. The minimal sufficient adjustment set we used for the statistical analyses included the variables age, sex, population density, marital status, alcohol use, smoking status, physical activity, night shift work, and rail traffic noise. Age and sex were specified as compulsory variables for the final adjustment set. Further, it has been found that socially deprived individuals are exposed to higher noise levels than more socially advantaged individuals [39]. Thus, we added the socioeconomic factors educational level and household income to the final adjustment set.
Information on age and sex was obtained from the Na-tional Population Registry. We obtained information on socioeconomic status (SES) from Statistics Norway. Edu-cational level was categorized as low (elementary school / no formal education), medium (upper secondary edu-cation) and high (higher eduedu-cation). Pre-tax household income per year was categorized as Norwegian kroner (NOK) < 500,000, NOK 500,000-NOK < 1000,000, and NOK ≥ 1000,000. The area variable, population density, obtained from the City of Oslo, included the number of dwellings per km2in the area of each participant’s home according to the following categories: < 1000 dwellings, 1000- < 1500 dwellings, 1500- < 2500 dwellings, and ≥2500 dwellings. For constructing the variable on mari-tal status, we mainly used data from Statistics Norway, but added information on cohabitation obtained from the HELMILO questionnaire. Marital status was catego-rized as married/cohabiting, unmarried (never married), divorced/separated, and widow(er). The following life-style variables were obtained from the questionnaire: al-cohol use the last year (never been drinking / not been drinking the last year, been drinking≤3 times/month, 1– 3 times/week, and 4–7 times/week), smoking status (current, previous, or never daily smoker), and physical activity [sedentary (mostly sedentary activities), moder-ately active (light physical activity at least two to four hours a week), and highly active (heavy physical activity at least four hours a week)]. Night shift work was cate-gorized according to number of years the participants had worked regular night shifts (0 years, 1- < 5 years, and ≥5 years). Rail traffic noise, originally a continuous variable, was split into three categories: Lnight < 35 dB,
Lnight35 dB- < 45 dB, andLnight≥45 dB.
Statistical analyses
season (June, July, and August). For each association, we ran two models. In Model 1, we adjusted for age and sex, and in Model 2, we adjusted for the variables identi-fied in the DAG and the SES factors educational level and income. Observations with missing values on any of the variables in Model 2 were excluded.
Since one single prescription of sleep medications may be filled in conjunction with a major life event, and, thus, not reflect consistent use, we also performed the analyses where the outcome was having filled two pre-scriptions or more.
Because the noise levels were modeled at the most ex-posed façade of each participant’s home, we assumed that the noise exposure was more accurate among those having their bedroom facing a road. We obtained infor-mation on bedroom location from the questionnaire and we conducted additional analyses according to whether the participants’bedrooms were facing a road or not.
The actual road traffic noise levels the participants were exposed to could vary according to window open-ing and closopen-ing habits. To address this issue, we per-formed separate analyses according to the participants’ reporting in the questionnaire whether they usually sleep with their bedroom window open or closed during sum-mer. We performed these analyses both for the total study population as well as according to bedroom loca-tion in the building.
To assess whether mental distress could modify the as-sociation between traffic noise and sleep medication use, we stratified the sample according to high vs. low degree of mental distress. For measuring mental distress, we used the Hopkins Symptoms Checklist (HSCL) 10-item version, an abbreviated version of the HSCL-90-R [40]. The questionnaire consists of ten items that mainly taps into symptoms of anxiety and depression. A mean score of ≥1.85 on the HSCL-10 was considered a high degree of mental distress [41]. We performed this stratified ana-lysis both for sleep medication use during the total year and for the summer season.
Since sleep medications were considered an indicator of sleep disturbances, we calculated the proportion of in-dividuals having filled a prescription of sleep medica-tions during 2009 that also reported to have sleep disturbances. Self-reported sleep disturbances were re-ported in the HELMILO questionnaire and we used the three following items: difficulties falling asleep, awaken-ings during the night, and waking up too early at a fre-quency of at least 3–5 times per week. The same frequency was used in a previous study were these sleep problems were used as outcomes [10].
Indications that noise exposure may affect sleep differ-ently in men and women have been reported [42]. Hence, it is possible that similar differences could be relevant for sleep medication use. We therefore tested
the interaction between road traffic noise and sex on sleep medication use by means of the log-likelihood test and performed sex-stratified analyses.
All results are reported as changes in the effect esti-mate per 5 dB increase in noise level. A 5% level of sig-nificance was used for all statistical analyses, except for the interaction tests for which we used a 10% level. Stat-istical analyses were carried out in STATA version 14 (StataCorp, College Station, Texas, USA). We visualized the associations between road traffic noise and hypnotics use by applying a smooth function of the associations with non-parametric regression spline as smoother. Such models are named generalized additive models (GAM). The function gam in library mgcv in the R statistical software version 3.3.2 (The R Project for Statistical Computing, Vienna, Austria) was used to estimate the splines with 95% confidence limits.
Results
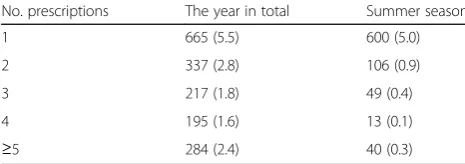
In the total study population, 14.1% (n= 1698) had filled at least one prescription of hypnotics in the course of a whole year. The corresponding proportion for the sum-mer season was 6.7% (n= 808). In Table 1, we have pre-sented the distribution of number of prescriptions, both for the year 2009 in total and for the summer season.
The modeled road traffic noise levels ranged from Lnight 7.6 dB to Lnight 70.8 dB with a mean of Lnight
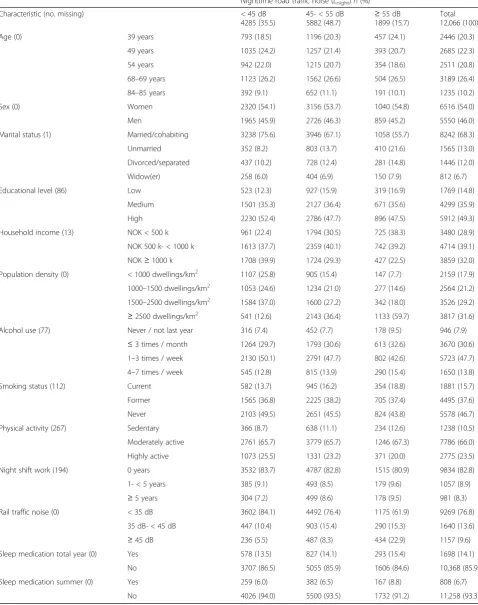
47.2 dB (SD = ± 8.0). Table 2 shows a detailed descrip-tion of the characteristics of the total study populadescrip-tion and by three categories of road traffic noise exposure. The most pronounced differences across noise exposure categories were seen for the covariates marital status, household income, smoking status, physical activity, population density, and rail traffic noise.
A total of 88.8% (n = 10,681) reported to sleep with their bedroom window kept open during summer and 33.0% (n= 3952) reported to have their bedroom facing a road. Among those having the bedroom facing a road, the noise levels ranged from Lnight 19.1 dB to Lnight
70.4 dB with a mean ofLnightdB 49.7 (SD = ±7.3), which
is higher than for the total study population. For sleep medication use during one year, there was a slightly higher proportion having filled a prescription on hyp-notics (15.6%) in the group having the bedroom facing a
Table 1Number (percentage) of filled prescriptions of hypnotics for the year in total and for the summer season
No. prescriptions The year in total Summer season
1 665 (5.5) 600 (5.0)
2 337 (2.8) 106 (0.9)
3 217 (1.8) 49 (0.4)
4 195 (1.6) 13 (0.1)
Table 2Characteristics of the study population by nighttime road traffic noise (Lnight) exposure
Nighttime road traffic noise (Lnight)n(%)
Characteristic (no. missing) < 45 dB
4285 (35.5)
45- < 55 dB
5882 (48.7) ≥ 55 dB 1899 (15.7)
Total 12,066 (100)
Age (0) 39 years 793 (18.5) 1196 (20.3) 457 (24.1) 2446 (20.3)
49 years 1035 (24.2) 1257 (21.4) 393 (20.7) 2685 (22.3) 54 years 942 (22.0) 1215 (20.7) 354 (18.6) 2511 (20.8) 68–69 years 1123 (26.2) 1562 (26.6) 504 (26.5) 3189 (26.4) 84–85 years 392 (9.1) 652 (11.1) 191 (10.1) 1235 (10.2)
Sex (0) Women 2320 (54.1) 3156 (53.7) 1040 (54.8) 6516 (54.0)
Men 1965 (45.9) 2726 (46.3) 859 (45.2) 5550 (46.0)
Marital status (1) Married/cohabiting 3238 (75.6) 3946 (67.1) 1058 (55.7) 8242 (68.3) Unmarried 352 (8.2) 803 (13.7) 410 (21.6) 1565 (13.0) Divorced/separated 437 (10.2) 728 (12.4) 281 (14.8) 1446 (12.0)
Widow(er) 258 (6.0) 404 (6.9) 150 (7.9) 812 (6.7)
Educational level (86) Low 523 (12.3) 927 (15.9) 319 (16.9) 1769 (14.8)
Medium 1501 (35.3) 2127 (36.4) 671 (35.6) 4299 (35.9)
High 2230 (52.4) 2786 (47.7) 896 (47.5) 5912 (49.3)
Household income (13) NOK < 500 k 961 (22.4) 1794 (30.5) 725 (38.3) 3480 (28.9) NOK 500 k- < 1000 k 1613 (37.7) 2359 (40.1) 742 (39.2) 4714 (39.1) NOK≥1000 k 1708 (39.9) 1724 (29.3) 427 (22.5) 3859 (32.0) Population density (0) < 1000 dwellings/km2 1107 (25.8) 905 (15.4) 147 (7.7) 2159 (17.9)
1000–1500 dwellings/km2 1053 (24.6) 1234 (21.0) 277 (14.6) 2564 (21.2)
1500–2500 dwellings/km2 1584 (37.0) 1600 (27.2) 342 (18.0) 3526 (29.2)
≥2500 dwellings/km2 541 (12.6) 2143 (36.4) 1133 (59.7) 3817 (31.6)
Alcohol use (77) Never / not last year 316 (7.4) 452 (7.7) 178 (9.5) 946 (7.9)
≤3 times / month 1264 (29.7) 1793 (30.6) 613 (32.6) 3670 (30.6) 1–3 times / week 2130 (50.1) 2791 (47.7) 802 (42.6) 5723 (47.7) 4–7 times / week 545 (12.8) 815 (13.9) 290 (15.4) 1650 (13.8) Smoking status (112) Current 582 (13.7) 945 (16.2) 354 (18.8) 1881 (15.7) Former 1565 (36.8) 2225 (38.2) 705 (37.4) 4495 (37.6) Never 2103 (49.5) 2651 (45.5) 824 (43.8) 5578 (46.7) Physical activity (267) Sedentary 366 (8.7) 638 (11.1) 234 (12.6) 1238 (10.5) Moderately active 2761 (65.7) 3779 (65.7) 1246 (67.3) 7786 (66.0) Highly active 1073 (25.5) 1331 (23.2) 371 (20.0) 2775 (23.5) Night shift work (194) 0 years 3532 (83.7) 4787 (82.8) 1515 (80.9) 9834 (82.8) 1- < 5 years 385 (9.1) 493 (8.5) 179 (9.6) 1057 (8.9)
≥5 years 304 (7.2) 499 (8.6) 178 (9.5) 981 (8.3)
Rail traffic noise (0) < 35 dB 3602 (84.1) 4492 (76.4) 1175 (61.9) 9269 (76.8) 35 dB- < 45 dB 447 (10.4) 903 (15.4) 290 (15.3) 1640 (13.6)
≥45 dB 236 (5.5) 487 (8.3) 434 (22.9) 1157 (9.6)
Sleep medication total year (0) Yes 578 (13.5) 827 (14.1) 293 (15.4) 1698 (14.1)
No 3707 (86.5) 5055 (85.9) 1606 (84.6) 10,368 (85.9)
Sleep medication summer (0) Yes 259 (6.0) 382 (6.5) 167 (8.8) 808 (6.7)
No 4026 (94.0) 5500 (93.5) 1732 (91.2) 11,258 (93.3)
road than in the total study population. Furthermore, of the total study population, 11.8% (n= 1337) was in the category of high degree of mental distress.
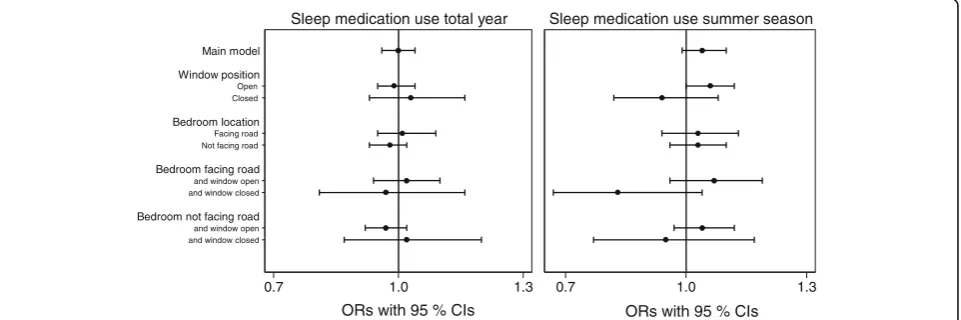
Fig. 1 shows the results from the regression analyses for sleep medication use during the total year and during the summer season, where all analyses are adjusted for potential confounders. The results from the analysis of sleep medication use during the total year indicated no statistically significant association with road traffic noise [odds ratio (OR) = 1.00; 95% confidence interval (CI): 0.96, 1.04]. Regarding sleep medication use during the summer season, we observed a borderline statistically significant association among those sleeping with the bedroom window open (OR = 1.06; 95% CI: 1.00, 1.12). There was a negative, but not statistically significant as-sociation among those keeping their bedroom window closed (OR = 0.94; 95% CI: 0.82, 1.08). Furthermore, when stratifying on window position within the group having the bedroom facing a road, we observed an even stronger negative effect estimate among those sleeping with the bedroom window closed (OR = 0.83; 95% CI: 0.67, 1.04). Among those sleeping with the bedroom window open, the effect estimate remained similar to the group keeping the window open within the total study population (OR = 1.07; 95% CI: 0.96, 1.19). In the analyses stratified on bedroom location, no difference in the effect estimate was shown. A detailed overview of the results is shown in Additional file 2: Table S1.
Of the total study population, there was 1033 (8.6%) participants who had filled two or more prescriptions on hypnotics during 2009. A total of 208 (1.7%) had filled two or more prescriptions during the summer season 2009. When using two or more prescriptions as the out-come for one year in total, the effect estimate remained similar, compared to the main analysis (OR = 0.99; 95% CI: 0.94, 1.04). For the summer season, we observed a
reduction in the estimate by using two or more prescrip-tions as the outcome (OR = 0.98; 95% CI: 0.88, 1.08).
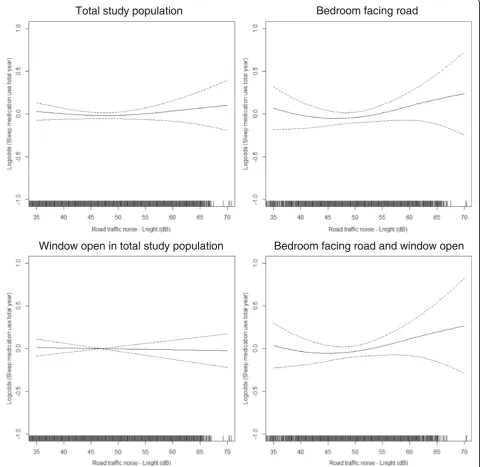
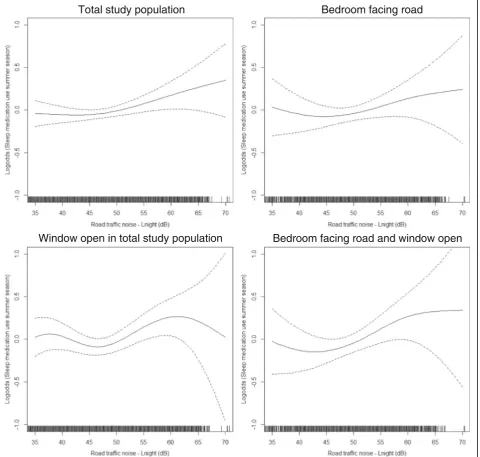
Visual assessment of the association between noise and medication use during the total year indicated a slight exposure-response relationship from aroundLnight
50 dB among individuals with their bedroom facing a road (Fig. 2). For the summer season, an exposure-response relationship from aroundLnight45 dB was
indi-cated in the total study population (Fig. 3). Furthermore, among those also sleeping with the window open, the association seemed more unclear with an increase from around Lnight 50 dB and, then, a decrease from around
Lnight65 dB. In the group having their bedroom facing a
road, the association increased slightly from around Lnight50 dB, but then leveled off aroundLnight60 dB. A
similar tendency was shown among those who both had the bedroom facing a road and kept the window open.
In the analyses stratified on high vs. low degree of mental distress, the effect estimates were similar for sleep medication use during the total year. For sleep medication use in the summer season, on the other hand, we observed a higher effect estimate among those with a high degree of mental distress (OR = 1.09; 95% CI: 0.98, 1.21) than among those with low mental dis-tress (OR = 1.03; 95% CI: 0.96, 1.10). However, these re-sults were not statistically significant and the confidence intervals of the two strata also overlapped.
In assessing the relation between sleep disturbances and sleep medication use, we found that 590 (46%) among the participants having difficulties falling asleep had filled a prescription of sleep medications in 2009. The corresponding proportions for those reporting awakenings during the night and to wake up too early were 537 (35.8%) and 437 (34.0%), respectively.
The interaction tests between traffic noise exposure and sex on sleep medication use were not statistically
Open Closed
Facing road Not facing road
and window open and window closed
and window open and window closed Main model
Window position
Bedroom location
Bedroom facing road
Bedroom not facing road
0.7 1.0 1.3
Sleep medication use total year
0.7 1.0 1.3
Sleep medication use summer season
ORs with 95 % CIs ORs with 95 % CIs
significant for either the analysis of sleep medication use during the total year (p = 0.42) or the summer season (p = 0.28). The results from the sex-stratified analyses are shown in Additional file 1: Table S1.
Discussion
In the present study, we used registry data for investigat-ing the association between nighttime road traffic noise and sleep medication use. This association was assessed both for sleep medication use for the total year and for the
summer season. Our findings showed no association be-tween traffic noise and sleep medication use during the total year. Medication use during the summer season was positively, but not statistically significantly related to traf-fic noise. According to degree of mental distress, there was no difference in the association for sleep medication use during the total year. Although we observed a differ-ence in effect estimates for the summer season, there was no clear evidence of a stronger association among those with a high vs. low degree of mental distress.
Total study population
Window open in total study population
Bedroom facing road and window open
Bedroom facing road
A previous study on road traffic noise and registry based sleep medication use reported no statistically sig-nificant association [21], which is in accordance with our findings. This study did, however, include anxiolytics and antidepressants in addition to hypnotics in the out-come. Another study that included both hypnotics and anxiolytics reported an association with traffic noise, but only among individuals living in areas low in social deprivation [20]. Because we considered sleep medica-tion use as an indicator of sleep problems, hypnotics were the only drug included as outcome in the present
study. Although anxiolytics and antidepressants may be used as sleep medications, hypnotics are likely to reflect sleep disturbances more specifically since treatment of sleep disturbances is its main function. Furthermore, hypnotics are the most commonly prescribed drug to treat sleep problems in Norway [43]. Previous studies having applied self-reported sleep medication use re-ported no association with road traffic noise [10, 18, 19]. The focus of the present study is on road traffic noise, but sleep medication use has also been studied in rela-tion to other modes of traffic noise. One study on rail
Total study population
Bedroom facing road
Window open in total study population
Bedroom facing road and window open
traffic noise reported an effect on self-reported sleep medication use the last year [44]. Furthermore, aircraft noise in the late evening has been associated with self-reported use of non-prescribed sleep medications [45].
In the analyses using the outcome of two or more pre-scriptions, the effect estimate remained similar to the main analysis for one year in total. For the summer sea-son, on the other hand, the effect estimate was reduced and there was no longer a positive association between noise and medication use. Only a very small proportion (< 2%) of the study population had filled two or more prescriptions during the three summer months, which may partly explain the reduction in the association.
In the present study, the association between noise and medication use was slightly more pronounced for the summer season than for the total year. This can be seen in context with a previous study that found that noise annoyance was more frequently reported in the summer season than during the winter season [24]. Fur-ther, we found that the association between noise and sleep medication use during the summer season was stronger among those sleeping with the bedroom win-dow open, than for the total study population. In the Nordic countries, it is more common to keep the bed-room window open during summer than other parts of the year, which may explain why we did not see a similar association for the total year. Among those sleeping with the bedroom window closed we observed a negative as-sociation, indicating a protective effect. When stratifying on window opening and closing among those having the bedroom facing a road, this negative effect was even fur-ther strengthened. The explanation may be that the dif-ference in indoor and outdoor nighttime road traffic noise is likely to be larger when the bedroom is facing a road compared to a shielded side. In contrast, a study by Babisch and co-workers [46] found that individuals keeping the bedroom window closed were more annoyed by noise than those keeping the window open. Accord-ing to the authors’interpretation, window closing served as an indicator of perceived annoyance rather than a modifier reducing annoyance. However, a similar effect of window position was not found for the association be-tween road traffic noise and hypertension [46]. Never-theless, by keeping the bedroom window closed, the indoor level from outdoor road traffic noise will be re-duced considerably. The conflicting results regarding the effect of window opening and closing habits on noise and health associations may reflect the complexity of such possible coping mechanisms, and that the effect on, or of such strategies may differ depending on the health outcome under study.
The analyses stratified on bedroom location did not show any notable differences in the effect estimates. This is contrary to what we expected since noise exposure is
commonly estimated for the most exposed façade of the building and the bedroom could be located at a shielded facade. Although sleep medication use is not completely comparable to self-reported sleep disturbances, we found higher estimates for the group with the bedroom facing a road in a study on noise and sleep disturbances [10]. Fur-thermore, it has been pointed out that bedroom location should be taken into account in order not to underesti-mate the true effect of noise on sleep [5, 47–49]. As far as we know, this is the first study on road traffic noise and registry based sleep medication use to include window opening behavior and bedroom location in the analyses.
We observed a higher effect estimate in the association between noise and sleep medication use among those with a high vs. low degree of mental distress. However, the con-fidence intervals overlapped, so the difference in the esti-mates may be due to random variation. In line with our findings, a previous study on traffic noise and psycho-tropic medication use, including sleep medications, re-ported no difference in the association according to level of anxiety score [21]. However, a stronger association be-tween noise and sleep disturbances has been reported for individuals with high vs. low trait anxiety [6]. Although sleep medication use may be a proxy for sleep distur-bances, this outcome may represent more severe sleep dis-orders [50]. Thus, our finding may be due to a less clear association between noise and sleep medication use than between noise and self-reported sleep disturbances.
Because of the well-established association between traffic noise and sleep disturbances, we expected to find an association between road traffic noise and sleep medication use. However, not all people suffering from sleeping problems may use prescribed sleep medication. In the present study, we found that less than half of the participants reporting any of the sleep problems difficul-ties falling asleep, awakenings during the night, or wak-ing up too early had filled a prescription on sleep medications. Further, sleep medication use may repre-sent, or at least include, more severe perceived sleep dis-turbances not strongly associated with noise. Moreover, the use of sleep medication can potentially affect how someone would respond to questionnaire items on sleep disturbances. In our previous paper on self-reported sleep disturbances and sleep medication use [10] we dis-cussed the possibility that someone using sleep medica-tions might respond to sleep well because of the effect of the medication. On the other hand, it is also possible that a sleep medication user will report poor sleep be-cause of the need for medication in order to sleep well. Thus, the relationship between sleep medication use and self-reported sleep is not easy to interpret.
examine health effects from environmental exposures. In-formation bias was prevented by using modeled noise ex-posure levels and registry data on sleep medications obtained independently both of each other, and other questionnaire data. The noise exposure was thoroughly assessed, using a detailed noise model. Furthermore, the study population included participants from both urban and suburban areas of the City of Oslo. This resulted in a broad range of noise exposure levels, which strengthened the possibility to detect associa-tions. A common approach in studies on noise and health is to use a cut off level for the noise exposure in order to account for background noise. In the present study, we found it appropriate to use the full range of exposure levels in the analyses. Firstly, be-cause the only noise source included in the noise model is road traffic noise. Thus, by increasing the lowest modeled noise levels to a level of background noise, misclassification of exposure would likely occur, the mean exposure level in the study population would increase, and the association between road traffic noise and sleep medication use could poten-tially be overestimated. Furthermore, a cut off would also mean that some of the variance in the exposure is lost and the accuracy of the analytic model will consequently be reduced.
In NorPD, the date of each dispensed drug is regis-tered. This enabled us to study sleep medication use over specific periods of time, such as during one year and the summer season. This is often not possible in self-report questionnaires, where medication use is commonly reported for a fixed period of time such as the last year.
Since we had questionnaire information about whether the bedroom was facing a road or a shielded side of the building we were able to perform analyses according to location of bedroom. This could poten-tially reduce exposure misclassification since the noise exposure was assessed for the most exposed façade. Furthermore, we had access to a large set of potential confounders from the questionnaire, the City of Oslo, and Statistics Norway, including population density and variables on SES. To select confounders for the statistical model, we applied the DAG framework, a thorough procedure for confounder selection in order to minimize bias [51].
A limitation with the present study is that it is of cross-sectional design, and we therefore cannot ascertain that the noise exposure precedes hypnotics use. How-ever, in our analytic sample we only included the indi-viduals that had lived at their current home address for more than one year. Hence, the noise exposure is likely to have been stable for some time. The study had a re-sponse rate of 48%, which is not optimal regarding
representativeness. Although the generalizability of the study may be affected by a low response rate, this is only the case if the relationship between exposure and outcome is different among the study participants and those who did not participate [52]. We have no reason to assume such differences. Further, we did not have information on sound insulation factors such as type of bedroom window, ventilation, and façade insulation, which affects the trans-mission of outdoor traffic noise to noise levels inside the bedroom. However, the sound insulating effect of these factors are highly minimized when the windows are kept open, which was the case for the majority of our study sample, as 89% reported to keep their bedroom window open during the night. Nevertheless, we cannot rule out the possibility that some exposure misclassification has occurred.
A limitation in using registry data on medications is that registries on prescription drugs commonly only include information on whether a drug has been dis-pensed. Hence, there is no information on whether the medication is actually being used. Still, we con-sider it likely that a person who obtains a prescription on hypnotics and fills it at a pharmacy experiences sleep disturbances and has the intention of using the medication.
In the analyses of sleep medication use during the summer season, the noise levels should optimally have reflected this time of the year, however no such data were available. Still, the noise metric that we used,Lnight,
is commonly used in scientific studies and is currently used by WHO for providing guidelines for nighttime noise [53].
Conclusions
The results of the present study suggest no association between nighttime road traffic noise and sleep medica-tion use during one year. Furthermore, there was no in-dication that the association differed according to degree of mental distress. These main findings may indicate that sleep medication use possibly represent more severe sleep problems not strongly associated with road traffic noise.
Additional file
Additional file 1: Figure S1.Simplified directed acyclic graph for the association between road traffic noise and sleep medication use. Some variables have been grouped for legibility. a Includes the variables age, sex, and having children≤5 years b Includes the variables education and household income c Includes the variables smoking status, alcohol use, caffeine use, physical activity, and night shift work. (DOCX 64 kb)
Additional file 2: Table S1.ORs and 95 % CIs for the association between nighttime road traffic noise (Lnight) and sleep medication use by 5 dB increase in noise level. (DOCX 24 kb)
Abbreviations
ATC:Anatomical Therapeutic Chemical; CI: Confidence interval;
DAG: Directed acyclic graph; DALY: Disability adjusted life-year; dB: decibel; GAM: Generalized Addictive Model; GIS: Geographic Information System; HELMILO: The Health and Environment in Oslo Study; HSCL: Hopkins Symptoms Checklist; NOK: Norwegian kroner; NorPD: Norwegian Prescription Database; OR: Odds ratio; SES: Socioeconomic status; WHO: World Health Organization
Acknowledgements
The authors would like to thank Erik Aune at the City of Oslo, Agency for Urban Environment for invaluable help with the noise exposure data.
Funding
This work was funded by the Research Council of Norway–Program for Environmental Exposures and Health Outcomes. Project no.: 204,535.
Availability of data and materials
The datasets generated during and/or analyzed for the current study are not publicly available due to confidentiality and restrictions regarding data sharing for the HELMILO project and the registry data linked to the HELMILO, and were used with ethical approval for this specific study. The data, with certain restrictions, are however available from the authors upon reasonable request and with permission from the Norwegian Institute of Public Health and other regulatory bodies.
Authors’contributions
JE planned the study design, analyzed the data, interpreted the results, and prepared the manuscript. BO collected the data, prepared the data files, and contributed to the study design, data analyses, interpretation of the results, and revision of the manuscript. NHK collected the data and contributed to the study design, interpretation of the results, and revision of the manuscript. SS contributed to the study design, interpretation of the results, and revision of the manuscript. PN contributed with feedback and advice on the study design and interpretation of the results. PES collected the data and contributed to revision of the manuscript. ES contributed to the
interpretation of the results and revision of the manuscript. DH contributed with feedback and advice on the study design, and interpretation of the results. GMA collected the data, acquired funding, supervised the project, and contributed to the study design, interpretation of the results, and drafting of the manuscript. All authors read and approved the final manuscript.
Ethics approval and consent to participate
The study was approved by the Regional Committee for Medical Research Ethics in Norway and the Norwegian Data Inspectorate. Each participant provided written informed consent.
Consent for publication
Not applicable.
Competing interests
The authors declare that they have no competing interests.
Publisher’s Note
Springer Nature remains neutral with regard to jurisdictional claims in published maps and institutional affiliations.
Author details
1Division of Infection Control and Environmental Health, Department of Air
Pollution and Noise, Norwegian Institute of Public Health, P.O. Box 4404 Nydalen, N-0403 Oslo, Norway.2Division of Mental and Physical Health, Department of Mental Disorders, Norwegian Institute of Public Health, P.O. Box 4404 Nydalen, N-0403 Oslo, Norway.3Norwegian Centre for Addiction
Research (SERAF), University of Oslo, P.O. Box N-1039 Blindern, 0315 Oslo, Norway.4Department of Community Medicine and Global Health, University of Oslo, Faculty of Medicine, P.O. Box N-1130 Blindern, 0318 Oslo, Norway.
5Division of Mental and Physical Health, Department of Noncommunicable
Diseases, Norwegian Institute of Public Health, P.O. Box 4404 Nydalen, N-0403 Oslo, Norway.6Department of Public Health and Nursing, Norwegian University of Science and Technology, Faculty of Medicine and Health Sciences, P.O. Box 8905, N-7491 Trondheim, Norway.7The Dutch National
Institute for Public Health and the Environment (RIVM), P.O. Box 1, 3720, BA, Bilthoven, the Netherlands.
Received: 3 May 2017 Accepted: 12 October 2017
References
1. WHO. Burden of disease from environmental noise. Quantification of healthy life years lost in Europe. Copenhagen. Denmark: WHO Regional Office for Europe; 2011.
2. European Environment Agency. Noise in Europe 2014. EEA Report. Luxembourg: Publications Office of the European Union; 2014.
3. Muzet A. Environmental noise, sleep and health. Sleep Med Rev. 2007; 11:135–42.
4. Pirrera S, De Valck E, Cluydts R. Nocturnal road traffic noise: a review on its assessment and consequences on sleep and health. Environ Int. 2010;36:492–8.
5. Miedema HM, Vos H. Associations between self-reported sleep disturbance and environmental noise based on reanalyses of pooled data from 24 studies. Behav Sleep Med. 2007;5:1–20.
6. Halonen JI, Vahtera J, Stansfeld S, Yli-Tuomi T, Salo P, Pentti J, et al. Associations between nighttime traffic noise and sleep: the Finnish public sector study. Environ Health Perspect. 2012;120:1391–6.
7. Basner M, Müller U, Elmenhorst E-M. Single and combined effects of air, road, and rail traffic noise on sleep and recuperation. Sleep. 2011;34:11–23. 8. Aasvang GM, Øverland B, Ursin R, Moum TA. Field study of effects of road
traffic and railway noise on polysomnographic sleep parameters. J Acoust Soc Am. 2011;129:3716–26.
9. Öhrström E, Hadzibajramovic E, Holmes M, Svensson H. Effects of road traffic noise on sleep: studies on children and adults. J Environ Psychol. 2006;26:116–26.
10. Evandt J, Oftedal B, Krog NH, Nafstad P, Schwarze P, Aasvang GM. A population-based study on nighttime road traffic noise and insomnia. Sleep. 2017; 40:zsw055.
11. Sørensen M, Andersen ZJ, Nordsborg RB, Becker T, Tjønneland A, Overvad K, et al. Long-term exposure to road traffic noise and incident diabetes: a cohort study. Environ Health Perspect. 2013;121:217–22.
12. Christensen JS, Raaschou-Nielsen O, Tjonneland A, Overvad K, Nordsborg RB, Ketzel M, et al. Road traffic and railway noise exposures and adiposity in adults: a cross-sectional analysis of the Danish diet, cancer, and health cohort. Environ Health Perspect. 2016;124:329–35.
13. Sørensen M, Andersen ZJ, Nordsborg RB, Jensen SS, Lillelund KG, Beelen R, et al. Road traffic noise and incident myocardial infarction: a prospective cohort study. PLoS One. 2012;7:e39283.
14. Floud S, Blangiardo M, Clark C, de Hoogh K, Babisch W, Houthuijs D, et al. Exposure to aircraft and road traffic noise and associations with heart disease and stroke in six European countries: a cross-sectional study. Environ Health. 2013;12:89.
15. Sygna K, Aasvang GM, Aamodt G, Oftedal B, Krog NH. Road traffic noise, sleep and mental health. Environ Res. 2014;131:17–24.
16. Orban E, McDonald K, Sutcliffe R, Hoffmann B, Fuks KB, Dragano N, et al. Residential road traffic noise and high depressive symptoms after five years of follow-up: results from the Heinz Nixdorf recall study. Environ Health Perspect. 2016;124:578–85.
in a large case-control study based on secondary data. Environ Res. 2017; 152:263–71.
18. de Kluizenaar Y, Janssen SA, van Lenthe FJ, Miedema HM, Mackenbach JP. Long-term road traffic noise exposure is associated with an increase in morning tiredness. J Acoust Soc Am. 2009;126:626–33.
19. Floud S, Vigna-Taglianti F, Hansell A, Blangiardo M, Houthuijs D, Breugelmans O, et al. Medication use in relation to noise from aircraft and road traffic in six European countries: results of the HYENA study. Occup Environ Med. 2011;68:518–24.
20. Bocquier A, Cortaredona S, Boutin C, David A, Bigot A, Sciortino V, et al. Is exposure to night-time traffic noise a risk factor for purchase of anxiolytic– hypnotic medication? A cohort study. Eur J Pub Health. 2013;24:298–303. 21. Halonen JI, Lanki T, Yli-Tuomi T, Turunen AW, Pentti J, Kivimäki M, et al.
Associations of traffic noise with self-rated health and psychotropic medication use. Scand J Work Environ Health. 2014;40:235–43.
22. Barregard L, Stansfeld S. Medication use as an outcome variable in environmental (noise) epidemiology. Scand J Work Environ Health. 2014;40:211–3.
23. Miedema HM, Fields JM, Vos H. Effect of season and meteorological conditions on community noise annoyance. J Acoust Soc Am. 2005;117: 2853–65.
24. Brink M, Schreckenberg D, Vienneau D, Cajochen C, Wunderli JM, Probst-Hensch N, et al. Effects of scale, question location, order of response alternatives, and season on self-reported noise annoyance using ICBEN scales: a field experiment. Int J Environ Res Public Health. 2016;13 25. Sørensen M, Hvidberg M, Hoffmann B, Andersen ZJ, Nordsborg RB, Lillelund
KG, et al. Exposure to road traffic and railway noise and associations with blood pressure and self-reported hypertension: a cohort study. Environ Health. 2011;10:92.
26. Furu K, Wettermark B, Andersen M, Martikainen JE, Almarsdottir AB, Sørensen HT. The Nordic countries as a cohort for
pharmacoepidemiological research. Basic Clin Pharmacol Toxicol. 2010; 106:86–94.
27. WHOCC (WHO Collaborating Centre for Drug Statistics Methodology). Guidelines for ATC classification and DDD assignment. Oslo, Norway. 2017:2016.
28. Berg C, Blix HS, Fenne O, Husabø KJ, Selmer R, Torheim S, et al. The Norwegian prescription database 2011–2015. Legemiddelstatistikk 2016:2. Oslo. Norway: The Norwegian Institute of Public Health; 2016.
29. Bendtsen H. The Nordic prediction method for road traffic noise. Sci Total Environ. 1999;235:331–8.
30. Ringheim M. The new Nordic prediction method for railway noise. J Sound Vib. 1996;193:277–82.
31. Nordic Council of Ministers. Road traffic noise - Nordic prediction method. TemaNord. Copenhagen. 1996;1996:525.
32. Nordic Council of Ministers. Railway traffic noise. The Nordic prediction method. TemaNord. Copenhagen. 1996;1996:524.
33. DataKustik. CadnaA (computer aided noise abatement). Manual version 3.4. Greifenberg. In: Germany: DataKustik GmbH; 2004.
34. European Commission: Directive 2002/49/EC of the European Parliament and of the Council of 25 June 2002 Relating to the assessment and management of environmental noise. Official Journal of the European Communities..
35. The City of Oslo. Støykartlegging 2012 (Strategic noise mapping in Oslo). In: Forurensningsforskriften kapittel 5 - Støysituasjon for år, vol. 2011. Oslo, Norway: Bymiljøetaten; 2013.
36. Pearl J. Causality: models, reasoning and inference. New York: Cambridge University Press; 2000.
37. Greenland S, Pearl J, Robins JM. Causal diagrams for epidemiologic research. Epidemiology. 1999;10:37–48.
38. Textor J, Hardt J, Knüppel S. DAGitty: a graphical tool for analyzing causal diagrams. Epidemiology. 2011;22:745.
39. WHO. Environmental health inequalities in Europe. Copenhagen. Denmark: WHO regional office for Europe; 2012.
40. Derogatis LR, Rickels K, Rock AF. The SCL-90 and the MMPI: a step in the validation of a new self-report scale. Br J Psychiatry. 1976;128:280–9. 41. Strand BH, Dalgard OS, Tambs K, Rognerud M. Measuring the mental health
status of the Norwegian population: a comparison of the instruments SCL-25, SCL-10, SCL-5 and MHI-5 (SF-36). Nord J Psychiatry. 2003;57:113–8. 42. Röösli M, Mohler E, Frei P, Vienneau D. Noise-related sleep disturbances:
does gender matter? Noise Health. 2014;16:197–204.
43. Sakshaug S, Handal M, Hjellvik V, Berg C, Ripel A, Gustavsen I, et al. Long-term use of Z-hypnotics and co-medication with benzodiazepines and opioids. Basic Clin Pharmacol Toxicol. 2017;120:292–8.
44. Lercher P, Brink M, Rudisser J, Van Renterghem T, Botteldooren D, Baulac M, et al. The effects of railway noise on sleep medication intake: results from the ALPNAP-study. Noise Health. 2010;12:110–9.
45. Franssen E, Van Wiechen C, Nagelkerke N, Lebret E. Aircraft noise around a large international airport and its impact on general health and medication use. Occup Environ Med. 2004;61:405–13.
46. Babisch W, Swart W, Houthuijs D, Selander J, Bluhm G, Pershagen G, et al. Exposure modifiers of the relationships of transportation noise with high blood pressure and noise annoyance. J Acoust Soc Am. 2012;132:3788–808. 47. Frei P, Mohler E, Röösli M. Effect of nocturnal road traffic noise exposure
and annoyance on objective and subjective sleep quality. Int J Hyg Environ Health. 2014;217:188–95.
48. Aasvang GM, Moum T, Engdahl B. Self-reported sleep disturbances due to railway noise: exposure-response relationships for nighttime equivalent and maximum noise levels. J Acoust Soc Am. 2008;124:257–68.
49. Fyhri A, Aasvang GM. Noise, sleep and poor health: modeling the relationship between road traffic noise and cardiovascular problems. Sci Total Environ. 2010;408:4935–42.
50. Omvik S, Pallesen S, Bjorvatn B, Sivertsen B, Havik OE, Nordhus IH. Patient characteristics and predictors of sleep medication use. Int Clin Psychopharmacol. 2010;25:91–100.
51. Shrier I, Platt RW. Reducing bias through directed acyclic graphs. BMC Med Res Methodol. 2008;8:70.
52. Rothman KJ. Epidemiology: an introduction. 2nd ed. New York, NY: Oxford University Press; 2012.
53. WHO. Night noise guidelines for Europe. Copenhagen. Denmark: WHO regional office for Europe; 2009.
• We accept pre-submission inquiries
• Our selector tool helps you to find the most relevant journal
• We provide round the clock customer support
• Convenient online submission
• Thorough peer review
• Inclusion in PubMed and all major indexing services
• Maximum visibility for your research
Submit your manuscript at www.biomedcentral.com/submit