R E S E A R C H
Open Access
Menu labeling implementation in dine-in
restaurants: the Public
’
s knowledge,
attitude and practices
Hadia Radwan
1*, Eman M. Faroukh
2and Reyad Shaker Obaid
1Abstract
Background:The practice of menu labeling is gaining popularity worldwide as a potential policy to reduce energy intake as a means to decrease the prevalence of obesity. So the purpose of the present study is to identify the knowledge, attitudes, and practices of adults regarding the implementation of menu labeling in dine-in restaurants. Methods:A cross sectional survey included 2020 male or female adults (aged≥18 years old) participants was collected from two cities in the United Arab Emirates(UAE). The participants filled a validated questionnaire in public places in two cities. A chi-squared test was conducted to compare responses for differences in proportions. Results:Most participants were knowledgeable about energy requirements for moderately active men (60%) and women (59%), but underestimated energy requirements for inactive adults (34%). The majority of the respondents favored the requirement to post calorie information on menus of dine-in restaurants at the point of purchase (76%). About half the respondents (48%) were more likely to visit restaurants with labeled menus.
Conclusion:The results from this study may form the basis for future strategies in mandating calorie labeling of restaurant menu items in UAE. Menu labeling may be a useful policy tool for promoting appropriate caloric consumption.
Keywords:Menu labeling, Nutrition, Restaurants, Knowledge, Attitude, Practice
Background
Excessive eating and unhealthy food selections are causative factors in one of the most persistent health ap-prehensions facing the Gulf countries. The latest re-search investigating the prevalence of obesity reveals that approximately one quarter of adults in the Gulf countries, 28.52% of women and 15.5% of men over the age of 20, are obese [1]. According to a recent report from the Health Authority in Abu Dhabi, obesity may account for up to 60% of nationals in the United Arab Emirates (UAE) [2]. An area of emerging importance as a policy with the potential to reduce the widespread oc-currence of obesity is the display of calorie information on restaurant menus in both dine-in and fast food chain restaurants [3].
Menu labeling is one strategy among a broad spectrum of efforts to reduce rates of obesity and its co-morbidities. Studies have shown that 90% of individuals ordering from restaurants underestimate the amount of energy within meals by as much as 600 kcal [4]. In the United States, a federal law obligates restaurant chains with 20 or more outlets to post nutrition information on their menus [5, 6]. Many studies have shown that the public is interested in knowing the number of calories present in the meals they order from restaurants [7]. Moreover, Spicer [8] showed that promoting the use of calorie information, and calorie awareness, supports lower-calorie choices at fast food eateries. Caloric label-ing is proposed as an innovative approach that will change the food environment, and increases customers’ awareness of calories, which may, in turn, help to lower the costs of the obesity epidemic [9].
Energy-dense foods consumed in restaurants are gen-erally higher in saturated fat, cholesterol and sugar. A
* Correspondence:[email protected]
1Department of Clinical Nutrition and Dietetics, College of Health Sciences/
Sharjah Institute for Medical Research, University of Sharjah, P. O Box 27272, Sharjah, United Arab Emirates
Full list of author information is available at the end of the article
transformation in the pattern of consumption has led to the creation of an obesogenic environment, and an in-crease in the prevalence of lifestyle diseases such as car-diovascular diseases and diabetes [10]. The share of daily calories consumed in restaurants and fast food establish-ments was reported to have increased from 6 to 20% be-tween 1977 and 78 and 2005–08 [11].
Consumers’knowledge of, and their ability to estimate, calorie count, and the fat, saturated fat, and sodium con-tent of food was investigated by Burton et al., [10]. The actual fat and saturated fat levels were found to be higher than consumers’ estimates [12], and menus lack the information that gives consumers the capacity to choose more healthful foods.
The purpose of the present study is to identify the knowledge, attitudes, and practices of adults regarding the implementation of menu labeling in dine-in restaurants.
Methods
The study was conducted in the cities of Sharjah and Dubai in the United Arab Emirates and approved by Eth-ical Committee at the University of Sharjah. Consent was obtained from participants before they were interviewed.
Target population
A convenient sample of 2020 participants was collected from the two cities. The criterion for inclusion was being an adult male or female aged≥18 years old. Data was collected using a questionnaire in different clusters in heavily populated areas. The questionnaires were distrib-uted in public places such as parks, malls, educational institutes, neighborhoods, governmental buildings, and coffee shops in Sharjah and Dubai.
It is worth noting that UAE has a high entry rate rec-ord from secondary to higher education [13]. It was re-ported that about 95% of all girls and 80% of boys finished their secondary high school year to apply for ad-mission to a higher education institution.
Study design
The study was a quantitative, cross-sectional study that used a relevant validated questionnaire [4]. Some modifi-cations to the questionnaire were made in order to iden-tify the percentage of participants having nutritional awareness and who were interested in the implementa-tion of calorie informaimplementa-tion on restaurant menus.
Data collection
A pilot study using the questionnaire was conducted to assess if any changes were required. The main question-naire was subsequently adjusted by adding a third op-tion, “Neither”, to the question asking whether the participants favor or oppose the government mandating menu labeling
The questionnaire was tested for validity by a panel composed of four professionals in the Clinical Nutrition and Dietetics Department. The questionnaire was di-vided into four main sections: background information, knowledge, attitude and practices. The background in-formation included age, gender, nationality, city of resi-dence, and the frequency of dining outside the home. Participants’ knowledge was tested by asking about the estimated daily energy requirements for each gender and for their different physical activity levels (active and in-active). Attitude of the population sample measured the extent to which menu labeling was important to the par-ticipant, whether they supported menus being labeled, and if so, whether stamping or labeling menus with cal-oric values was preferred. Practices assumed that dine-in restaurant menus were labeled and participants were asked if they would choose labeled menu restaurants, se-lect foods that are lower in calories, and whether their selection of foods was based on cost, appetite or caloric content.
The questionnaire was distributed along with the con-sent form and their contents were explained to the par-ticipants. The consent form, signed by the participants before completing the questionnaire, provided the op-tion to accept or refuse participaop-tion in the study.
Statistical analysis
Data was analyzed by using Statistical Package for the social sciences (SPSS) version 21.0(Statistical Package for Social Sciences, Version 21). Descriptive analysis, fre-quencies and percentages were calculated for demo-graphic data. Chi-square test was used to study the correlation between two variables. Differences were con-sidered significant atp< 0.05.
Results
Characteristics of the study sample
Approximately half of the respondents were females, under 24 years of age (60%), non-Emirati Arab (62%), living in Sharjah (52%), and had education more than a high school degree (76%). About one third (36%) of re-spondents reported visiting dine-in restaurants one to three times per month (Table 1).
Knowledge of daily caloric requirements
Most of the respondents were able to identify the cor-rect caloric intake for moderately active men (60%) and for moderately active women (59%) which, according to federal dietary guidelines, is between 1500 and less than 3000 kcal [14]. However, only 34% of participants were aware of the caloric requirements for inactive adults (Table 2).
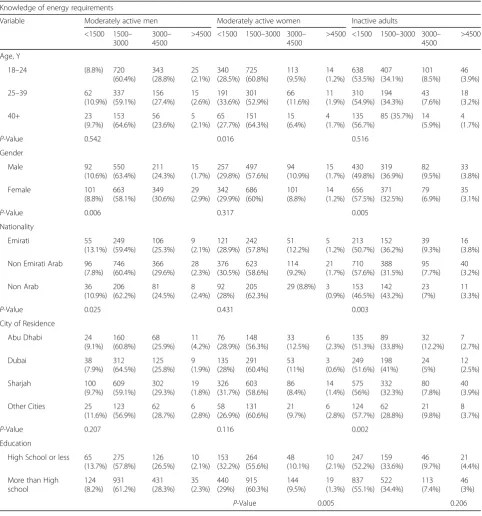
1500-3000Kcal — differed significantly by gender, na-tionality, and education (P < 0.05). Similarly, estimations of the correct daily energy requirements for moderately active women (1500-3000Kcal) were significantly differ-ent by age (P < 0.01). Moreover, the correct estimation of energy requirements for inactive adults differed significantly by gender, nationality, and city of residence (P <0.05) (Table 3).
Attitudes towards menu labeling
The majority of the participants reported that menu la-beling was very useful (47%) and somewhat useful (35%) (Table 4) and favored mandatory menu labeling (76%) (Table 5).
Age, gender and nationality are shown to be significant variables associated with the participants’ attitudes to-wards menu labeling. In particular, young females of non-Emirati Arab nationality are seen to favor menu la-beling in dine-in restaurants (P < 0.005) (Table 6).
Future practices towards menu labeling
When participants’ were asked about the likelihood of dining at a menu-labeled restaurant, 48% replied that they will more likely, to choose to dine in a restaurant that has menu labeled (Table 7).
The association between demographic variables of the participants and their likeliness to eat at a menu-labeled dine-in restaurant is shown. Significant differences by age, city of residence and education (P < 0.005) were re-ported for these practices (Table 8).
Discussion
This study has found that most participants estimated correctly the energy requirements for moderately active men and women, but tended to underestimate energy requirements for inactive adults. They expressed a posi-tive attitude towards menu labeling in dine in restau-rants; a majority viewed it as very or somewhat useful, reported being more likely to eat in a restaurant with menu labeled restaurant.
The findings of this study were consistent with those of Bleich & Pollack [4], who found that the American adult population was well informed about energy re-quirements for moderately active men and women, but tended to underestimate energy requirements for in-active adults. That study also reported that Americans expressed a positive attitude towards calorie posting in chain restaurants; a majority viewed it as very useful or somewhat useful. In the current study, the majority of the participants favored menu labeling, stating that hav-ing menus provide caloric labelhav-ing in dine–in restau-rants is very useful.
The results of this study also showed a positive correl-ation between age and likeliness to eat at a menu-Table 1Frequency distribution of the general characteristics of
the participants (N= 2020)
Variables Percent Number Gender
Male 43 870
Female 57 1146 Nationality
Emirati 21 422 Non Emirati Arab 62 1237 Non Arab 17 333 Age
18–24 60 1193 25–39 28 571
40+ 12 241
Education Level
High School or less 24 477 More than High school 76 1525 City of Residence
Abu Dhabi 13 263
Dubai 24 485
Sharjah 52 1035 Other Cities 11 216 Restaurant Visit
Never 3 68
1–3 times per month 36 715 1–2 times per week 35 700 3–4 times per week 16 329 Once Daily 10 195
Table 2Percentage distribution of the participants who knew the caloric recommendations of the different levels of activities for the men and women (N= 2020)
Variables Percent Number Moderately Active Men
Caloric Recommendations
Answered Correctly 60 1216 Answered Incorrectly 40 798 Moderately Active Women
Caloric Recommendations
Answered Correctly 59 1186 Answered Incorrectly 41 824 Inactive Adults Caloric
Recommendations
Table 3Percentage of the participants who expressed knowledge of energy requirements of active and inactive men or women (N= 2020)
Knowledge of energy requirements
Variable Moderately active men Moderately active women Inactive adults <1500 1500–
3000
3000– 4500
>4500 <1500 1500–3000 3000– 4500
>4500 <1500 1500–3000 3000– 4500
>4500 Age, Y
18–24 (8.8%) 720 (60.4%) 343 (28.8%) 25 (2.1%) 340 (28.5%) 725 (60.8%) 113 (9.5%) 14 (1.2%) 638 (53.5%) 407 (34.1%) 101 (8.5%) 46 (3.9%) 25–39 62
(10.9%) 337 (59.1%) 156 (27.4%) 15 (2.6%) 191 (33.6%) 301 (52.9%) 66 (11.6%) 11 (1.9%) 310 (54.9%) 194 (34.3%) 43 (7.6%) 18 (3.2%) 40+ 23 (9.7%) 153 (64.6%) 56 (23.6%) 5 (2.1%) 65 (27.7%) 151 (64.3%) 15 (6.4%) 4 (1.7%) 135 (56.7%)
85 (35.7%) 14 (5.9%)
4 (1.7%)
P-Value 0.542 0.016 0.516 Gender Male 92 (10.6%) 550 (63.4%) 211 (24.3%) 15 (1.7%) 257 (29.8%) 497 (57.6%) 94 (10.9%) 15 (1.7%) 430 (49.8%) 319 (36.9%) 82 (9.5%) 33 (3.8%) Female 101 (8.8%) 663 (58.1%) 349 (30.6%) 29 (2.9%) 342 (29.9%) 686 (60%) 101 (8.8%) 14 (1.2%) 656 (57.5%) 371 (32.5%) 79 (6.9%) 35 (3.1%)
P-Value 0.006 0.317 0.005 Nationality Emirati 55 (13.1%) 249 (59.4%) 106 (25.3%) 9 (2.1%) 121 (28.9%) 242 (57.8%) 51 (12.2%) 5 (1.2%) 213 (50.7%) 152 (36.2%) 39 (9.3%) 16 (3.8%) Non Emirati Arab 96
(7.8%) 746 (60.4%) 366 (29.6%) 28 (2.3%) 376 (30.5%) 623 (58.6%) 114 (9.2%) 21 (1.7%) 710 (57.6%) 388 (31.5%) 95 (7.7%) 40 (3.2%) Non Arab 36
(10.9%) 206 (62.2%) 81 (24.5%) 8 (2.4%) 92 (28%) 205 (62.3%)
29 (8.8%) 3 (0.9%) 153 (46.5%) 142 (43.2%) 23 (7%) 11 (3.3%)
P-Value 0.025 0.431 0.003 City of Residence
Abu Dhabi 24 (9.1%) 160 (60.8%) 68 (25.9%) 11 (4.2%) 76 (28.9%) 148 (56.3%) 33 (12.5%) 6 (2.3%) 135 (51.3%) 89 (33.8%) 32 (12.2%) 7 (2.7%) Dubai 38 (7.9%) 312 (64.5%) 125 (25.8%) 9 (1.9%) 135 (28%) 291 (60.4%) 53 (11%) 3 (0.6%) 249 (51.6%) 198 (41%) 24 (5%) 12 (2.5%) Sharjah 100 (9.7%) 609 (59.1%) 302 (29.3%) 19 (1.8%) 326 (31.7%) 603 (58.6%) 86 (8.4%) 14 (1.4%) 575 (56%) 332 (32.3%) 80 (7.8%) 40 (3.9%) Other Cities 25
(11.6%) 123 (56.9%) 62 (28.7%) 6 (2.8%) 58 (26.9%) 131 (60.6%) 21 (9.7%) 6 (2.8%) 124 (57.7%) 62 (28.8%) 21 (9.8%) 8 (3.7%)
P-Value 0.207 0.116 0.002 Education
High School or less 65 (13.7%) 275 (57.8%) 126 (26.5%) 10 (2.1%) 153 (32.2%) 264 (55.6%) 48 (10.1%) 10 (2.1%) 247 (52.2%) 159 (33.6%) 46 (9.7%) 21 (4.4%) More than High
school 124 (8.2%) 931 (61.2%) 431 (28.3%) 35 (2.3%) 440 (29%) 915 (60.3%) 144 (9.5%) 19 (1.3%) 837 (55.1%) 522 (34.4%) 113 (7.4%) 46 (3%)
P-Value 0.005 0.206
Table 4Percentage distribution of the participants who expressed their views about the usefulness of menu labeling (N= 2020)
Variables Percent Number Very Useful 47 941 Somewhat Useful 35 709 Not Very Useful 12 233 Not At All Useful 7 136
Table 5Percentage distribution of the participants who expressed their views about the usefulness of menu labeling (N= 2020)
Variables Percent Number
Favor 76 1539
Oppose 7 131
labeled restaurant, with the majority of the young partic-ipants responded positively to menu-labeling. Moreover, it was found that participants who had more than high school education answered the daily caloric requirement questions correctly. Krukowski et al. [15] has reported that college students want nutrition labels and would use them to inform their food purchasing decisions.
In our study, the majority of the participants, and women in particular, had a favorable response to menu labeling and correctly estimated the caloric requirements for active women and men. The majority of the
respondents in this study expressed their intention to choose to eat at a menu-labeled restaurant. Similarly, Din [16] showed that that women were more interested in menu labeling, and believed that it aid in regulating their intake than men.
It is worth noting that the majority of the respondents in this study eat more frequently at restaurants. Mussai-ger [17] had reported that the proportion of obesity in-creased to reach 52.7% among those who eat outside the home for more than 5 times per week since the foods are eaten outside the home is more likely to be high in total energy, total fat, saturated fat.
Several prospective studies have reported that eating more frequently away from home in restaurants, is associ-ated with weight gain over time compared to infrequent restaurant eating [18, 19]. Therefore, a better understanding of public perceptions about calorie posting may encourage policy makers to adopt this low-cost policy tool in order to educate consumers to make healthier food choices.
It has been reported that people who used menu label-ing to determine calorie content consumed significantly Table 6Percentage distribution of the demographic variables
of the participants as associated with attitude towards menu labeling (2020)
Favor Oppose Neither
Variable % % %
Age, Y
18–24 72.2 7.5 20.3 25–39 81.9 5.6 12.5 40+ 85 3.3 (11.7
P-Value 0.000 Gender
Male 73.1 7.3 19.7 Female 79 5.9 15
P-Value 0.007 Nationality
Emirati 76.8 8.8 14.5 Non Emirati Arab 76.9 5.8 17.3 Non Arab 74.3 5.4 20.2
P-Value 0.071 City of Residence
Abu Dhabi 79.8 5.7 14.4 Dubai 74.8 5.8 19.3 Sharjah 75.7 7.1 17.2 Other Cities 80.9 5.1 14
P-Value 0.353 Education
High school or less 74.7 6.8 18.6 More than High school 77.2 6.3 16.5
P-Value 0.520
Table 7Percentage distribution of the participants who are likely to eat at a labeled restaurant (N= 2020)
Percent Number Variable
More Likely 48 961 Less Likely 24 486 Neither 28 570
Table 8Percentage distribution of the demographic variables of the participants as associated with their likeliness towards dining in a menu labeled restaurant (2020)
More Likely Less Likely Neither Age, Y
18–24 507 (42.5%) 315 (26.4%) 370 (31.0%) 25–39 308 (54.0%) 120 (21.1%) 142 (24.9%) 40+ 137 (57.1%) 47 (19.6%) 56 (23.3%)
P-Value 0.000 Gender
Male 395 (45.5%) 213 (24.5%) 260 (30.0%) Female 564 (49.3%) 271 (23.7%) 310 (27.1%)
P-Value 0.217 Nationality
Emirati 205 (48.6%) 100 (23.7%) 117 (27.7%) Non Emirati Arab 596 (48.2%) 304 (24.6%) 336 (27.2%) Non Arab 145 (43.8%) 72 (21.8%) 114 (34.4%)
P-Value 0.135 City of Residence
Abu Dhabi 112 (42.7%) 84 (32.1%) 66 (25.2%) Dubai 238 (49.1%) 95 (19.6%) 152 (31.3%) Sharjah 496 (48.0%) 241 (23.3%) 297 (28.7%) Other Cities 107 (49.8%) 52 (26.5%) 51 (23.7%)
P-Value 0.007 Education
High school or less 205 (43.0%) 116 (24.3%) 156 (26.7%) More than High school 750 (49.3%) 365 (24.0%) 407 (28.2%)
fewer calories during a meal compared with people who did not use menu labeling [20]. Roberto et al. [7] studied the impact of menu labeling on food choices and intake and found that research participants who received caloric-labeled menus consumed 14% fewer calories than those who received menus without calorie labeling. An average reduction of 100 cal per meal resulted among restaurant patrons who ordered reduced-calorie meals in response to calorie postings on the menus [21].
To our knowledge, the current study is the first to as-sess consumers’understanding of overall daily energy re-quirements and the perceived effectiveness of calorie posting in dine–in restaurants in the UAE. The results from this study may form the basis of future strategies in mandating calorie posting in dine-in restaurants as well as fast food chains in the United Arab Emirates.
Furthermore, menu-labeling may serve to encourage restaurants to highlight lower calorie options and/or introduce healthier options. Given the positive findings of intention to choose restaurants with labeled menus, some restaurants may also begin providing caloric infor-mation voluntarily.
This study has some limitations including, firstly, that as a cross-sectional study, it only allows associations to be addressed. Second, as Bleich & Pollack [4] stated, the range of calories in the correct response category for the caloric knowledge question was broad; thus, the finding of relatively high caloric knowledge may be biased up-wards. Third, given that the correct answer to the caloric knowledge questions was the same for all groups (e.g. moderately active men, moderately active women, and inactive adults), some participants may have assumed that the answer must change across groups. This would bias our results downwards and may partially explain our finding of low caloric literacy about inactive adults.
Conclusion
The results of this study encourage further research con-cerning the implementation of menu labeling in restau-rants. This is especially significant given that this is a new concept in the UAE. Additionally, research studies of nutrient and calorie awareness are needed to ensure that UAE residents understand calorie requirements and how to read and apply nutrition facts on product labels to their consumption practices. It would also be of inter-est to conduct an experimental study comparing two restaurants−one with menu labeling and one without− by measuring the amount of calories purchased by indi-viduals. Studies should identify how and where menu la-beling can be best presented to most effectively help consumers make healthier choices and lower their cal-oric intake.
Given that there is an increasing frequency of restaur-ant visitors in UAE, mandating calorie posting in
dine-in, as well as fast food restaurants may be a useful policy tool for promoting appropriate energy intake, to help consumers make food choices in restaurants, contribut-ing to lower rates of obesity.
Acknowledgements
We wish to thank Nama Al-Mosa, Sumaya Hashem, Jawaher Hilal, Ruba El-Hourani, and Deena Khales for their assistance in data collection.
Funding
There is no source of funding. The authors self-funded the research.
Availability of data and materials
The datasets during and/or analysed during the current study will be available from the corresponding author on reasonable request.
Authors’contribution
HR and EF and RO contributed to conception and design, acquisition of data, and interpretation of data. EF was involved in analyzing data and drafting manuscript. HR and RO have been involved in revising it critically for important intellectual content. HR gave final approval of the version to be published. Each author have participated sufficiently in the work to take public responsibility for appropriate portions of the content; and agree to be accountable for all aspects of the work in ensuring that questions related to the accuracy or integrity of any part of the work are appropriately investigated and resolved. All authors read and approved the final manuscript.
Competing interests
The authors declare that they have no competing interests.
Consent for publication Not applicable.
Ethics approval and consent to participate
The study was conducted in the cities of Sharjah and Dubai in the United Arab Emirates and approved by Ethical Committee at the University of Sharjah. Consent was obtained from participants before they were interviewed.
Author details
1Department of Clinical Nutrition and Dietetics, College of Health Sciences/
Sharjah Institute for Medical Research, University of Sharjah, P. O Box 27272, Sharjah, United Arab Emirates.2Dubai Health Authority, Dubai, United Arab
Emirates.
Received: 23 November 2016 Accepted: 10 January 2017
References
1. Al-Nohair S. Obesity in gulf countries. IJHSR (Qassim). 2014;8(1):79–83. 2. Health Authority Abu Dhabi. Health statistics: reliable excellence in
healthcare. 2014. www.haad.ae/statistics. Accessed June 2016.
3. Simon P, Jarosz CJ, Kuo T, Fielding JE. Menu labeling as a potential strategy for combating the obesity epidemic: a health impact assessment, published by division of chronic disease and injury prevention. Los Angeles County: Department of Public Health; 2008. p. 1–8.
4. Bleich SN, Pollack K. The publics’understanding of daily caloric recommendations and their perceptions of calorie posting in chain restaurants. BMC Public Health. 2010;10(121):1471–2458.
5. Bleich SN, Wolfson JA, Jarlenski MP, Block JP. Restaurants with calories displayed on menus Had lower calorie counts compared to restaurants without such labels. Health Aff. 2015;34(11):1877–84.
6. Lee-Kwan SH, Pan L, Maynard LM, McGuire LC, Park S. Factors associated with self-reported menu-labeling usage among US adults. J Acad Nutr Diet. 2016;15:1813–4.
8. Spicer D, Brissette I, Lowenfels A, Noble C. Predictors of total calories purchased at fast-food restaurants: restaurant characteristics, calorie awareness, and use of calorie information. J Nutr Educ Behav. 2013;45:404–11.
9. Huang C, Dumanovsky T. A brief overview of New York City’s calorie labeling regulations and evaluation. Nutr Today. 2010;45:226–8. 10. Burton S, Creyer E, Kees J, Huggins K. Attacking the obesity epidemic: the
potential health benefits of providing nutrition information in restaurants. Am J Public Health. 2006;96:1669–75.
11. Lin B, Guthrie J. Nutritional quality of food prepared at home and away from home, 1977–2008. U.S. Department of Agriculture, Economic Research Service; 2012.
12. Block JP, Condon S, Mullen J, Linakis S, Rifas’Shiman S, Gillman M. Consumers’estimation of calorie content at fast food restaurants: cross sectional observational study. Br Med J. 2014;10:f2907.
13. UAE Ministry of Education. Higher education in UAE. Washington: Publications of Embassy of United Arab Emirates; 2010. p. 1–3. www.uae-embassy.org.
14. Department of Health and Human Services and U.S. Department of Agriculture. Dietary guidelines for Americans. Washington DC: HHS and USDA; 2010.
15. Krukowski R, Harvey-Berino J, Kolodinsky J, Narsana RT, Desisto TP. Consumers may not use or understand calorie labeling in restaurants. J Acad Nutr Diet. 2006;106(6):917–20.
16. Din N, Zahari MSM, Shariff SM, Universiti Teknologi M. Nutritional labelling in Malaysian full service restaurant menu. J Asian behav Studies. 2011;1(3):51–9. 17. Musaiger AO. Overweight and obesity in eastern Mediterranean region:
prevalence and possible causes. J Obes. 2011;407237.
18. Bruemmer B, Krieger J, Saelens BE, Chan N. Energy, saturated fat, and sodium were lower in entrées at chain restaurants at 18 months compared with 6 months following the implementation of mandatory menu labeling regulation in King County, Washington. J Acad Nutr Diet. 2012;112(8):1169–76. 19. Thompson O, Ballew C, Resnicow K, Must A, Bandini L, Cyr H, Dietz W. Food purchased away from home as a predictor of change in BMI z-score among girls. Int J Obes. 2004;28(2):282–9.
20. Duffey K, Gordon-Larsen P, Jacobs D, Williams O, Popkin B. Differential associations of fast food and restaurant food consumption with 3-y changes in body mass index: the coronary artery risk development in young adults study. Am J Clin Nutr. 2007;85:201–8.
21. Kuo T, Jarosz CJ, Simon P, Fielding JE. Menu labeling as a potential strategy for combating the obesity epidemic: a health impact assessment. Am J Public Health. 2009;99(9):1680–6.
• We accept pre-submission inquiries
• Our selector tool helps you to find the most relevant journal • We provide round the clock customer support
• Convenient online submission • Thorough peer review
• Inclusion in PubMed and all major indexing services • Maximum visibility for your research
Submit your manuscript at www.biomedcentral.com/submit