International PhD Program in Biomolecular Sciences
Centre for Integrative Biology
29
thCycle
“U
NDERSTANDING THE ORGANIZATION AND
FUNCTIONAL CONTROL OF POLYSOMES BY
INTEGRATIVE APPROACHES
”
Tutor
Gabriella VIERO
Institute of Biophysics - CNR, Trento (IT)
Advisor
Toma TEBALDI
Centre for Integrative Biology, University of Trento (IT)
Co-advisor
Guido SANGUINETTI
School of Informatics, University of Edinburgh (UK)
Ph.D. Thesis of
Fabio LAURIA
Institute of Biophysics - CNR, Trento (IT)
Architectomics, Institute of Biophysics (National Research Council) of Trento (IT) and at the School of Informatics, University of Edinburgh (UK) between January 2014 and November 2017. I confirm that this is my own work and the use of all material from other sources has been properly and fully acknowledged. This work has not been submitted previously for any other degree at the University of Trento or Edinburgh or any other university.
November 2017
Contents
Abstract ... 7
1 Introduction ... 11
1.1 From DNA to proteins ... 11
1.2 Translation ... 11
1.3 Translation regulation ... 16
1.3.1 Codon usage bias ... 18
1.3.2 Ramp ... 19
1.4 Experimental techniques for study translation at the genome-wide level ... 20
1.4.1 Polysome profiling ... 22
1.4.2 Ribosome profiling ... 22
1.4.3 Atomic force microscopy ... 25
1.5 Mathematical models ... 26
1.5.1 Deterministic models ... 27
1.5.2 Stochastic models ... 29
1.5.3 Other models of translation ... 32
1.6 Translation in motor neuron diseases: the case of Spinal Muscular Atrophy ... 32
2 Mathematical models of translation ... 35
2.1 riboAbacus ... 35
2.2 riboSim ... 61
2.2.1 Materials and methods ... 62
2.2.2 Results ... 67
2.2.3 Conclusions ... 73
3 Development of tools for analysing ribosome profiling data ... 75
3.1 riboWaltz ... 75
3.2 riboScan ... 107
3.2.1 Materials and methods ... 109
4.1 Ribosome profiling datasets ... 114
4.2 Ribosome profiling of early-symptomatic SMA mouse brains ... 116
4.2.1 Ribosome profiling of actively translating ribosomes ... 116
4.2.2 Ribosome drop-off in SMA ... 121
4.2.3 Mislocalization of ribosomes along the 3 UTR in SMA? ... 124
4.3 Ribosome profiling of SMN-specialized ribosomes reveals a role for SMN in translation of the first codons ... 129
4.4 Loss of SMN-specialized ribosomes impacts on active translation in SMA ... 135
4.5 Conclusions ... 138
5 Discussion ... 141
Appendix ... 153
Bibliography ... 155
7
Abstract
Background and rationale
Translation is a fundamental biological process occurring in cells, carried out by ribosomes simultaneously bound to an mRNA molecule (polyribosomes). It has been exhaustively demonstrated that dysregulation of translation is implicated in a wide collection of pathologies including tumours and neurological disorders. Latest findings reveal the existence of translational regulatory mechanisms acting in cis or trans with respect to the mRNAs and governing the movement and the position of ribosomes along transcripts or directly impacting on the ribosome catalogue of its constituent proteins. For this reason, translational controls also account for widespread uncoupling between transcript and protein abundances in cells.
To explain the poor correlation between transcripts and protein levels, many computational models of translation have been developed. Usually, these approaches aim at predicting protein abundances in cells starting from the mRNA abundance. Despite the efforts of these modelling studies, a consensus model remains elusive, drawing to contradictory conclusions concerning the role of mRNA regulatory elements such as the usage of codons (codon usage bias) and slowdown mechanism at the beginning of the coding sequence (ramp). More recently, following the rapid and widespread diffusion of ribosome footprinting assays (RiboSeq), which enables the dissection of translation at single nucleotide resolution, a number of computational pipelines dedicated to the analysis of RiboSeq data have been proposed. These tools are typically designed for extracting gene expression alterations at the translational level, while the positional information describing fluxes and positions of ribosomes along the transcript is still underutilized.
Therefore, the polysome organization, in term of number and position of ribosomes along the transcript and the translational controls directed in shaping cellular phenotypes is still open to breakthrough discoveries.
Broad objectives
8
With this purpose, I developed riboWaves, an integrated bioinformatics suite divided in two branches. riboWaves includes in the first branch two modeling modules: riboAbacus, predicting the number of ribosomes per transcript, and riboSim, predicting ribosome localization along mRNAs. In the second branch, riboWaves provides two pipelines, riboWaltz and riboScan, for detailed analyses of ribosome profiling data aimed at providing meaningful and yet unexplored ribosome positional information. The models and the pipelines are implemented in C and R, respectively. riboAbacus and riboWaltz are available on GitHub.
Results
To predict the number of ribosomes per transcript and the position of ribosomes on mRNAs, I applied riboAbacus and riboSim, respectively, to transcriptomes of different organisms (yeast, mouse, human) for understanding the role of translational regulatory elements in tuning polysome in different organisms. First, I trained and validated performances of riboAbacus taking advantage of Atomic Force Microscopy images of polysomes, while performances of riboSim were assessed employing ribosome profiling data. Predictions provided by riboAbacus and riboSim were evaluated in parallel. I showed that the average number of ribosomes translating a molecule of mRNA can be well explained by the deterministic model, riboAbacus, that includes as features the mRNA levels, the mRNA sequences, the codon usage bias and a slowdown mechanism at the beginning of the CDS (ramp hypothesis). The predictions of ribosome localization by riboSim that used as features the mRNA sequence, the codon usage and the ramp, were run for yeast, mouse and human. I observed a good similarity between the predicted and experimental positions of ribosomes along transcripts in yeast, while poor similarity was obtained between predicted and experimental ribosome positions in the two mammals, suggesting the presence of more elaborate controls that tune ribosomes movement in higher eukaryotes than in simple species.
9
translating ribosomes along the coding sequence in the SMA condition (using riboWaltz); ii) in SMA-affected mice, the possible accumulation of ribosomes along the 3' UTR in neuro-related mRNAs (using riboScan); iii) the involvement of SMN-specialized ribosomes in playing a very intimate role with the elongation stage of translation of the first codons of transcripts (riboWaltz), iv) the loss of ribosomes at the 3rd codon in SMA in transcripts bound by SMN-specialized ribosomes and v) a remarkable connection between SMN and the down-regulation of genes in SMA-affected mice. Overall, these findings confirmed previous observation about possible SMN-related dysregulations of local protein synthesis in neurons. More importantly, they unravel a completely new role of SMN in tuning translation at multiple levels (initiation, elongation and the recycling of terminating ribosomes), opening new hypotheses and scenarios for explaining the most devastating genetic disease, leading cause worldwide of infant mortality.
Conclusions
11
1
Introduction
In this chapter I present the biological aspects related to this work. I start introducing the central dogma of biology, focusing on the eukaryotic translation and on the main elements involved in the process and discussing the integration of the translational machinery with a variety of regulatory factors. I then give an overview on the experimental assays employed to study translation. Finally, I illustrate the relationship between translation and motor neuron diseases discussing the case of Spinal Muscular Atrophy.
1.1
From DNA to proteins
The central dogma of molecular biology describes the processes that guarantee the maintenance of the genetic information throughout cell division and cell life and its flow from DNA to RNA and from RNA to proteins1. It consists of three fundamental stages: replication, transcription and translation. Replication is in charge of duplicating the DNA, the primary source of the genetic information stored in the nucleus of eukaryotic cells and the starting point for the processes resulting in the production of functional proteins. DNA is used as template during transcription, which produces different types of RNA by copying portions of the genomic sequences, called genes. Some RNAs (small nuclear RNAs, small nucleolar RNAs, micro RNAs and long non coding RNAs) resulting from this process are engaged in post-transcriptional or translational regulation of gene expression2–4 while other (transfer RNAs, ribosomal RNAs and messenger RNAs) are intimately involved in translation, that is the last step of the central dogma. In the next chapter I outline how translation works in eukaryotic organisms.
1.2
Translation
post-transcriptional modifications,
tail at the 3’ end. The poly(A) tail is bound by that interact with the 5’ cap through protein closed loop plays an important
and increasing its translation efficiency
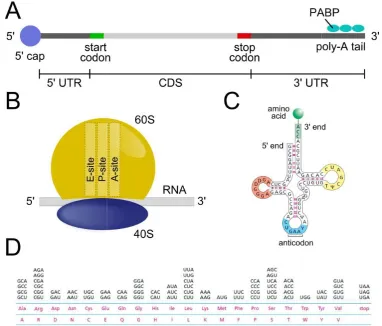
Figure 1.1. Elements of translation
mRNA, (B) a ribosome and (C) a tRNA. (D)
lines at the bottom are the proteins (with two different notations) and above the corresponding triplets.
The molecular machineries that carry out the polymerization of peptides are the ribosomes, composed in eukaryotes by
proteins12. Eukaryotic ribosomes are formed by the small subunit and contain three active sites called E, P and A accommodate, in a different states depending
transfer RNA (tRNA), the molecule that allows the match of the codon with the correct amino acid (Figure 1.1C): for this purpose
12
transcriptional modifications, such as the m7G cap at the 5’ end and
. The poly(A) tail is bound by multiple poly-A binding proteins (PABP) interact with the 5’ cap through protein-protein interactions5–
important role in defining the mRNA fate, stabilizing the mRNA translation efficiency9–11.
ranslation. Schematic representation of (A) a filament of mature mRNA, (B) a ribosome and (C) a tRNA. (D) Degeneracy of the genetic code in human
lines at the bottom are the proteins (with two different notations) and above the
The molecular machineries that carry out the polymerization of peptides are the in eukaryotes by four ribosomal RNA (rRNA) and around eighty
ibosomes are formed by the small (40S) and the large subunit and contain three active sites called E, P and A site (Figure 1.1
accommodate, in a different states depending on the stage of translation, a single transfer RNA (tRNA), the molecule that allows the match of the codon with the correct C): for this purpose, the tRNAs include an anticodon, i.e. a cap at the 5’ end and the poly-A A binding proteins (PABP) –8. The resulting role in defining the mRNA fate, stabilizing the mRNA
. Schematic representation of (A) a filament of mature in human. In the two lines at the bottom are the proteins (with two different notations) and above the
13
acid.
The relationship between triplets and amino acids is contained in the genetic code13 that is highly but not fully conserved among different species14,15. Arranging 4 nucleotides in triplets there are 64 possible combinations, each encoding for one amino acid. However, only 20 different amino acids are used to synthesised protein, meaning that in some case the same amino acid is encoded by multiple codons, namely synonymous codons. In fact, different tRNAs characterized by similar anticodons bring the same amino acid, leading to the so called "codon degeneracy" (Figure 1.1D). Usually, many ribosomes are translating in parallel the same mRNA forming the so-called polyribosome or polysome16–18.
14
15
its 3’ end by three nucleotides at a time, adding at each step the correct amino acids to the nascent peptide chain. More in detail, the elongation factor eEF1A-GTP binds the aa-tRNA complex forming the so-called ternary complex. Upon ATP hydrolysis of eEF3-ATP the ternary complex enters the A-site of the ribosome and the hydrolysis of eEF1A-GTP occurs. This reaction leads to conformational changes of the ribosome and the formation of the peptide bond between the new amino acid and the nascent peptide. In particular, during the ribosome translocation step the tRNA placed in the P-site and the A-P-site move close, leading to rotated state of the ribosomes containing an hybrid state A/P-tRNA23. eEF1A and eEF3 are then released, while the GTPase eEF2, upon GTP hydrolysis, binds the A-site promoting the advancement of the ribosome towards the 3' end of the mRNA. Finally, eEF2 and the tRNA are released and another cycle can start.
Figure 1.3. Translation elongation. eEF1A-GTP-aminoacyl-tRNA ternary complex binds to the ribosomal A site. Following release of eEF1A-GDP, the peptide bond between the amino acid in the A-site and the nascent peptide in the P-site is formed. Binding of eEF2-GTP promotes translocation of the tRNAs into the P and E-sites, and is followed by release of eEF2-GDP. Adapted from Dever and Green24.
pre-16
readthrough of the stop codon .
Finally, if the termination phase properly occurs the ribosomes leaving the stop codon may be recycled, i.e. they have a higher probability to start another cycle of translation on the same mRNA rather than turn up in the group of free subunits24,27.
Figure 1.4. Translation termination and recycling. Upon the recognition of a stop codon, the eRF1-eRF3-GTP ternary complex binds to the A site of the ribosome. Following GTP hydrolysis, eRF3 is released. ABCE1/Rli1 binds and facilitates the accommodation of eRF1. ATP hydrolysis finally releases the subunits. Adapted from Dever and Green24.
While the translation phases and the initiation, elongation and termination factors involved in the process have been described for eukaryotes, the abovementioned steps are general and highly conserved in all organisms, from prokaryotes to eukaryotes. In addition, many translation factors have been demonstrated to control translation in a wide range of species, from bacteria to human. For example, hypusination of eIF5A lead to control of both initiation and elongation phases28–30, ribosome translocation is tuned through the phosphorylation of the elongation factor eEF2a31–33 and the activity of eIF4E and eIF6 may promote the translation of specific mRNAs34. Nevertheless, in the last decades a growing body of evidence showed that organisms control translation using additional and sometimes very sophisticated mechanisms and plenty of molecules to regulate almost each step of protein synthesis, as discussed in the next section.
1.3
Translation regulation
17
neurological diseases, including Alzheimer’s disease, fragile X syndrome and spinal muscular atrophy47–52.
It is not surprising that protein levels are largely controlled at the translational rather than transcriptional level53. In fact, latest evidences show a widespread uncoupling between transcript and protein abundances in cells54,55. This uncoupling can be only partially explained by transcription alone (around 40%)56. These observations point at post-transcriptional and translational controls as fundamental players in shaping proteomes. Latest findings highlight the complexity of translation and the existence of a wide collection of translational regulatory mechanisms acting both in cis (mRNA sequences and secondary structures)57,58 and trans (ncRNA and RNA binding proteins)59,60. Interestingly these controls can govern translation or even the movement and the position of ribosomes along the mRNAs61,62. This information may lead to new insights into how translational machinery can be controlled through a number of regulatory elements within ribosomes and polysomes.
While ribosomes have been widely studied in various organisms63–66 providing intriguing evolutionary insights67, their organization and coordinated functioning in polysomes is not yet studied in detail. The emerging hypothesis that in cells do indeed exist specialized ribosomes68–71 that can be post-translationally modified57 open new scenarios about in situ translational controls of architectural features of polysomes as unexplored players in tuning translation. This hypothesis is supported by analogous conclusions drawn for transcription, where the structure of the chromatin, a complex DNA/protein/RNA ultra-structural domain within the genome, has been demonstrated to be of crucial importance in tuning gene expression72–75. This assumption clearly points to a better understanding of the organizing rules of ribosomes along the transcripts, governing parameters such as the number of ribosomes and their positional organization. Acquiring such information would be an important advance to disclose possible causes of the poor correlation between cellular transcriptome and proteome.
18
initiation factors , the presence of secondary structures of the 5’ UTR and the recognition of the correct translation initiation site78.
The elongation phase is tuned through many regulatory elements acting both in cis57,58,79–82 and trans37,59,60,62,83. Cis regulatory elements mainly consist in the nucleotide composition and GC content80 of the coding sequence that may cause mRNA secondary structures81,82 and different usage of the codons codifying for the same amino acid (codon usage bias, see next section)79. Trans regulatory elements include RNA binding proteins that bind the mRNAs59,60, non-coding RNAs that bind ribosomes62 and specialised ribosomes37,83 that have been demonstrated to determine ribosomal pauses and slowdowns, eventually increasing the complexity of the translational regulatory mechanism.
The canonical termination phase may also be altered leading to either alternative and premature translation termination84,85 and ribosome drop-off86,87, or the stop codon readtrhought88,89.
Finally, investigations of polysomes by cryo-electron tomography and atomic force microscopy90–96 demonstrate the presence of tight ribosome-ribosome interactions and of ribosome cliques (namely clusters) separated by naked portion of mRNAs95, revealing highly-organised three dimensional polysomal structures.
1.3.1
Codon usage bias
Among the many translational controls discussed above those acting in cis are the most studied. The codon usage bias is a prominent example, since it has been object of several investigations due to its strong association with the nucleotide composition of the mRNAs and consequently its potential role in controlling protein production. Nevertheless, even though its impact on ribosome pauses97,98 and drop offs99,100 have been largely discussed, its contribution in controlling and translation remains unclear.
19
codon (decoded with high speed) and non-optimal codons (slowly translated) .
Many hypotheses have been proposed concerning the role played by the codon usage and codon optimality in modulating translation. It has been demonstrated that specific triplets stabilize the mRNAs facilitating ribosome translocation107. In addition, different usage of codons also implies a different usage of synonymous and non-synonymous aa-tRNAs. The well-known variability of tRNAs concentration in cells correlating with the frequency of the corresponding codon109–112 creates a direct link between the nucleotide composition of the mRNAs and the speed of the ribosomes in the elongation phase. In fact, it has been demonstrated that rare tRNAs induce slowdown of ribosomes on non-optimal codon, while frequent tRNAs reduce the time ribosomes spend on optimal codons113. The presence of rare codons along mRNAs has been shown to increase the efficiency of protein folding105,114 and a reduced ribosomal traffic jam along the filaments115, leading to a better control of translation.
Experimental and computational approaches have been employed to investigate the role of codon usage bias in translation. For example, the correlation between the codon usage bias of specifically engineered sequences and the protein abundance obtained after their translation has been computed116, demonstrating that particular sequence of codons may leads to secondary structures along the coding sequence controlling the movement of ribosomes116. Moreover, many bioinformatics analyses examined the relationship between the frequency of synonymous codons along the mRNAs and the correct folding of the nascent peptides during translation117, as well as the connection between the codon usage bias and the experimentally observed enrichments of ribosomes at the beginning of the coding sequences113. Nevertheless, the results of these studies suffer from different criteria and computational methods used to define the “optimality” of codons, which is not universally established118,119. Therefore the precise role of codon usage in tuning translation, particularly in controlling the number and the localization of ribosomes along the mRNAs is still under debate.
1.3.2
Ramp
One of the most controversial issues related to the codon usage bias is the potential connection with a slow-down mechanism at the very beginning of the coding sequence, known as ramp hypothesis.
20
ribosome profiling data in many organisms (bacteria , yeast , mouse81,121 and human82,113) as a sequence ranging from 5 to 50 nucleotides in length, depending on the species82,127. This phenomenon has been extensively studied and a wide range of possibilities about its origin and its effects on translation have emerged over the years. The ramp may be caused by specific nucleotide sequences at the beginning of the coding region and by accumulation of non-optimal codons113,122,127 as discussed in the previous section. The ribosome slowdown has been also associated to 2D structures of mRNAs116,127, rapid initiation rates129 or to a concurrence of multiple causes81,115,128. This mechanism of ribosome stalling at the beginning of the coding sequence is supposed to reduce the ribosomal traffic jam127,128, minimizing errors in protein synthesis and enhancing protein production115 improving translation. However, as for the codon usage bias, the real contribution of the ramp to the number and the localization of ribosomes along mRNAs remain unclear.
1.4
Experimental techniques for study
translation at the genome-wide level
Classical gene expression studies have been based for several years on the assumption that transcriptional levels and corresponding protein level are linearly correlated. In the last years much effort has been directed to investigate the relationship between total mRNA and protein abundances in cells and tissues53,56,130–132, finding that the abovementioned assumption is an oversimplified view and that translation is a major player in shaping the cellular proteome. To further investigate this hypothesis high-throughput techniques such as microarray and Next Generation Sequencing (NGS) have been recently employed for developing genome-wide methods to investigate translation with increasing resolution (Figure 1.5)133,134.polysome) and extract ribosome positional information
Figure 1.5. Genome-wide methods to
extracts are separated by ultracentrifugation through a linear sucrose density gradient. The gradient is then fractionated allowing the separation of ‘free’ RNA, the small (40S) and large (60S) ribosomal subunits, monosomes (80S) and polysomes. RNA is
gradient fractions and pooled fo
profiling (centre): extract is treated to digest unprotected and non the mRNAs. The ribosomes are further enriched th
protected fragments (RPFs) of RNA are size
approximately 30 nucleotides are recovered and ligated to sequencing adaptors for reverse transcription, amplification and high
tagged ribosomes are captured from extracts with specific antibodies or ligands coupled to a matrix. After several stringent washes, the ribosomes and associated RNAs are released from the matrix and captured RNAs are analysed with DNA microarrays or by RNA
to combine either polysomal profiling (left), or affinity purification (right), with ribosomal profiling (centre), using either of the aforementioned methods as a vehicle for enriching sample with ribosomes before isolating ribosome protected fragments.
Gerber134.
21
and extract ribosome positional information .
wide methods to investigate translation. Polysomal profiling extracts are separated by ultracentrifugation through a linear sucrose density gradient. The gradient is then fractionated allowing the separation of ‘free’ RNA, the small (40S) and large (60S) ribosomal subunits, monosomes (80S) and polysomes. RNA is isolated from individual gradient fractions and pooled for subsequent microarray or RNA-Seq analysis. Ribosomal : extract is treated to digest unprotected and non-ribosome bound regions in the mRNAs. The ribosomes are further enriched through a sucrose cushion, and ribosome protected fragments (RPFs) of RNA are size-fractionated by gel electrophoresis. RPFs of approximately 30 nucleotides are recovered and ligated to sequencing adaptors for reverse transcription, amplification and high-throughput RNA-seq. RAP procedure
tagged ribosomes are captured from extracts with specific antibodies or ligands coupled to a matrix. After several stringent washes, the ribosomes and associated RNAs are released from
ed RNAs are analysed with DNA microarrays or by RNA
to combine either polysomal profiling (left), or affinity purification (right), with ribosomal profiling (centre), using either of the aforementioned methods as a vehicle for enriching sample with ribosomes before isolating ribosome protected fragments. Adapted from King and
22
information of ribosome and polysomes at nearly sub-nanometric resolution. In particular, I discuss the use of images of polysomes acquired with an Atomic Force Microscope to compute the number of ribosomes per polysome.
1.4.1
Polysome profiling
Polysome profiling is a classical technique that allows to separate proteins and RNAs (both coding and non-coding) associated to different numbers of ribosomes per polysome, i.e. per transcript. After the removal of mitochondria and nuclei, the cellular lysates are ultracentrifuged on a linear sucrose gradient. Separation of free RNAs (i.e. not-associated to ribosomes), the small (40S) and the large (60S) ribosomal subunits, monosomes (80S) and polysomes can be easily obtained using a fraction collector and employed for indirectly deducing the number of ribosomes per polysome137. Typically, polysome profiling is coupled to high-throughput techniques such as RNA-Seq or microarray for the quantification of the transcripts and the determination of the RNA levels at a genome-wide level38,143. In fact, this technique has been used to analyse the variation of mRNAs uploading on polysomes144, to identify mRNAs controlled at the post-transcriptional levels by RBPs or nc-RNAs145–148, and study the uncoupling between transcription and translation54.
In addition, by measuring the RNA abundance in each sucrose fraction and knowing the sedimentation coefficient of ribosomes, it is also possible to indirectly derive the distribution of the number of ribosomes per transcript137.
The estimation of the number of ribosome per transcript provided by this approach is unfortunately indirect and imprecise. For example, polysome fractions collected for microarray analysis may not be clearly resolved and transcripts in specific fractions containing multiple polysomal peaks cannot always be directly assigned to an unambiguous number of ribosomes per polysome. Furthermore, polysomes in higher eukaryotes are known to be associated to a large number of proteins such as enzymes, RNA binding proteins and ncRNAs149 that can affect the separation and quantification of large polysomes.
1.4.2
Ribosome profiling
23
(Figure 1.6), that have been demonstrated to be not-translating , even if this is a matter of debate since decades156–158.
Figure 1.6. Different classes of ribosomes. Representative absorbance profile displaying the position of three classes of ribosomes: non-translating ribosomes, non-translating ribosomes associated to polysomes and actively translating ribosomes.
To avoid the isolation of RPF associated to monosomes, ribosome profiling can be applied to already purified polysomes159. The pre-purification of polysomes removes any possible contamination associated not only to the monosome but also to mRNA fragments associated to the preinitiation complex (48S). Nevertheless, it does not discriminate between ribosomes that are actively translating and ribosomes that might be stalled on transcripts. In fact, it is known that especially in neuronal tissues, physiological paused polysomes do exists160,161. Therefore to overcome possible misleading information about the translational state of transcripts from ribosomes profiling analysis, a third version of ribosome profiling developed by Immagina BioTechnology exploits a new technology called RiboLaceTM to isolate fragments of mRNAs exclusively protected by active ribosomes.
Briefly, Active-RiboSeq uses RiboLace™, a new method based on a modified puromycin coupled to magnetic beads. By binding close to the A-site of the ribosome in the not-rotated state, when the acceptor site accommodates the aminoacyl-tRNA engaged by eEF1α, the puromycin analog can be successfully used to capture active ribosomes.
24
protocol please refer to Clamer et al. .
Ribosome profiling coupled with RNA-Seq analysis has been mainly used for computing transcript-specific translation efficiencies (TE)126 and performing TE-based differentially analyses163. This information is basically identical to what can be obtained by classical polysomal profiling coupled to NGS or microarray137,164. Importantly, the possibility to obtain the precise localization of ribosomes along the mRNAs is unique to Ribo-Seq and is still largely unexploited in the vast majority of published ribosome profiling analysis. Only the last few years have witnessed a rapid adoption of this technique for extracting positional information describing fluxes of ribosomes along the RNA at sub-codon resolution140–142. This type of analysis is typically based on the so-called ribosome occupancy profiles, i.e. transcript-specific curves showing for each nucleotide along the mRNA sequence the height of the reads signal expressed as the probability to find a ribosome. Analysing ribosome occupancy profiles it is possible for example to reveal novel translated regions165–167 and ribosome read-through on 3’ UTRs141,168. Furthermore, RiboSeq allows to derive translation initiation and elongation rates169 and estimate codon usage bias identifying translation pauses170 or ribosomes in specific conformations during the elongation step of translation171.
Analysis of ribosome profiling data
Following the rapid diffusion of ribosome profiling assays, many computational tools and pipelines dedicated to the analysis of RiboSeq data have been developed in the last years. As already mentioned in the previous paragraph, most computational tools are aimed at just computing transcript-specific translation efficiencies for differential analyses in multiple organisms, treatments or conditions (see Babel163, Xtail172, RiboDiff173, RUST174). Typically, these methods do not take into consideration any positional information provided by RiboSeq, since they are based only on the expression levels, i.e. the abundance of mapped RPFs (reads) and on the level of mRNAs obtained by transcriptome analysis that is typically run in parallel to each ribosome profiling.
25
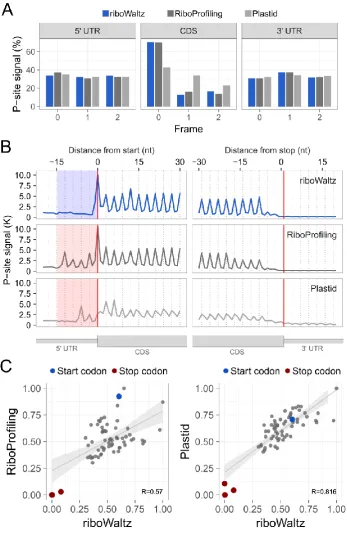
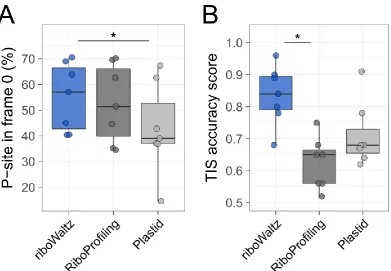
along the RNA at sub-codon resolution and conformational changes in ribosomes during the elongation step of translation171. Moreover, the identification of ribosome P-site is used for verifying the trinucleotide periodicity of translating ribosomes along coding regions123,180, obtain reliable translation initiation169 and elongation rates169,181– 183 and accurately estimate codon usage bias184. Nevertheless, only very recently and after almost 8 years from the introduction of ribosome profiling two pipelines, specifically dedicated to the identification of the P-site, have been released (Plastid185 and RiboProfiling186).
Despite the vast availability of tools for handling ribosome profiling data, carry out a comprehensive analysis of ribosome profiling data is still a complex and time-consuming task. In fact, most of the above-mentioned pipelines perform only one of the many possible RiboSeq data analyses (differential expression analysis, detection of novel ORF, identification of P-site etc.). To overcome this problem, user-friendly genome browsers and on-line environments designed for the storage, the visualization and widespread analyses of ribosome profiling data arose187–189.
Overall, these applications point to ribosome profiling as a mayor assay for the study of translation from many points of view: the investigation of the role played by controls of translation (e.g. the nucleotide composition of the CDS); the comparison of translational abundances of specific transcript in different conditions; the characterization of polysomes in terms of ribosome number and localization. Nevertheless, both alignment and preprocessing of RiboSeq data may be the cradle of many biases190,191 determined, for example, by PCR duplicates192 ambiguous reads mapped to mRNA isoforms, missing normalizations193–195. These biases may lead to particularly noisy occupancy profiles, making the identification of regions associated to ribosome pauses and slowdowns a difficult task. Few works propose original procedures to get rid of RiboSeq bias and improve data analysis61,170,196 but a conclusive approach for the extraction of meaningful positional information is still missing.
1.4.3
Atomic force microscopy
26
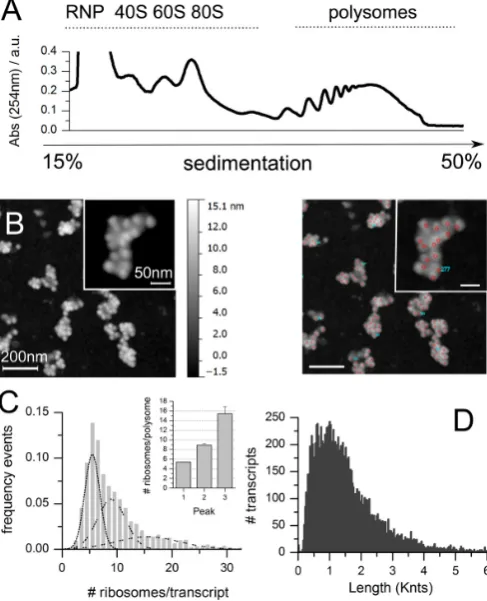
on ribosomes in polysomes . Electron microscopes allow to obtain high-resolution information about ribosome–ribosome interactions and the 3D organization of polysomes90–94. Nevertheless, these methods cannot be employed to identify naked filaments of mRNAs, precluding the possibility to precisely count the number of ribosomes per transcript. Moreover, compared to cryo-EM, AFM doesn’t need any ex-post image reconstruction procedures thus allowing the acquisition of thousands images of single polysome and no post-processing or reconstruction analysis. From these images the number of ribosomes per polysome can easily obtained with high accuracy95,96.
With respect to estimating the number of ribosomes per polysome using the above-mentioned and indirect fraction by fraction polysome profiling, AFM has some advantages: it can acquire images at single ribosome-resolution, returning a highly resolved distribution of directly counted ribosomes per transcript; it avoids possible biases due to sedimentation characteristics of polysomes (e.g. composition, shape, diffusion coefficients) or dissimilarities in sedimentation in different organism. Therefore, AFM can be of great help for precisely counting the number of ribosomes in thousands of transcripts purified from cells or tissues96. The main drawback of the use of AFM images is that it cannot distinguish a transcripts from another, meaning that is possible to obtain the distribution of the number of ribosomes per polysome for a whole transcriptome but it is not possible to obtain transcript-specific information unless using in vitro translation systems of single transcripts at a time.
1.5
Mathematical models
27
molecular biology have been experienced.
Generally speaking, a model is an object that represents and simulates a natural process. A mathematical model is a mathematical theory that well explains natural mechanisms or processes through mathematical entities such as functions, equations, variables, probabilities etc. In this chapter I present the most widespread mathematical models and discuss their applications in the study of translation.
1.5.1
Deterministic models
A deterministic model describes the dynamics of a system through states connected by events, which correspond to the either reversible or irreversible transitions between the states. Each state is associated to specific quantities of all elements involved in the system, represented by variables, and each transition corresponds to an ordinary differential equation (ODE), i.e. a relation between a function 𝑓 and its derivatives of
the form:
𝑑 𝑓(𝑥)
𝑑𝑥 = 𝑔(𝑓(𝑥))
It is called ordinary differential equation if it contains only one independent variable. Practically, the function 𝑓 describes a physical quantity and its derivatives represent
the rate of its change either in time or space.
Solving these models consists in finding their steady state, starting from a given initial state. This means that the steady state reaches a point such that the variables defining the process do not change neither in time nor in space. In this condition the function(s) describing the system must satisfy the following equality:
𝑑 𝑓(𝑥) 𝑑𝑥 = 0
28
this event must be either simplified of excluded from the model, making the predictions inaccurate.
Deterministic models of translation
As previously discussed, multiple controls involved in translation may help understanding the reason behind the well-known general uncoupling between transcript and protein abundances in cells54,55 In fact, studying variables in many deterministic models of translation developed since the 1960s205 can increase the prediction of global and transcript-specific protein production rates (hence protein abundances), thus increasing the low correlation observed between transcriptome and proteome in cells.
29
approaches has been put in last years, the existing models point to contradictory conclusions concerning the role of mRNA determinants such as the codon usage and the ramp hypothesis i.e. the slowdown mechanism at the beginning of the coding sequence. Moreover, the connection between these mRNA determinants and polysome features such as the number of ribosome per polysome and the ribosome localization along the mRNA has never been explored in detail. Analogously, even though deterministic models of translation have been extensively exploited for predicting protein production rates and protein abundances, the precise contribution of polysome to the final protein production has never been investigated.
1.5.2
Stochastic models
A stochastic model, as the name suggests, assumes that the evolution of a system relies on single or multiple uncertain events. This means that, simulating a phenomenon described as a set of events connecting different states, the choice of the next reaction to occur is based on a probability distribution. In many cases, the kinetics of the systems moving from one state to another also depends on random variables. Thus, the stochastic nature of this approach gives rise to a variety of paths and, even if a specific state of the system is known, it is impossible to forecast the following ones, and the final state cannot be uniquely determined.
Basically, a stochastic model follows three main steps: i) definition of the initial state; ii) determination of the next reaction and the time it will take; iii) update the system after each reaction occurs. The second and the third steps are reiterated until the system reaches the chosen steady state (if any).
Despite the increased computational complexity of stochastic models compared to the deterministic approaches, the former allow to know exactly which is the state of the system at any time point of the simulation. This means that it is possible to follow the evolution and the variations of all elements involved in the process. Moreover, parameters describing multiple aspects of the modelled system can be easily added and their contribution assessed on the basis of the trend of the simulations.
Stochastic models of translation
30
ribosome dynamics .
Similarly to deterministic approaches, stochastic models translation usually describe the initiation, elongation and termination phase by simulating the binding, the movement and the release of ribosomes along a sequence of mRNA206,207. However, these models are based on the totally asymmetric simple exclusion process (TASEP)221, based on the Gillespie algorithm222 and canonical frequentist probabilities223. The TASEP model assumes that a ribosome can move forward one codon at a time in only one direction and only if the next triplet is not occupied by another ribosome. The fundamental steps of these models are the following:
I. definition of the initial state, typically an empty filament of mRNA and an infinite pool of ribosomes;
II. generation of a random value to determine the next reaction to occur and the time it will take. There are only three possible types of reactions that can take place:
a. the binding of a new ribosome at the start codon;
b. the movement of bound ribosomes from one triplet to the next one;
c. the detachment of a ribosome from the stop codon; III. update the system depending on step II;
IV. reiterate from step II.
Despite many stochastic simulations of translation based on ribosome kinetics took advantage of the above-mentioned procedure215,218,224,225, more refined models have been developed to investigate the contribution of additional parameters such as the presence of mRNA 2D structures226, and ribosomes and tRNAs competition181,216,217,227 in tuning translation.
31
complex dynamics of translation regulation by aa-tRNA, based not only on their levels but also on possible aa-tRNA post transcriptional modifications. On the contrary, Gorgoni and collaborators224 demonstrated that the abundance of aa-tRNA in cells is sufficient to prompt ribosome queues along the transcript.
Recently, the widespread diffusion of ribosome profiling assays gives rise to a collection of stochastic models that take advantage of RiboSeq data, which allows to estimate the position of ribosomes along transcripts expressed as number of reads obtain121,129,181,219,228. These models, by tuning their parameters to obtain the best fit of the experimental data, allow the estimation of translation rates: Ciandrini and collaborators219 inferred a set of translation initiation rates for yeast, also revealing that the codon usage bias alone is not sufficient to control ribosome localization along the transcripts; Zupanic and co-workers121 computed transcript-specific termination rates in mouse, suggesting that translation premature termination is due to either mRNA post transcriptional modifications or stretches of non-optimal codons. Other RiboSeq-based stochastic models led to discordant conclusions about the role of codon usage along in determining ribosome localization and slowdowns along the transcripts. For example, Raveh and collaborators220, exploiting a model simultaneously simulating translation of multiple mRNAs, described both global and local effects of codon usage bias on ribosome translocation. On the contrary, Shah and co-workers129 revealed a connection between high ribosome densities along the coding sequence (especially close to the start codon) and a rapid initiation rate, discarding the hypothesis of slow, non-optimal codons at the beginning of the CDS.
32
Beyond the deterministic and stochastic procedures described in the previous sections, models based on Bayesian probability229 and other statistical approaches230,231 have been developed for studying translation. For example, Gilchrist and collaborators showed a strong connection between codon usage bias and translation elongation rate in yeast229, ad a significant impact of ribosome recycling and potential non sense-errors have been assessed230.
Furthermore, studies that mix deterministic and stochastic approaches have been employed for predicting protein production rates232 and demonstrate the role of aminoacyl-tRNAs abundance and diffusion in cells in limiting translation elongation rates233. Finally, recent techniques based on Boolean logic234,235 attempted to find the best combination of models for representing translation by exploiting the advantages of multiple mathematical and computational approaches.
1.6
Translation in motor neuron diseases:
the case of Spinal Muscular Atrophy
Spinal Muscular Atrophy is the leading cause of infant mortality associated to genetic diseases236. SMA was described for the first time at the end of the 19th century237 and is classified as a motor neuron disease, i.e. a progressive neurological disorders characterized by degeneration of motor neurons, the cells that control voluntary muscle activity. In particular, SMA affects lower alpha motor neurons, whose axons arise either from the brainstem or the anterior horn of the spinal cord, directly innervating skeletal muscles238. Lower alpha motor neurons are responsible for the innervation of the extrafusal muscle fibres at the neuromuscular junction. Consequently, their degeneration results in hypotonia and muscle weakness239.
33
In the human genome, smn is present in two different copies: Smn1 and Smn2, derived from an inverted duplication of Smn1240. A single nucleotide mutation differentiates the two copies of smn, leading to the skipping of the exon 7 during splicing, which in turn gives rise to a truncated protein that is rapidly degraded. A small percentage of smn1 is properly translated into functional SMN proteins allowing a correct development of the organism at the embryonic stage.
35
2
Mathematical models of
translation
2.1
riboAbacus
Translation is the most energy consuming process in cells35,36 and a primary mechanism for regulating protein expression in a variety of fundamental physiological processes37–40. Translation occurs in polysomes16–18, highly-structured complexes where several controls converges: recent findings reveal the existence of a wide collection of translational regulatory mechanisms acting in cis (mRNA sequences and secondary structures)57,58 and trans (ncRNA and RNA binding proteins) of mRNAs. As a consequence, these controls may account for the discussed widespread uncoupling between transcript and protein abundances in cells54,55, that can be only partially explained by transcription alone (around 40%)56. In fact, multiple regulatory elements can in some cases govern the movement, position and, as consequence, the number of ribosomes within polysomes61,164 and thus the whole translation process. In particular, the number of ribosomes bound to the transcripts coupled with mRNA levels is likely to affect the abundance of proteins in cells.
Unfortunately, up to now no experimental techniques allow to calculate the number of ribosomes per transcript with single-transcript resolution at genome-wide level. Thus, the only way to clarify the contribute of the number of ribosomes per polysome in shaping proteomes is a dedicated mathematical model of translation that i) takes into consideration the mRNA levels and ii) estimates the number of ribosomes per polysome.
36
to ribosome slowdown ) in tuning translation is still unclear.
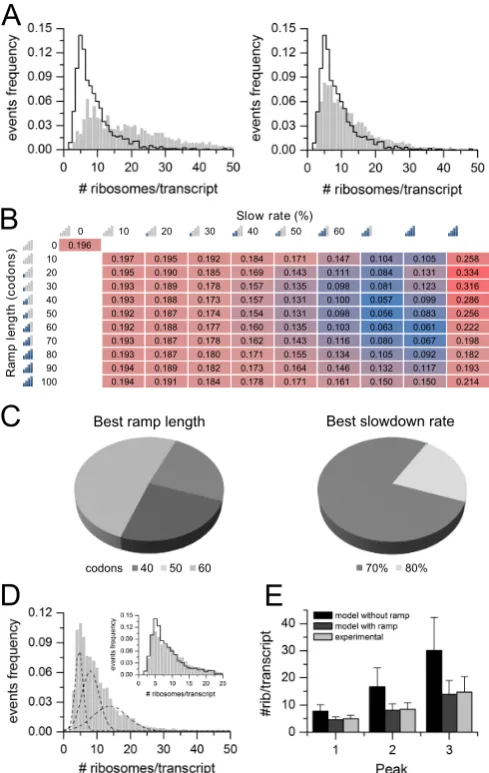
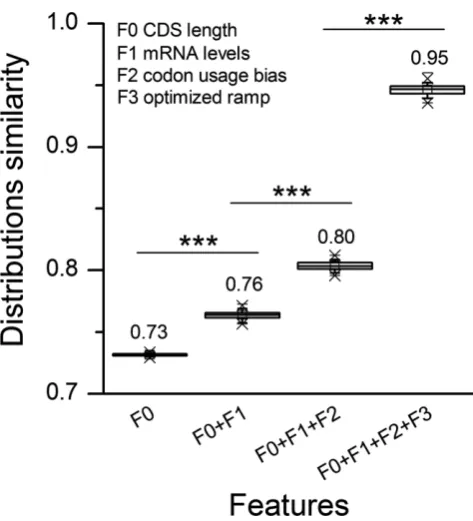
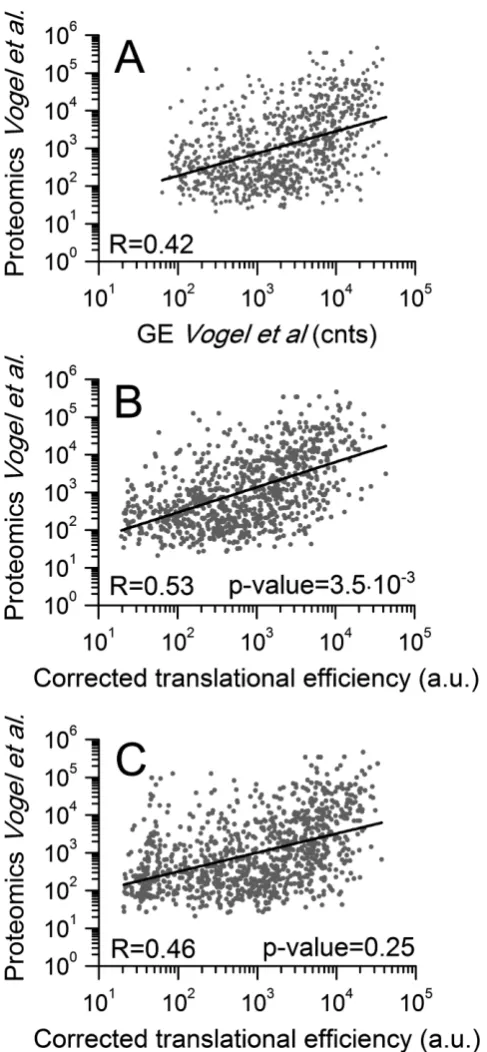
Here, I propose riboAbacus, a mathematical model to predict the number of ribosomes per transcript exploiting for the first time imaging data of polysomes acquired by atomic force microscopy (AFM) and obtained by Dr. Gabriella Viero (Laboratory of Translational Architectomics, IBF-CNR, Trento) in collaboration with Dr. Lorenzo Lunelli (Bruno Kessler Foundation, Trento). In fact, recent studies showed that AFM can be of the greatest help for precisely and counting the number of ribosomes at the genome-wide scale in polysomes purified from cells or tissues91,93,95. I used as input the kinetic constants of elongation and as mRNA determinants the gene expression level, the codon usage bias and the ramp. The model was trained using the experimental distribution of the number of ribosomes per transcript from images of polysomes of the human Hek-293 (GSM936076) cell line, to optimize two ramp parameters: the ramp length and ribosome slowdown rate. These two parameters has been set to best fit the experimental data. I then performed two rounds of validations using: i) the whole transcriptome of human MCF-7 (GSE48213) cell line and ii) the globin mRNA (globin transcript). In both cases I found a good fit between experimental and predicted data. Finally, the predicted number of ribosomes per transcript was used to calculate protein levels of mRNAs expressed in three datasets (the human medulloblastoma, primary mouse motoneurons and NIH3T3 mouse fibroblasts), significantly increasing the correlation between transcript and protein abundances. This result demonstrates the usefulness of the prediction of the number of ribosomes per transcript to reduce the distance between transcriptome and proteome in any biological sample.
doi: 10.1093/nar/gkv781
RiboAbacus: a model trained on polyribosome images
predicts ribosome density and translational efficiency
from mammalian transcriptomes
Fabio Lauria1, Toma Tebaldi2, Lorenzo Lunelli3, Paolo Struffi2, Pamela Gatto2,
Andrea Pugliese4, Maurizio Brigotti5, Lorenzo Montanaro5, Yari Ciribilli6, Alberto Inga6, Alessandro Quattrone2, Guido Sanguinetti7and Gabriella Viero1,*
1Institute of Biophysics, CNR Unit at Trento, Via alla Cascata, 56/C-38123 Povo (TN), Italy,2Laboratory of
Translational Genomics, Centre for Integrative Biology, Via delle Regole, 101-38123 Mattarello (TN), Italy,
3Laboratory of Biomolecular Sequence and Structure Analysis for Health, Fondazione Bruno Kessler, Via
Sommarive, 18-38123 Povo (TN), Italy,4Mathematics Department, University of Trento, Via Sommarive, 14-38123
Povo (TN), Italy,5Department of Experimental, Diagnostic and Specialty Medicine, University of Bologna, Via S. Giacomo, 14-40126 Bologna, Italy,6Laboratory of Transcriptional Networks, Centre for Integrative Biology, Via delle Regole, 101-38123 Mattarello (TN), Italy and7School of Informatics, University of Edinburgh, 10 Crichton Street, Edinburgh, Midlothian EH8 9AB, UK
Received May 29, 2015; Accepted July 20, 2015
ABSTRACT
Fluctuations in mRNA levels only partially contribute to determine variations in mRNA availability for trans-lation, producing the well-known poor correlation be-tween transcriptome and proteome data. Recent ad-vances in microscopy now enable researchers to ob-tain high resolution images of ribosomes on tran-scripts, providing precious snapshots of translation
in vivo. Here we propose RiboAbacus, a mathemat-ical model that for the first time incorporates imag-ing data in a predictive model of transcript-specific ribosome densities and translational efficiencies. Ri-boAbacus uses a mechanistic model of ribosome dynamics, enabling the quantification of the rela-tive importance of different features (such as codon usage and the 5 ramp effect) in determining the accuracy of predictions. The model has been op-timized in the human Hek-293 cell line to fit thou-sands of images of human polysomes obtained by atomic force microscopy, from which we could get a reference distribution of the number of ribosomes per mRNA with unmatched resolution. After valida-tion, we applied RiboAbacus to three case studies of known transcriptome-proteome datasets for estimat-ing the translational efficiencies, resultestimat-ing in an in-creased correlation with corresponding proteomes. RiboAbacus is an intuitive tool that allows an
im-mediate estimation of crucial translation properties for entire transcriptomes, based on easily obtainable transcript expression levels.
INTRODUCTION
Translation, the synthesis of proteins by ribosomes using an mRNA template, is a fundamental process in biology. It relies upon complex interactions between molecular ac-tors that modulate this process at a number of translation check-points: initiation (1–3), elongation (4–6), termina-tion and ribosome recycling (7,8). Moreover, mRNA de-terminants such as codon usage bias (9), GC content (10), 5 mRNA structures (11,12), cis regulatory elements (13), protein–protein interaction (14,15), ribosome pausing (16– 18), alternative termination (19) and drop off (20,21) influ-ence translational efficiencies or translation ratesin vivo. In cells, several ribosomes translate the same mRNA forming the so-called polyribosome or polysome (22–24). At steady state, the total number of ribosomes per transcript are the result of an equilibrium among initiation, elongation and termination events. The precise contribution of the num-ber of ribosomes per transcript to the final protein produc-tion remains elusive and unexplored because of the chal-lenge posed by obtaining experimental genome-wide distri-butions of ribosome number per transcript.
Translation has been the subject of intense modelling efforts in the last five decades, using various mathemati-cal and computational approaches (18,25–32). These mod-els aimed at predicting protein production rates and un-derstanding the role of mRNA features or contributions
*To whom correspondence should be addressed. Tel: +39 0461 314033; Fax: +39 0461 314875; Email: [email protected]
C
The Author(s) 2015. Published by Oxford University Press on behalf of Nucleic Acids Research.
This is an Open Access article distributed under the terms of the Creative Commons Attribution License (http://creativecommons.org/licenses/by-nc/4.0/), which permits non-commercial re-use, distribution, and reproduction in any medium, provided the original work is properly cited. For commercial re-use, please contact [email protected]
by guest on August 4, 2015
http://nar.oxfordjournals.org/
of translation stages. Several models purely deal with bio-physical theoretical descriptions of ribosome fluxes along mRNAs (29,31,33), while recent experimental methods to study translation using ribosome footprinting (17,34) or polysome profiling (32) motivated new mathematical mod-elling approaches based on genome-wide maps of ribo-some occupancy and/or ribosome density along transcripts (18,31,35). Despite the many insights afforded by these modelling studies, a consensus model remains elusive, as different modelling approaches/assumptions often lead to contradictory conclusions concerning the role of mRNA determinants (in particular the contribution of codon us-age), the interplay between initiation and elongation, trans-lational rates and efficiencies. Employing ribosome profil-ing data to develop mathematical models is undoubtedly promising, but several problems have been encountered. For example, biases determined by alignment of ambiguous RNA reads to mRNA isoforms, artefacts caused by miss-ing normalization (36), fragment bias that depends on the length of the sequenced fragments (37–39) can introduce er-rors that may affect the robustness of translation efficiencies (TEs) calculated using these data. Ribosome profiling has been extensively used for obtaining estimates of ribosome occupancy per transcript. These estimates are essential for parameterizing mechanistic models of translation, however their reliability is questionable, as they are computed by col-lapsing ribosome positional information from thousands of copies of the very same transcript. Another technique for obtaining ribosome occupancy, ribosome density and the number of ribosomes per transcript could be the em-ployment of polysomal profiling followed by microarray or RNA-seq (40–43). Unfortunately, this approach provides an indirect estimation of the number of ribosomes per tran-script. A more precise way for obtaining this information is the employment of imaging techniques, followed by ri-bosome counting (44). In principle this approach allows to determine the exact number of ribosomes with a single tran-script resolution, if a polysome can be univocally identified. Recently, much effort has been directed at elucidating by imaging the three-dimensional (3D) structure of polysomes in bacteria (45) and eukaryotes using Cryo-ET and atomic force microscopy (AFM) (44,46–48). The emerging model describes polysomes as groups of tightly interacting ri-bosomes. In addition, independent groups of ribosomes, or ribo-cliques, spaced by naked mRNA can be observed along the same transcript, as demonstrated by AFM (44). Despite the unique advantages of Cryo-ET for obtaining high-resolution information about ribosome–ribosome in-teractions (48), it cannot be employed to identify coding mRNA filaments uncovered by ribosomes, precluding the possibility to precisely count the number of ribosomes per transcript. Therefore, AFM is of major help for precisely and univocally counting the number of ribosomes in thou-sands of transcripts purified from cells or tissues.
Ribosome profiling studies introduced the concept of ‘5 ramp’, identified as a region of about 50 codons (34). This region immediately follows the start codon, where ribo-somes display on average an increased density, probably moving with a reduced elongation speed (36) with respect to the remaining coding sequence (CDS). Although defini-tive molecular evidences and mechanistic explanation are
still missing, a body of clues indicates the existence of the ramp effect (49), that has been identified in bacteria (35,50), yeast (18,34,35) and mammals (31,36,51,52). While existing mathematical models of translation have often included a heuristical ramp effect, to our knowledge the ramp param-eters have never been systematically explored or optimized. Here, for the first time, we exploit the rich data pro-vided by AFM images to calibrate a mechanistic model of translation. We develop RiboAbacus, a new mathematical model of translation calibrated using thousands of single-polysome AFM images. The output of RiboAbacus is the prediction of transcript-specific ribosome numbers and ri-bosome occupancy from transcriptome data. The model takes into account the main steps of the elongation phase to predict in a transcript specific fashion the number of ri-bosomes per transcript and derive the corresponding trans-lational efficiency (TE). The proposed method has also been compared with polysome profiling in yeast, showing an in-creased resolution in determining the number of ribosomes per transcript, and a general agreement for single transcript predictions. We took advantage of the experimental distri-bution of the number of ribosome per transcript in one human cell line (HeK-293) to tune RiboAbacus parame-ters (ramp length and slowdown) during the training of the model. A second genome-wide dataset (human MCF-7) and one enriched in a single transcript (rabbit globin from
in vitrotranslation system) were used for validation. Finally, the predicted number of ribosomes per transcript was em-ployed to calculate the TE of mRNAs expressed in three additional biological systems: the human medulloblastoma cell line DAOY (53), primary mouse motoneurons from stem cells (54) and NIH3T3 mouse fibroblasts (55), sig-nificantly increasing the experimental correlation between transcript and protein abundances. This application illus-trates the effectiveness of model-based predictions in esti-mating proteome abundances from transcriptome data. In synthesis, RiboAbacus is an intuitive tool that allows an al-most immediate estimation of crucial translation properties for entire transcriptomes, based on easily obtainable tran-script expression levels.
MATERIALS AND METHODS
Chemicals
All solution used for polysome purifications has been pre-pared in RNase-free water containing 100g/ml cyclohex-imide in order to prevent ribosome subunit disassembly. All reagents, unless otherwise cited, were of molecular biologi-cal grade and purchased from Sigma.
Cell culture and human polysomal purification
The baker’s yeastSaccharomyces cerevisiaewild-type strain BY4741 (MATa, his3D1, leu2D0, met15D0, ura3D0) was obtained from the EUROSCARF repository (EUROpean Saccharomyces Cerevisiae ARchive for Functional analy-sis, Institute for Molecular Biosciences, Johann Wolfgang Goethe-University Frankfurt, Germany, www.euroscarf. de). A single yeast colony was grown overnight to station-ary phase in 5 ml of YPDA growth medium (1% Yeast Ex-tract, 2% Peptone, 2% Dextrose and 200 mg/l Adenine) at
by guest on August 4, 2015
http://nar.oxfordjournals.org/
30◦C. The day after the culture was diluted 1/10 in 20 ml of fresh YPDA and allowed to reach the mid-log growth phase. Translation was blocked by adding 0.01 mg/ml cy-cloheximide. Yeast cells were then collected by centrifuga-tion and lysed with little modificacentrifuga-tions to Arava’s proto-col (40). Briefly, yeast cells were transferred to 2 ml round bottom tubes with 1 ml of freshly prepared lysis buffer (20 mM Tris–HCl, pH 8.0, 140 mM KCl, 1.5 mM MgCl2, 0.5
mM dithiothreitol (DTT), 0.01 mg/ml of cycloheximide, 1% Sodium DeoxyCholate, 1% Triton X-100, 20U RNAse inhibitor) and washed twice. Cells were then lysed using 0.7 ml of lysis buffer with 0.6 vol of pre-chilled acid-washed glass beads (0.45–0.55 mm, Sigma-Aldrich). Complete ly-sis was performed through six cycles of vortexing (30 s) fol-lowed by incubation in ice (1 min). Lysates were harvested by collecting supernatants from two subsequent rounds of cold centrifugation with increasing speed (2600 and 7200g, respectively). Lysates were then diluted to 0.8 ml with ly-sis buffer and stored at−80◦C. Polysomes were purified as described below for human cellular lysates.
Hek-293 and MCF-7 cells were seeded at a density of 2.5 × 10⁴ cells/cm2 and maintained for 3 days in
growth medium (Dulbecco’s modified Eagle’s medium sup-plemented with 10% fetal bovine serum (FBS), 2 mM glu-tamine, 100 units/ml penicillin and 100 mg/ml strepto-mycin at 37◦C, 5% CO2). At 80% confluence, cells were
incubated for 3 min with cycloheximide (100 g/ml) at 37◦C to interfere with the translocation step during protein synthesis, blocking translational elongation and trapping ribosomes on the mRNA. Cells were washed with phos-phate buffered saline (PBS + cycloheximide 100g/ml) and scraped directly on the plate with 300l lysis buffer (10 mM NaCl, 10 mM MgCl2, 10 mM Tris–HCl, pH 7.5, 1% Triton
X-100, 1% sodium deoxycholate, 0.2 U/l RNase inhibitor (Fermentas), cycloheximide 10g/ml and 1 mM DTT). Af-ter a nuclei and cellular debris removal by centrifugation (5 min at 12 000gat 4◦C), the supernatant was directly trans-ferred onto a 15–50% linear sucrose gradient containing 30 mM Tris–HCl, pH 7.5, 100 mM NaCl, 10 mM MgCl2and
centrifuged in a Sorvall ultracentrifuge on a swinging rotor for 100 min at 180 000gat 4◦C. The fractions correspond-ing to the 80S peak and to the polysomes were collected monitoring the absorbance at 254 nm. Each fraction was aliquoted, flash frozen in liquid N2and stored at−80◦C
be-fore AFM imaging.
Preparation of polysomes from rabbit reticulocytes (RRL)
Briefly, 1 ml of untreated rabbit reticulocytes (RRL) pre-pared according to Jackson and Hunt (56) was comple-mented with 20M hemin (Fluka), 50g/ml creatine phos-phokinase, 10 mg/ml creatine phosphate (Fluka), 50g/ml of bovine liver tRNAs and 5 mM of D-glucose. Endoge-nous RNAs were translated in 80 l reactions containing 40l of the complemented, untreated RRL in the presence of 75 mM KCl, 0.5 mM MgCl2, amino acids (20M each),
5 mM DTT and 0.1 U/l RiboLock RNase (Fermentas) for 10 min at 30◦C. Reactions were stopped by cooling the tube on ice for 1 min and adding 320l of ice-cold, low salt buffer (15 mM NaCl, 1 mM MgCl2, 10 mM Tris pH 7.4, 1
mM DTT, 0.12 mg/ml cycloheximide). Polysome purifica-tion following the above-menpurifica-tioned protocol.
qPCR from RRL polysomal fractions
Nine fractions were collected monitoring the absorbance at 254 nm. From 0.5 ml of each fraction, total RNA was isolated after proteinase K treatment, phenol–chloroform extraction and isopropanol precipitation and resuspended in 20 l of RNase free water. For each fraction, 4 l of total RNA was reverse-transcribed using the iScripTM
cDNA Synthesis Kit (Biorad) in a final volume of 20
l. One microlitre of cDNA and 400 nM of each primer were used in combination with the KAPA SYBR Green kit (KAPA Biosystems) in a final volume of 10 l. Forty amplification cycles (95◦C for 15 s, 55◦C for 20 s, 72◦C for 25 s) were run in a CFX-96 C1000 thermal cycler (Biorad) using primers specific to rabbit beta-globin (for-ward: 5-TTTGCTAAGCTGAGTGAACTGC; reverse: 5 -CCAGCCACCACCTTCTGATA), rabbit 15-lipoxigenase (forward: 5-TTCTGTCCCCCTGACGATCT; reverse: 5 -GATCTCTCGGCACCAGCTCT) and rabbit 18S rRNA (forward: 5-ACGGCCGGTACAGTGAAACT; reverse: 5-GACCGGGTTGGTTTTGATCTG). qPCR amplifica-tion efficiency was calculated for each gene using a relative standard curve derived from a cDNA of total RNA isolated from RRL. The Ct values were determined by the CFX Manager 2.1 (Biorad) applying multi-variable, non-linear regression model to individual well fluorescence traces. The amount of each target gene was quantified relative to the fractionn◦14 and normalized to the level 18S gene, accord-ing to Pfaffl equation (57). qPCR reactions were carried out in triplicates.
Atomic force microscopy imaging
For AFM imaging a 20l of Hek-293 or RRL polysomal fraction were adsorbed for 3 min on freshly cleaved mica pretreated with Ni2 +for 3 min. The samples were then
cov-ered with 100 mM Hepes, pH 7.4, 10 mM NaCl, 10 mM MgCl2, 100g/ml cycloheximide and 3% (w/v) sucrose.
Af-ter 1 h of incubation at 4◦C, the sample was extensively and gently washed with DEPC-water containing 100g/ml cy-cloheximide and dried at 20◦C for at least 1 h.
Imaging was performed using a Cypher AFM (Asylum Research, Santa Barbara, CA, USA) in AC mode, us-ing Asylum routines for the IGOR software environment (WaveMetrics, Portland, OR, USA). Scans have been ac-quired using OMCL-AC240TS tips (Olympus) with nom-inal spring constant of 2 N/m. The scanning parameters were as follows: typical driving frequency 70 kHz in air, scanning rate 1-2 Hz. AFM images were levelled line by line and rendered using the Gwyddion (gwyddion.net) soft-ware package. Images were analysed in ImageJ (58) to count ribosomes in polysomes, manually picking the ribosomal particles and assigning them to their respective polysomes using a custom ImageJ macro. Thousand polysomes were analysed (objects=3300 for yeast;objects=2251 for Hek-293;objects=696 for MCF-7, objects=901 for polysomes from RRL) picking more than 20 000 ribosomes.
by guest on August 4, 2015
http://nar.oxfordjournals.org/
Model
In order to provide the modelling of translation, the elonga-tion phase was divided in nine different steps, each of them linked to a flux (measured in ribosomes/sec) representing the transition of ribosomes from one stage to the next, sim-ilarly to what was done in (29).
The model assigns to each codon of an mRNA nine ordi-nary differential equations describing the rate of change in the number of ribosomes at positionn(referred to the po-sition of the P site of ribosomes),Sn, at the different stages
(Equations (1)-(11)) ; note that all the equations are tran-script specific). We then set all fluxes equal to 0 to compute the steady-state values of the variables, which is obtained by solving the resulting algebraic system. This procedure, with the addition of a set of initial conditions i.e. of the hypoth-esis that at time 0 there are no ribosomes along the tran-script, allows to compute the steady-state number of ribo-somes bound to an mRNA in this condition. See also ‘Re-sults’ section for the assumptions of the model and Supple-mentary File 1 for further information on fluxes, notations and all parameters involved in the model.
d Sn(2)
dt =VI+V
(−2)
n −Vn(2) n=1 (1) d Sn(2)
dt =V
(1)
n−1+V (−2)
n −V
(2)
n ∀n=2...N−1 (2) d Sn(3)
dt =V
(2)
n +Vn(−3)−Vn(−2)−Vn(3)∀n =1...N−1 (3) d S(