ISSN: 2146-4138 www.econjournals.com
The Export Supply Model of Bangladesh: An Application of Cointegration
and Vector Error Correction Approaches
MD.MONIRUZZAMAN
Deputy Secretary to the Government of Bangladesh & PhD Fellow. Institute of Bangladesh Studies
Rajshahi University, Bangladesh Email: [email protected]
Mahmudul Mannan Toy Department of Business Administration Shanto-Mariam University of Creative Technology Dhaka, Bangladesh. Email: [email protected]
A. B. M. Rashedul Hassan
Treasurer, Atish-Dipankar University of Science and Technology Dhaka, Bangladesh. Email: [email protected]
ABSTARCT: The broad objective of this study is to empirically estimate the export supply model of Bangladesh. The techniques of cointegration, Engle-Granger causality and Vector Error Correction are applied to estimate the export supply model. The econometric analysis is done by using the time series data of the variables of interest which is collected from various secondary sources. The study has empirically tested the hypothesis, long run relationship and casualty between variables of the model. The cointegration analysis shows that all the variables of the study are co-integrated at their first differences meaning that there exists long run relationship among the variables. The VECM estimation shows the dynamics of variables in the export supply function and the short run and long run elasticities of export supply with respect to each independent variable. The error correction term is found negative which indicates that any short run disequilibrium will be turned into equilibrium in the long run.
Keywords: Engine of Growth,Cointegration, Granger Causality, VECM, VAR, Impulse Response. JEL Classifications: F4
1. INTRODUCTION
The supply of export is very much crucial for developing and least developing countries. For a small open country like Bangladesh the supply capacity of exports is more important than the demand for exports because a country cannot enhance its export earnings if she has no capacity to produce. Many economists considered ‘foreign trade’ as the ‘Engine of Growth’ because it facilitates the specialization in the production of goods and services. Economic theories suggest that export earnings reduces the dependence on foreign aid, augments the base of industrialization, increases foreign exchange earnings, creates employment opportunities, helps in transformation of the economic structure etc. Empirical evidences support that there exist positive correlation and strong causality between foreign trade and economic growth and development of many countries (Balassa, 1987).
on traditional markets, and low level of product diversification on the export front. Though Bangladesh has been suffering chronic trade deficit since independence but there are a number of remarkable achievement in improving trade-GDP ratio, export-GDP ratio, import-GDP ratio, export diversification in terms of items and markets, increase imports of intermediate goods and industrial raw materials and capital goods. The significant increase in trade-GDP ratio of Bangladesh reflects greater degree of openness of the economy to the external world. The structure of export has changed significantly, shifting from primary goods to manufacturing goods and from traditional to non-traditional items. The structure of imports also changed significantly in terms of commodity and sources. The government initiated extensive trade reform programs to increase of export of newly developed non-traditional and higher value added products. The major elements of the policy reforms included liberalization of imports and simplification of import procedures, rationalization of tariff structure, reduction in tariff rates and quantitative restrictions, pursuit of a flexible exchange rate policy, allowing IMF-consistent counter trade, and provision of specific and transparent export promotion measures. The Five Year Export Policy and Five Year Import Policy Orders were adopted by the government during the Fifth Five-Year Plan period (1997-2002) to improve the foreign trade sector of Bangladesh with emphasis on product diversification and quality improvements, backward linkages, foreign investment etc on export side and import of raw materials, capital machinery on the import side. The foreign trade of Bangladesh had been protected by high tariff and non-tariff barriers in the mid-80s to support the domestic manufacturing industries (Bhuyan and Rashid, 1993). The economy has been more open and liberal in the recent years as compared to the situation during 1970s and 1980s.
The broad objective of the study is to estimate the export supply model of Bangladesh and the specific objectives are: to find out growth trend of export supply in the pre-liberalized and post-liberalized regime; to trace out the structural breakpoint in the export supply; to show the co-integration between the variables of the model and to estimate the short run and long run elasticities. The paper is organized as follows: Section 1 deals with the introduction, Section 2 depicts literature review, Section 3 deals with data and methodology, section 4 analyses empirical results and section 5 places conclusion.
2. REVIEW OF LITERATURE
The existing literatures, related to this study, are briefly reviewed in this section. Ahmed (2001) analyzes the trends and impact of trade liberalization in Bangladesh. He examines the impact of trade liberalization on import demand, export supply, industrial growth of Bangladesh using modern time series method of co-integration and error correction modeling. He finds that both at aggregate and commodity level the import is generally less sensitive to import price changes whereas export both at aggregate and commodity level are sensitive to real exchange rate and relative prices. Bangladesh export supply is found as price inelastic at both levels. Using ECM he finds that trade liberalization has significant role in improving the trade performance of Bangladesh. Reza (1981) analyses the chronic trade deficit of Bangladesh arguing that the export base and export earnings are persistently very low over a long span of time. He finds out the performance of export sub-sector is very poor because of heavy concentration on few traditional items like raw jute, jute goods, tea, fish, leathers etc. Analyzing the trade figures from 1950 to 1978 he tries to show the problems and prospect of this sub-sector. He also suggests for export-led growth strategy instead of import substitution growth strategy as a policy option.
traditional exports suffer from supply inelasticity in the world market. Roy (1991) analyses the determinants of export performance of Bangladesh using an econometric analysis. He examines the causal relationship of the determining factors and export performance for Bangladesh. His study finds that the export performance of Bangladesh is associated with greater commodity diversification of exports. He shows that commodity exports have been diversified more over the years. Liberalization of trade and industrial polices has important consequences for the composition of exports as well as growth and stability. But this study does not specifically cover the relationship between impact of trade liberalization and trade performance.
Raihan (2007) analyzed the dynamics of trade liberalization in Bangladesh in the context of policies and practices by using modern tools of economic analysis. He reviewed theoretical evidences between Trade Liberalization and economic growth, Trade Liberalization policies and programs in Bangladesh. He conducted a time-series evaluation of Bangladesh's Trade Liberalization in a changing perspective and in a global perspective, a dynamic panel econometric study on Bangladesh manufacturing industries, Short-run vs. Long-run Macro impacts of Trade Liberalization: an inter-temporal computable general equilibrium (CGE) model of Bangladesh.
Santos-Paulino and Thirlwall (2004) have used panel data and times series/cross section analysis to estimate the effect of trade liberalization on export growth, import growth, the balance of trade and the balance of payments for a sample of 22 developing countries that have adopted trade liberalization policies since the mid-1970s. They observe that liberalization stimulated export growth but raised import growth by more, leading to a worsening of the balance of trade and payments.
Rahman (2008) analyses the composition, performance, trend and policy of foreign trade of Bangladesh using annual time series data and concludes that despite structural bottlenecks the export sector of Bangladesh performs well. He finds that the growth rate of export of Bangladesh is higher compared to other SAARC countries and even higher than the world rate. The export share of primary commodities has been decreasing over the years while the same for manufactured commodities has increased substantially. On the other hand, import of primary commodities declines and the share of industrial and capital goods increases.
Hossain and Alauddin (2005) examined the process of Bangladesh's trade liberalization and its impact on the growth and structure of exports, imports, GDP and other relevant macroeconomic variables with particular emphasis on exports. This study provides an updated account of the various structural adjustment programs undertaken in Bangladesh including trade, fiscal, industrial and financial reforms, and explains how these reforms supplemented one another to promote greater market and export orientation. An empirical investigation based on a distributed lag modeling and cointegration suggests that both anti-export bias reduction and import-GDP ratio, the latter being a proxy for imported capital, have significantly impacted on exports in the long-term.
3. DATA AND METHODOLOGY
3.1. Trend Growth Rate (TGR)
TGR is computed by taking the form of mathematical equation as Xt = X0(1+r) t
, where X is the concerned variable, t represents time period. The procedure is as follows(Gujarati, 2003):
(i) Taking natural logarithm on both sides of the equation Xt = X0(1+r)t
(ii) lnXt = lnX0 + T ln (1+r), let β0 = lnX0 and β1= ln(1+r), the original equation can be written as
lnXt = β0 + β1T, ln means natural logarithm.
(iii)Adding disturbance error term, ut, the econometric specification takes the form as ln Xt = β0 +
β1T + ut
(iv)The model specified above takes the form of a linear regression model in the sense that coefficients β0 and β1 are in linear form. The model becomes a semilog or log-lin form. Here
X0 is the regressand and T is repressor. β1 gives instantaneous growth rate (at a point in time).
(v) Using OLS method of linear regression we get the estimate of β1 which are the coefficients of
time variable. Once β1 are estimated then we take anti-log of β1. Then 1 is subtracted from the
anti-log of β1 and the results are multiplied by 100 to get the trend growth rate.
(vi)The formula for Trend Growth Rate (TGR) takes the following form: TGR = [Anti-log of estimated β1 – 1] X 100.
3.2. Co-integration Analysis
The concept of co-integration was developed by Engle and Granger in 1987. As we have mentioned earlier that stationarity in time series data is necessary to have a valid t statistics and F statistics. But it has been identified that two or more time series data can be cointegrated although each of which is individually non-stationary or random walk. Cointegration tells us about the presence of long run relation among two or more variables. When we go for running cointegration analysis, we assume that all variables are non-stationary. Secondly they are all integrated of the same order. Even, if the variables are not integrated in the same order, we still can continue with cointegration analysis. There are indeed two tools to identify whether a long run relation among variables are existing or not. They are Engel-Granger’s Residual based test and Johansen-Juselius (JJ) test.
3.3. Pairwise Granger Causality Tests
Pairwise Granger causality tests are conducted to examine whether an endogenous variable can be treated as exogenous. For each equation in the VAR, the output displays (Wald) statistics for the joint significance of each of the other lagged endogenous variables in that equation. The statistic in the last row is the statistic for joint significance of all other lagged endogenous variables in the equation. When we estimate a VEC, the lagged variables that are tested for exclusion are only those that are first differenced. The lagged level terms in the cointegrating equations (the error correction terms) are not tested.
3.4. VECM Techniques
Generally the structural approach to time series modeling uses economic theory to examine the relationship among the variables of the model because economic theory can not sufficiently provide a dynamic specification that identifies all of these relationships. Moreover, estimation and inference are complicated by the fact that endogenous variables may appear on both the left and right sides of equations. These problems lead to alternative, non-structural approaches to modeling the relationship among several variables such as the estimation and analysis of vector autoregression (VAR) and the vector error correction (VEC) models. These models are used for testing the presence of cointegrating relationships among several non-stationary variables. The vector autoregression (VAR) is commonly used for forecasting systems of interrelated time series and for analyzing the dynamic impact of random disturbances on the system of variables.
Variables for Aggregate Export Supply Model:
(i) Real Value of Merchandise Exports in log form ( LRX) (ii) Relative Price of Exports (LRPX)
3.5. Specification of Model
The Export Supply Model of Bangladesh
LRXt = 1+ 2 LRPXt + 3 LRGDPt + 4 LRGCFt+5 LIBDt + εt ; (t N( 0, 2 )
[LRXt = Real Exports in log form, LRPXt= Relative Price of Exports in log form, LRGDPt
= Real GDP in log form, LRGCFt = Real Gross Capital Formation in log form, LIBDt =
Liberalization Shift Dummy, εt = Error Term, = Coefficients]
All the dependent and independent variables are taken in log form except dummy variable in both models. Therefore, the estimated coefficients of all independent variables represent respective elasticities.
4. EMPRICAL RESULTS Growth Trend of Exports
The Compound Growth Rate (CGR) and compound annual growth rate of exports are estimated separately for the pre-liberalization and post-liberalization regimes as well for the entire study period from 1972-1973 to 2009-2010. The estimates are presented in Appendix Table A.1. It is observed that the trend growth rate of exports in the pre-liberalization regime i.e. 1972-1973 to 1989-1990 is 8.81 per cent while the same is 11.90 per cent in the post-liberalization period i.e. 1989-1990-1991 to 2009-2010. The CGR for the whole study period i.e. 1972-1973 to 2009-2010 is estimated as 11.56 per cent. It indicates that the growth rates of exports are higher in the post-liberalization period. On the other hand it is observed that the compound annual growth rate of exports in the pre-liberalization regime i.e. 1972-1973 to 1989-1990 is 8.54 while the same is 11.88% in the post-liberalization period i.e. 1990-1991 to 2009-2010. The CAGR for the whole study period i.e. 1972-1973 to 2009-2010 is estimated as 10.63%. It can be concluded that trade reforms or trade liberalization in Bangladesh has positive impact on exports in Bangladesh.
Co-integration Analysis of Export Supply Model
The Co-integration test is conducted to examine whether there are any long run relationship among the variables of the model. Johansen and Johansen and Juselius co-integration test is applied here. Two tests i.e. the trace test and the maximal eigenvalue test are used to determine the number of cointegrating vectors. Te cointegration test results are shown in Table 1 and Table 2.
Table 1. Johansen Co-integration Test Based on Maximum Eigenvalue
Trend assumption: Linear deterministic trend
Unrestricted Cointegration Rank Test (Maximum Eigenvalue)
Hypothesis Eigenvalue Max-Eigen
Statistics
0.05% Critical Value
p-value**
Null Alternative
r* = 0 r = 1 0.634 35.23 27.58 0.004
r ≤ 1 r = 2 0.390 17.31 21.13 0.157
r ≤ 2 r = 3 0.234 9.340 14.26 0.258
r ≤ 3 r = 4 0.011 0.411 3.841 0.521
Note: Max-eigenvalue test indicates 1 cointegrating eqn(s) at the 0.05 level * denotes rejection of the hypothesis at the 0.05 level
Table 2. Johansen Co-integration Test Based on Trace Test
Trend Assumption: Linear Deterministic Trend Unrestricted Cointegration Rank Test (Trace)
Hypothesis Eigenvalue Trace
Statistics
0.05% Critical Value
p-value**
Null Alternative
r* = 0 r = 1 0.634555 62.30271 47.85613 0.0013
r ≤ 1 r = 2 0.390302 27.07037 29.79707 0.0999
r ≤ 2 r = 3 0.234234 9.752651 15.49471 0.3003
r ≤ 3 r = 4 0.011699 0.411881 3.841466 0.5210
Trace test indicates 1 cointegrating eqn(s) at the 0.05 level * denotes rejection of the hypothesis at the 0.05 level **MacKinnon-Haug-Michelis (1999) p-values
Estimation of Export Supply Model by OLS
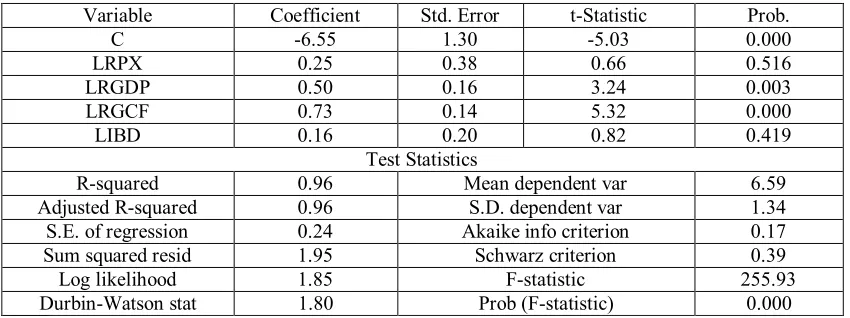
Since all the variables are stationary at the first difference and they are Cointegrated the export supply model is run by OLS method. Details are shown in Appendix Table A.2. The estimated equation is as follows:
LRX = -6.55 + 0.25LRPX + 0.50LRGDP + 0.73LRGCF + 0.16LIBD
All estimated coefficients are found in expected sign but all are not statistically significant (Table 6.21). The R-squared (R2) of the model is very high i.e. 0.969 and adjusted-R2 is 0.965. It signifies that about 97 per cent variation in the dependent variable i.e. supply of real export (RX) is explained by the independent variables i.e. relative price of export supply (RPX), real GDP(RGDP) and real gross capital formation(RGCF). The DW statistic is low i.e. 1.10. the F-statistics of the model is computed as 255.92. The mean of the dependent variable in logarithm is found as 6.59 and the standard deviation is 1.33. The relative price of real export is positively related to the supply of real export as expected but the relationship is not statistically significant meaning that relative price is not an important determinant of export supply.
The coefficient of real GDP is positive; meaning that the supply of real export has positively related with real GDP and the relationship is statistically significant. The coefficient of real gross fixed capital formation is positive; meaning that the supply of real export has positively related with real gross fixed capital formation and the relationship is statistically significant. The coefficient of liberalization dummy is positive; meaning that the supply of real export has increased in post-liberalization regime but the relationship is not statistically significant. Since all the variables except dummy variable are taken in natural logarithm form, the estimated coefficients represent the respective elasticity of export supply of Bangladesh. The price elasticity of export supply is estimated at 0.25, the income elasticity of export supply is estimated at 0.50 and the gross fixed capital formation elasticity of export supply is estimated at 0.73. The estimated coefficient of liberalization dummy is very low (0.16) which is insignificant meaning that liberalization of trade has not significant impact on the export supply performance of Bangladesh. Therefore, the policy makers should be more cautious in designing the trade policy reforms in Bangladesh for reaping the full benefit of trade liberalization.
Vector Error Correction Model (VECM) for Aggregate Export Supply Model
Long Run and Short Run Elasticity of the Aggregate Export Supply Model
The long run and short run elasticities of aggregate export supply model is presented in Table 3. The short run elasticities are coefficients of independent variables at one lag in VECM and the long run elasticities are estimated by dividing the respective lag one level coefficient of independent variables by lag one level coefficient of dependent variable.
Table 3 .Long Run and Short Run Elasticities of Aggregate Export Supply Model Dependent Variable: Log(RX)
Variables Short Run Long Run
Log(RPX) 0.16 0.24
Log(RGDP) 0.11 0.16
Log(RGCF) 0.23. 0.34
LIBD 0.02 0.03
Source: Researcher’s Own Calculation.
The short run elasticities of real export supply are 0.16 with respect to relative price, 0.11 with respect to real GDP, 0.23 with respect to real gross capital formation and 0.02 with respect to liberalization dummy. The long run elasticities of real export supply are 0.24 with respect to relative price, 0.16 with respect to real GDP, 0.34 with respect to real gross capital formation and 0.03 with respect to liberalization dummy.
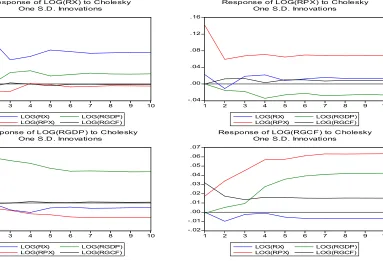
Impulse Response of the variables based on VECM
The impulse response of the variables based on VECM is shown in Figure 1. The effect of a one-time shock to one of the innovations on current and future values of the endogenous variables can be traced out by an impulse response function. A shock to the i-th variable not only directly affects the i-th variable but is also transmitted to all of the other endogenous variables through the dynamic (lag) structure of the VAR. The response of real export is correlated with other variables in the dynamic structure of VAR. In response of real export the other three independent variables are convergent in the long run. In case of relative price, real export and real gross capital formation are convergent but real GDP moves divergently. The response of real GDP shows that all independent variables are strongly responded and convergent. The response of real gross capital formation shows that all variables move divergently.
Figure 1. Impulse Response of the variables based on VECM
-.04 .00 .04 .08 .12 .16
1 2 3 4 5 6 7 8 9 10
LOG(RX) LOG(RPX)
LOG(RGDP) LOG(RGCF) Response of LOG(RX) to Cholesky
One S .D . Innovations
-.04 .00 .04 .08 .12 .16
1 2 3 4 5 6 7 8 9 10
LOG(RX) LOG(RPX)
LOG(RGDP) LOG(RGCF) Response of LOG(RP X) to Cholesky
One S.D. Innovations
-.10 -.05 .00 .05 .10 .15 .20
1 2 3 4 5 6 7 8 9 10
LOG(RX) LOG(RPX)
LOG(RGDP) LOG(RGCF) Response of LOG(RGDP ) to Cholesky
One S .D . Innovations
-.02 -.01 .00 .01 .02 .03 .04 .05 .06 .07
1 2 3 4 5 6 7 8 9 10
LOG(RX) LOG(RPX)
LOG(RGDP) LOG(RGCF) Response of LOG(RGC F) to C holesky
5. CONCLUSION
It reveals from the study that relative price of export is not an important determinant of export supply of Bangladesh meaning that Bangladesh, as a small open country, is a price taker in the international market. The export supply is positively related with GDP but its contribution in increasing export supply is very low. The gross capital formation appears as the most important determinant of the export supply of Bangladesh. So the enhancement of export supply of Bangladesh is largely depended of gross capital formation meaning that more investment in exportable sector could significantly contribute in this sector.
The policy makers should take into account the role of gross capital formation in designing our export policy. The liberalization dummy variable for regime change from inward looking strategy to export led growth strategy is found negative and insignificant. Therefore, the policy makers should also be more cautious in formulation policies under trade liberalization programs.
REFERENCES
Ahmed, Nasiruddin. (2001), Trade Liberalization in Bangladesh: An Investigation into Trend. Dhaka: The University Press Limited. 6-16, 35-48, 98-120.
Balassa, B. (1978), Exports and Economic Growth: Further Evidence. Journal of Development Economics, 5(2), 55-75.
Bhuyan, A. R. (1982), Non-Traditional Exports of Bangladesh: Trends, Performance and Prospects. Dhaka: Bureau of Economic Research, University of Dhaka. 5-25, 50-55.
Bhuyan, A.R. and Rashid, M.A. (1993), Trade Regimes and Industrial Growth: A Case Study of Bangladesh. Dhaka: Bureau of Economic Research, University of Dhaka. 22, 25, 60.
Dickey, D.A., and Fuller, W.A. (1979), Distribution of the Estimators for Autoregressive Time Series with a Unit Root. Journal of American Statistical Association, 74, 427-431.
Engle, R. and C. Granger. (1987), Co-integration and Error Correction: Representation, Estimation and Testing. Econometrica. 55. 251-276.
Gujarati, Damodar N. (2003), Basic Econometrics. 4th ed.; Singapore: McGraw Hill Book Co. 175-181, 792-815.
Hossain, Mohammad A. and Mohammad Alauddin. (2005), Trade Liberalization in Bangladesh: The Process and Its Impact on Macro Variables Particularly Export Expansion. Journal of Developing Areas, 39(1), 131.
Kabir, R. (1988), Estimating Import & Export Demand Functions: The Case of Bangladesh. The Bangladesh Development Studies. Dhaka: BIDS. Vol. 16, No. 4. 40-55.
Mahmood, Wahiduddin. (1982), Possibilities of Export-led Growth in Bangladesh. The Bangladesh Journal of Political Economy. Dhaka, 6(1), 22-45.
Phillips, P.C.B. and Perron, P. (1988), Testing for a Unit Root in time Series Regression. Biometrika 75, 301-318.
Rahman, Mohammad Mafizur. The Foreign Trade of Bangladesh: its Composition, Performance, Trend and Policy, retrieved from http://eprints.usq.edu.au/4193/rahman_JBS_v9n2, accessed on 17-07-2009.
Raihan, Selim. (2007), Dynamics of Trade Liberalisation in Bangladesh: Analyses of Policies and Practices. Dhaka: Pathak Shamabesh. 98-99.
Reza, Sadrel. (1981), The Export Trade of Bangladesh 1950-1978. Dhaka: Dhaka University. 5-25. Roy, Dilip Kumar. (1991), Determinants of Export Performance of Bangladesh. The Bangladesh
Development Studies. Dhaka: BIDS. 19(4), 61-75.
Santos-Paulino, Amelia and Thirwall A. P. (2004), The Impact of Trade Liberalization on Exports, Imports and the Balance of Payments of Developing Countries. The Economic Journal, 114, 240-275.
Johansen, S. (1988), Statistical Analysis of Cointegrating Vectors. Journal of Economic Dynamics and Control, 12(1988), 231-54.
Appendices
Table A.1
Compound Growth Rates and Compound Annual Growth Rates for Exports
Period Estimated Trend
Regression
CGR1 (%) CAGR2(%)
Pre-liberalization 1972-1973 to 1989-1990
LX= 5.71 + 0.084T 8.81 8.54
Post-liberalization 1990-1991 to 2009-2010
LX= 5.45 + 0.112T 11.90 11.88
Overall 1972-73 to 2009-2010
LX= 5.50 + 0.109T 11.56 10.63
Note:
1. CGR = [Anti-log of estimated b – 1] X 100, log means natural logarithm 2. CAGR = [Ending Value/Beginning Value]1/N – 1
Table A.2
Regression results of Aggregate Export Supply Model Dependent Variable: LRX( Real Export in logarithm)
Variable Coefficient Std. Error t-Statistic Prob.
C -6.55 1.30 -5.03 0.000
LRPX 0.25 0.38 0.66 0.516
LRGDP 0.50 0.16 3.24 0.003
LRGCF 0.73 0.14 5.32 0.000
LIBD 0.16 0.20 0.82 0.419
Test Statistics
R-squared 0.96 Mean dependent var 6.59
Adjusted R-squared 0.96 S.D. dependent var 1.34
S.E. of regression 0.24 Akaike info criterion 0.17
Sum squared resid 1.95 Schwarz criterion 0.39
Log likelihood 1.85 F-statistic 255.93
Durbin-Watson stat 1.80 Prob (F-statistic) 0.000
Table A.3
Vector Error Correction Model (VECM) Results
Dependent Variable: ∆Log(RX)
Regressors Coefficients T-statistics Test Statistics
C (Intercept) -0.176 -1.38 R-squared 0.376
∆Log(RX)(-1) 0.672 3.34 Adj. R-squared 0.141
∆Log(RX)(-2) 0.039 0.24 Sum sq. resids 0.352
∆Log(RPX)(-1) 0.159 0.73 S.E. equation 0.121
∆Log(RPX)(-2) 0.017 0.076 F-statistic 1.603
∆Log(RGDP(-1) 0.109 0.68 Log likelihood 29.46
∆Log(RGDP)(-2) 0.074 0.46 Akaike AIC -1.145
∆Log(RGCF)(-1) 0.232 1.00 Schwarz SC -0.696
∆Log(RGCF)(-2) -0.068 -0.43 Mean dependent 0.125
∆LIBD -0.015 -0.155 D.W 1.86