O R I G I N A L A R T I C L E
Open Access
Experimental application of an automated
alignment correction algorithm for
geological CT imaging: phantom study and
application to sediment cores from
cold-water coral mounds
Stephan Skornitzke
1, Jacek Raddatz
2, André Bahr
3, Gregor Pahn
1, Hans-Ulrich Kauczor
1and Wolfram Stiller
1*Abstract: Background:In computed tomography (CT) quality assurance, alignment of image quality phantoms is crucial for quantitative and reproducible evaluation and may be improved by alignment correction. Our goal was to develop an alignment correction algorithm to facilitate geological sampling of sediment cores taken from a cold-water coral mount.
Methods:An alignment correction algorithm was developed and tested with a CT acquisition at 120 kVp and 150 mAs of an image quality phantom. Random translation (maximum 15 mm) and rotation (maximum 2.86°) were applied and ground-truth was compared to parameters determined by alignment correction. Furthermore, mean densities were evaluated in four regions of interest (ROIs) placed in the phantom low-contrast section, comparing values before and after correction to ground truth. This process was repeated 1000 times. After validation, alignment correction was applied to CT acquisitions (140 kVp, 570 mAs) of sediment core sections up to 1 m in length, and sagittal reconstructions were calculated for sampling planning.
Results:In the phantom, average absolute differences between applied and detected parameters after alignment correction were 0.01 ± 0.06 mm (mean ± standard deviation) along thex-axis, 0.11 ± 0.08 mm along they-axis, 0.15 ± 0.07° around thex-axis, and 0.02 ± 0.02° around they-axis, respectively. For ROI analysis, differences in densities were 63.12 ± 30.57, 31.38 ± 32.10, 18.27 ± 35.57, and 9.59 ± 26.37 HU before alignment correction and 1.22 ± 1.40, 0.76 ± 0.9, 0.45 ± 0.86, and 0.36 ± 0.48 HU after alignment correction, respectively. For sediment core segments, average absolute detected parameters were 3.93 ± 2.89 mm, 7.21 ± 2.37 mm, 0.37 ± 0.33°, and 0.21 ± 0.22°, respectively.
Conclusions:The alignment correction algorithm was successfully evaluated in the phantom and allowed a correct alignment of sediment core segments, thus aiding in sampling planning. Application to other tasks, like image quality analysis, seems possible.
Keywords:Alignment correction, Cold-water corals, Phantoms (imaging), Sediment core, Tomography (x-ray computed)
* Correspondence:[email protected]
1Diagnostic and Interventional Radiology (DIR), Heidelberg University
Hospital, Im Neuenheimer Feld 110, 69120 Heidelberg, Germany Full list of author information is available at the end of the article
Background
Geometrically accurate positioning of scanned objects as well as of patients is important for ensuring adequate image quality and stability of measured computed tom-ography (CT) numbers. Furthermore, in order to minim-ise patient radiation exposure, patients should be centred in the field of view of the CT system. Even more so, quantitative evaluations, e.g., of standardised image quality phantoms, rely on the exact positioning of the imaged object to produce reproducible and accurate results [1].
CT imaging becomes increasingly important in geos-ciences, especially in sedimentological cold-water coral (CWC) studies [2, 3]. High-resolution CT data not only provides information about qualitative occurrences of CWC fragments, but also enables the quantification of vis-ual observations of CWC skeletons in sediment cores from clast-size and clast-orientation analyses and helps to fur-ther understand CWC mound growth, combined with radiometric age determinations as radiocarbon or230Th/U [2]. The qualitative information on coral occurrences in the sediment core further helps for accurate sampling with minimal disturbance of sediment and other fragments by allowing to locate CWC fragments below the surface.
Sampling of sediment cores is usually carried out with a resolution of up to 1 cm. Coral clast sizes of about 2 cm may easily disturb sediment during sampling; therefore, non-destructive information from CT imaging can greatly improve the sampling process. Based on the coral clast sizes, the accurate orientation of the CT image data used for visualisation needs to be better than 0.5 cm. As dis-cussed above, geometrically exact object positioning is im-portant for quantitative evaluations based on CT image data and misalignment of cores may lead to deviations in the expected and actual location of coral clasts within the sediment cores.
Therefore, the main goal of this study was the develop-ment of an aligndevelop-ment correction algorithm to facilitate the CT image-based analysis and systematic sampling of sedi-ment cores. A simple alignsedi-ment correction algorithm was developed for restoring alignment of the imaged cores with the main axes of the scanner system and evaluated
M125–34-2; 21°56,959′S, 39°32,031′ W; Fig.1) [4]. This CWC-bearing sediment core has the potential to provide an insight into the origin, growth, and demise of these mounds as well as to carry out paleoceanographic recon-structions [5,6].
On board of the vessel, the sediment core was split into sections of 1 m, but remained unopened as a prerequisite for subsequent CT imaging at the Clinic of Diagnostic and Interventional Radiology (DIR) of Heidelberg University Hospital, Heidelberg, Germany. For paleoceanographic analysis, the 1-m sections are cut by a diamond saw (blade thickness 2–3 mm) along the longitudinal axes while still frozen in order to avoid sediment and coral disturbances (see Fig. 1). As described in detail below, CT acquisitions of the sediment core sections containing CWCs were performed for sampling planning. However, despite taking great care to align cores with the main axes of the CT scan-ner system using the system’s laser sight, shape, length, and mechanical deformation of cores may influence accurate core alignment, thus leading to deviations in expected and actual location of coral clasts within the sediment cores, as detailed in Fig.2. To allow for the calculation of geometric-ally accurate sagittal reconstructions of CT acquisitions of sediment core sections containing CWCs, an alignment correction algorithm was developed for restoring align-ment of imaged cores with the main axes of the CT
scan-ner’s coordinate system. The developed algorithm was
evaluated for its performance using CT acquisitions of a standard image quality phantom.
Image acquisition Phantom
For evaluating the algorithm performance, a CT acquisition of a standard image quality phantom was used (ConeBeam Phantom, QRM Quality Assurance in Radiology and Medi-cine GmbH, Möhrendorf, Germany). The phantom was scanned at 120 kVp tube potential and 150 mAs tube current-time product with a pitch of 0.95 (SOMATOM
Definition Flash; Siemens Healthineers, Forchheim,
Sediment cores
Six sediment core sections from cold-water coral mounds taken during research cruise M125, as described above, were imaged using the abovementioned CT scanner system (SOMATOM Definition Flash). The cores consist of sedi-ment embedded in the core liner. Individual core sections had a length of up to 1 m and a diameter of approximately 12 cm. For image acquisition, core sections were manually aligned with the main axes of the CT scanner coordinate system using the integrated laser sight system. Image ac-quisitions were performed at 140 kVp tube potential and 570 mAs tube current-time product with a pitch of 0.4. Im-ages were reconstructed with iterative reconstruction (AD-MIRE, Siemens Healthineers) using a sharp kernel (I70h level 3), a slice thickness/increment of 0.5 mm/0.3 mm, and an isotropic voxel size of 0.35 mm by 0.35 mm.
Alignment correction algorithm
A previously developed algorithm for positioning of re-gions of interest (ROIs) in image quality phantoms was
adapted for the task of correcting sediment core alignment [7]. The algorithm was designed to restore alignment of a scanned cylindrical object with the longitudinal axis of the scanner as defined by the axes of the image stack (Fig.3). The algorithm performs the following steps:
1. Detecting three points on the boundary of the cylinder by one-dimensional edge detection on each individual image
2. Calculating circle equation for the detected object on each individual image, determining centre position and radius
3. Dividing image stack into segments based on changes in centre position and radius
4. Determining orientation of the longest segment based on centre positions relative to the CT coordinate system
5. Applying alignment correction based on determined orientation by translating and rotating images in the inverse direction
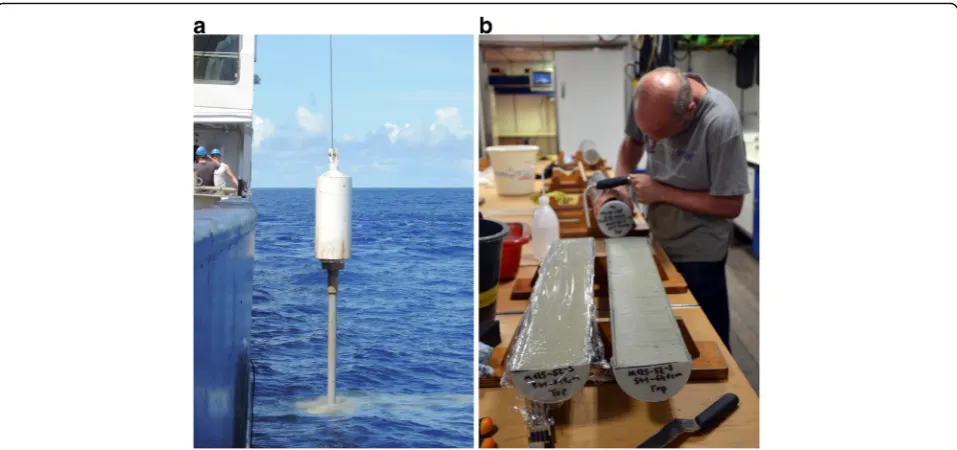
Fig. 1aRetrieval of sediment cores off the shore of Brazil during the research cruise M125.bExample of a sediment core equivalent to those used in this study, cut in half for sampling of core contents. Samples are only taken from one half of the core, while the other half is archived for reference (photo courtesy of J. Hoffmann)
First, three points on the boundary of the cylindrical object are determined by one-dimensional edge detec-tion for each image of the image stack. Edge detecdetec-tion is
performed twice along the x-axis of the reconstructed
images from the outside to the inside of the field of view (once in each direction). The third line search is
performed along the y-axis, from top-to-bottom, thus
omitting the CT scanner’s patient table (see Fig. 3). The line search is performed along the central rows of the image, using a bisection algorithm that minimises the variance of grey values of the two sections [7].
Second, using the three detected points on each image, the centre coordinates and radius, x0, y0, andr, defined by the circle equation, are determined for each image:
x−x0
ð Þ2þ y−y 0
ð Þ2¼r2 ð1Þ
Third, image segments are defined based on the changes in centre position and radius between images. Here, a segment is a continuous number of images, which have a very similar centre and radius: Images belong to the same segment, if the relative change in radius between two im-ages is below 0.5% and if the change in position is below two voxels in x- andy-direction. Segments shorter than five images are removed. Ideally, this step will yield one segment containing the entire core (Fig.4).
Fourth, the longest segment is chosen as the one most likely belonging to a major section of the object. A straight line is fit by regression through the determined
For evaluating algorithm performance, the CT acquisition of a standard image quality phantom was randomly ro-tated and translated, alignment correction was performed, and the algorithmically determined misalignment was compared to the ground truth.
Parameters for rotation and translation were randomly determined according to a uniform distribution. The
max-imum translation along x- and y-axis was up to 15 mm
each. The maximum rotation aroundx- andy-axis was up to 2.86° each (corresponding to 0.05 rad). For larger trans-lations and rotations, parts of the phantom may be outside of the reconstructed field of view, making a successful alignment correction impossible. Rotations and transla-tions were applied using the abovementioned tool. For evaluation, the process was repeated 1000 times, algorith-mically determined rotation and translation were com-pared to the ground truth of the generated parameters, and descriptive statistics were calculated.
Furthermore, four ROIs were placed in the low-contrast section of the phantom and mean CT numbers of the ROIs were compared for the initial acquisition, before and after alignment correction (see Fig.4).
Statistical analysis
Statistical testing was performed using SAS 9.4 (SAS Insti-tute, Cary, NC, USA). Differences between detected pa-rameters and ground truth and differences in measured CT numbers in ROIs were analysed using a one-sample
two-tailed Student t test. The null hypothesis was that
mean differences were equal to zero, which was rejected at a significance level of α= 0.05. Normality of data was assessed visually, using histograms and Q-Q scatterplots.
Application to sediment cores
Images of sediment core sections were corrected for their alignment using the algorithm described above. Detected misalignment, given as translation and rota-tion, was recorded. After alignment correcrota-tion, sagittal reconstructions were calculated, showing images in par-allel to the plane where the core is cut for sampling, thus allowing for planning of core sampling [7]. Sagittal im-ages were reconstructed at a slice thickness of 5 mm with an increment of 5 mm, adding a digital ruler as an
overlay to the image. Using the sagittal images, corre-sponding to a different depth below the surface, CWC fragments were identified and located, aiming to remove the samples from the sediment core with minimal destruc-tive effect on neighbouring CWC fragments and surround-ing sediment.
Results Phantom study
Average differences between generated parameters and the parameters detected by the algorithm, which can be used to investigate a bias in the difference, were -0.03 ± 0.09 mm for translation along the x-axis, 0.00 ± 0.16 mm for translation along the y-axis, 0.11 ± 0.11° for rotation around the x-axis, and 0.00 ± 0.05° for rotation around the y-axis. Mean differences differ significantly from 0, except for the difference in the translation along the
y-axis (Table1).
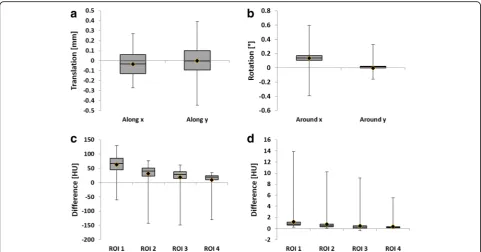
Average absolute differences between generated param-eters and the paramparam-eters detected by the algorithm, which can be used to determine the magnitude of the difference, were 0.01 ± 0.06 mm for translation along thex-axis, 0.11 ± 0.08 mm for translation along they-axis, 0.15 ± 0.07° for
rotation around the x-axis, and 0.02 ± 0.02° for rotation around they-axis (Fig.5).
For ROI analysis, mean CT numbers measured in the original dataset were -149.76 HU, -77.54 HU, -48.61 HU, and -17.00 HU. Averages of ROI measurements before alignment correction were -86.64 ± 30.57 HU, -46.16 ± 32.10 HU, -30.34 ± 35.57 HU, and -7.41 ± 26.37 HU and -148.54± 1.40 HU, -76.78 ± 0.90 HU, -48.16 ± 0.86 HU, and -16.64 ± 0.48 HU after alignment correction, re-spectively. Compared to the original dataset, the average difference before alignment correction was 63.12 ± 30.57 HU, 31.38 ± 32.10 HU, 18.27 ± 35.57 HU, and 9.59 ± 26.37 HU, while the average difference after alignment correction was 1.22 ± 1.40 HU, 0.76 ± 0.9 HU, 0.45 ± 0.86 HU, and 0.36 ± 0.48 HU, respectively (see Fig.5). Differ-ences in measured CT numbers between ground truth and alignment corrected data were statistically signifi-cant (see Table1).
Sediment cores
Core alignment could be corrected for all six sediment cores. Average detected parameters, showing a potential bias in misalignment, were -0.76 ± 4.82 mm for
transla-tion along the x-axis, -7.21 ± 2.37 mm for translation
along the y-axis, 0.37 ± 0.33° for rotation around the
x-axis, and 0.06 ± 0.30° for rotation around the y-axis (Table2).
Average absolute parameters, showing the magnitude of the misalignment, were 3.93 ± 2.89 mm for translation
along the x-axis, 7.21 ± 2.37 mm for translation along
the y-axis, 0.37 ± 0.33° for rotation around the x-axis, and 0.21 ± 0.22° for rotation around the y-axis. In com-parison to average, non-absolute results, translation along they-axis was negative for all cores, while rotation around thex-axis was positive for all cores.
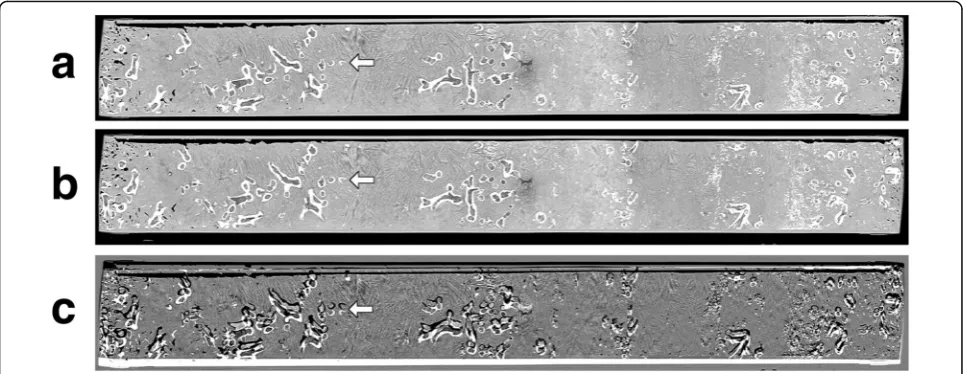
Sagittal reconstructions with corrected alignment of sedi-ment core sections with the CT scanner’s coordinate system could be calculated. Samples could successfully be taken
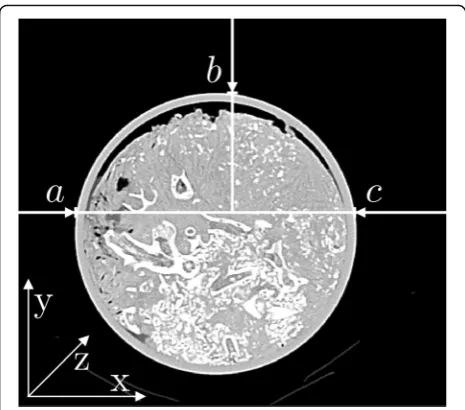
Fig. 4aExample of a plot of detectedx-coordinates of the object centre for valid segments (black line), plotted over slice position, for a sediment core. The blue line indicating core position inxwas fit to the largest segment (grey area).bExample axial CT image of the phantom used for evaluation of the algorithm, showing the placement of regions of interest (ROIs) in the low-contrast section of the phantom
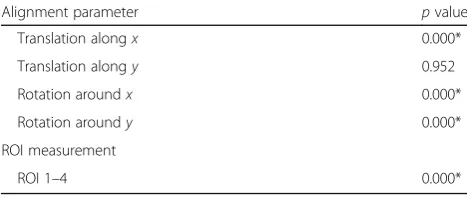
Table 1Reportedpvalues from the one-sample Studentttest, comparing determined parameters and measured mean CT numbers to ground truth
Alignment parameter pvalue
Translation alongx 0.000*
Translation alongy 0.952
Rotation aroundx 0.000*
Rotation aroundy 0.000*
ROI measurement
ROI 1–4 0.000*
ROIregion of interest
from the core segments using CT images as guidance to identify coral fragments for minimally destructive sampling (Fig.6).
Discussion
The main goal of this study was the development of an alignment correction algorithm to facilitate the CT image-based analysis and systematic sampling of sediment cores. Based on the phantom analysis, the presented algo-rithm is able to restore alignment of scanned cylindrical objects with the main axes of the CT scanner’s coordinate system. While statistical analysis shows a significant differ-ence between original and detected parameters, and the descriptive statistics show a relatively low minimum and high maximum (see Fig. 5), the highest average absolute
difference in translation of 0.11 ± 0.08 mm was clearly below the height/width of a single voxel of 0.39 mm. For errors in rotation, the effect on the image will be largest at the end of the phantom and can consequently be estimated
based on the average angle α= 0.15° and the phantom
lengthl= 143mmas follows:
Δx¼ tanαl
2¼0:18mm ð2Þ
That is, the average absolute error based on the rotation of Δx= 0.18mm was clearly below the height/width of a single voxel of 0.39 mm. Still, differences in CT numbers measured in ROIs show the sensitivity of quantitative eval-uations to misalignment (see Fig.5). In general, parameters affecting alignment in thex-direction could be determined with a higher accuracy than parameters affecting alignment in they-direction. This might be based on the fact that of the three points determined by the algorithm, two are established by line search in thex-direction.
By applying the alignment correction algorithm to the CT acquisitions of sediment cores containing CWCs, the alignment of the cores with the main axes of the CT scanner’s coordinate system could be restored. Sagittal reconstructions could be calculated, providing accurate image data as an aid for the sampling process of the cores. CWC fragments could successfully be extracted from the sediment cores for further analysis. In the
Fig. 5Results of the phantom evaluation of algorithmically determined parameters versus ground truth. Boxes indicate upper and lower quartile and median, diamonds indicate mean, and maximum and minimum are indicated by whiskers.aDifference in translation.bDifference in rotation.cDifference in CT numbers measured in regions of interest (ROIs) before correction.dDifference in CT numbers measured in ROIs after correction. Note the different quantities and units and the different scaling of they-axes
Table 2Misalignment algorithmically determined for CT acquisitions of sediment cores
Translation alongx[mm]
Translation alongy[mm]
Rotation aroundx[°]
Rotation aroundy[°]
Core 1 -4.92 -4.92 0.05 -0.19
Core 2 -0.35 -7.73 0.31 -0.10
Core 3 -2.46 -8.79 0.54 -0.08
Core 4 8.44 -9.84 1.01 -0.07
Core 5 1.05 -8.79 0.24 0.12
future, further image-based analysis of,e.g., CWC com-position may be facilitated by the use of dual-energy CT. Phantom alignment for analysis of standardised image quality phantoms in CT is often based on careful position-ing of the phantom usposition-ing the CT system’s laser sight and phantoms often provide markings to aid positioning [1]. Automatic post-processing and evaluation software for image quality phantoms may include some form of align-ment correction as part of quantitative image analysis, which can be tailored to the individual phantoms, or man-ual correction may be performed on the acquired images [1, 7, 9]. Based on the results presented here, the algo-rithm could be applied to provide a generalised alignment correction for CT phantoms of various designs. Applica-tion of alignment correcApplica-tion could simplify phantom posi-tioning before the acquisition as well as ROI placement and evaluation after acquisition, thus improving reprodu-cibility of the analysis [10].
Some limitations of the presented algorithm and its evaluation have to be considered. Most importantly, the al-gorithm is unable to detect and/or correct rotations around thez-axis. This is a consequence of the fact that the CT im-ages of the sediment cores do not offer any information on the rotation of the core. In future acquisitions, this could be alleviated by placing x-ray dense material (e.g., a metal wire) along the demarcations for cutting at the end of the core, which would allow to determine rotation. For image quality phantoms, where the composition of the phantom is known a priori, a detection of defining features (e.g., low-contrast insets, wires for modulation-transfer-function
determination) and their rotation relative to the CT coord-inate system is possible [7,9].
Furthermore, the algorithm is limited by the assump-tions on the size and position of the object, depending on a successful line search to determine object position. However, the misalignment necessary to exceed these limits is so large that it would either be already apparent during the image acquisition process or result from operator errors during image reconstruction. The same reasoning can be applied to the choice of pa-rameters used for phantom evaluation, which was limited in the magnitude of the parameters, which is a limitation resulting from the field of view of the original phantom acquisition. In practice, deviations larger than the ones applied here should easily be vis-ible during the initial orientation of the phantom using the CT system’s laser sight.
In conclusion, the algorithm presented here was able to correct misalignment of scanned sediment cores, enabling the use of CT images to support core sampling for further analysis. Future application of the algorithm as part of the automated quantitative analysis of image quality phantoms seems to be possible.
Availability of data and materials
The datasets used and/or analysed during the current study are available from the corresponding author upon reasonable request.
Funding
The imaging-based research presented in this work was not supported by third party funding.
preparation. WS was responsible for the study supervision, image acquisition (sediment cores and phantom), and manuscript editing and a major contributor to the study design and manuscript preparation. All authors read and approved the final manuscript.
Ethics approval and consent to participate Not applicable.
Consent for publication Not applicable.
Competing interests
SS has ownership interests in investment funds (ISIN IE00B4L5Y983, ISIN LU0328475792) containing stock of healthcare companies (e.g., of CT scanner systems manufacturers,i.e., Canon Medical Systems Corporation, GE Healthcare, Philips Healthcare, and Siemens Healthineers). GP joined Philips GmbH Market DACH after the completion of his work on this study. The rest of the authors declare that they have no competing interests.
Publisher’s Note
Springer Nature remains neutral with regard to jurisdictional claims in published maps and institutional affiliations.
Author details
1Diagnostic and Interventional Radiology (DIR), Heidelberg University
Hospital, Im Neuenheimer Feld 110, 69120 Heidelberg, Germany.2Institut für Geowissenschaften, J. W. Goethe-Universität, Frankfurt am Main, Germany. 3Institute of Earth Sciences, Ruprechts-Karls-Universität Heidelberg,
Heidelberg, Germany.
Received: 21 November 2018 Accepted: 7 February 2019
References
1. McCollough CH, Bruesewitz MR, McNitt-Gray MF et al (2004) The phantom portion of the American College of Radiology (ACR) computed tomography (CT) accreditation program: practical tips, artifact examples, and pitfalls to avoid. Med Phys 31:2423–2442
2. Titschack J, Baum D, De Pol-Holz R et al (2015) Aggradation and carbonate accumulation of Holocene Norwegian cold-water coral reefs.
Sedimentology 62:1873–1898
3. Titschack J, Fink HG, Baum D, Wienberg C, Hebbeln D, Freiwald A (2016) Mediterranean cold-water corals–an important regional carbonate factory? The Depositional Record 2:74–96
4. Bahr A, Albuquerque A, Ardenghi N et al (2016) South American hydrological balance and paleoceanography during the Late Pleistocene and Holocene (SAMBA)–cruise no. M125, march 21–April 15, 2016-Rio de Janeiro (Brazil)– Fortaleza (Brazil). METEOR-Berichte.https://doi.org/10.2312/cr_m125
5. Raddatz J, Liebetrau V, Trotter J et al (2016) Environmental constraints on Holocene cold-water coral reef growth off Norway: insights from a multiproxy approach. Paleoceanography 31:1350–1367
6. Raddatz J, Rüggeberg A, Liebetrau V et al (2014) Environmental boundary conditions of cold-water coral mound growth over the last 3 million years in the Porcupine Seabight, Northeast Atlantic. Deep Sea Res Part 2 Top Stud Oceanogr 99:227–236