DOI: 10.5958/2230-732X.2017.00062.6 ©2017 New Delhi Publishers. All rights reserved
ECONOMICS
Economic Efficiency of Pecan Nut Production: An Application
of Output Oriented DEA Model
Pawan Kumar Sharma
1and Sudhakar Dwivedi
2 1Krishi Vigyan Kendra, Kathua, SKUAST-Jammu, India2Division of Agricultural Economics & ABM, SKUAST-J, Main Campus, Chatha, Jammu (J&K), India
Corresponding author: [email protected]
Paper No. 607 Received: 24-5-2017 Accepted: 18-7-2017
ABSTRACT
The economics of pecan nut production in Poonch district of Jammu & Kashmir state was assessed using output oriented DEA model. The NPV and profitability index were positive and the internal rate of return (IRR) was 14% which shows that investing in pecan nut orchard will be a profitable venture until the market interest rate remain below 14%. The results of output oriented model revealed that growers were efficient in terms of pecan nut production at given level of inputs, with mean overall technical efficiency of 0.922, mean pure technical efficiency of 0.949 and mean scale efficiency of 0.972. The real output obtained was 40.65 quintals per acre which was 4.97% less than the optimum output (42.68 quintals/acre) at used level of inputs. Although, the difference in actual and targeted output was less, the percentage of farmers obtaining less than the optimum output was quite high i.e. 44%.
Highlights
• In Pecan nut production, the NPV and profitability index were positive. • Investing in pecan nut orchard will be a profitable venture.
• The percentage of farmers obtaining less than the optimum output was quite high. Keywords: Data envelopment analysis, economic efficiency, IRR, NPV, profitability index
Pecan nut is a large, beautiful tree that produces bountiful crops of delicious nuts. The largest member of the hickory family, pecan trees often grow to a height of over 70 feet with a spread of greater than 80 feet. Ares et al. (2006) studied production and economics of native pecan silvopastures in central United States and found that the nut crop had a pattern of biennial bearing with a mean tree age of 37 years and forage production varied between 1500 and 4600 kg DM ha-1. Ferencz and Notari (2010) found that the payback period was extremely long for canopy form; the SX spindle in Pecan nut orchard due to the high historical cost. The rate of returns was very unfavourable and low annual income determined weak profitability. Springer et al. (2011) determined that an irrigated improved
pecan orchard was economical and found that the improved pecan orchard is more profitable than competitive enterprises after a twenty-year time frame, but is sensitive to pecan price, pecan yield and attitude toward risk. Benucci et al. (2012) also studied mycorrhizal inoculation of pecan seedlings with some marketable truffles.
Poonch district with an annual production of 5 metric tonnes (Economic Survey of J&K, 2014-15). The present investigation was undertaken to analyse the economics of pecan nut production and to assess the economic efficiency using output oriented DEA model under intermediate hills of Poonch district of Jammu & Kashmir state of India.
MATERIALS AND METHODS
The district Poonch having maximum area under pecan nut in Jammu region of Jammu & Kashmir state was purposively selected for the present study. The cost, production and return data were collected for assessing capital investment, resource use and profitability index of pecan nut crop in the year 2014-15. A list of pecan nut growers in the Poonch district was procured from the office of Chief Horticulture Officer, Poonch and 50 farmers from the list were selected randomly without replacement for collecting the requisite data.
The Model
Data Envelopment Analysis (DEA) was first proposed by Charnes, Cooper and Rhodes (1978) as an evaluation tool to measure and compare the productivity of individual production unit. It constructs a non-parametric envelopment frontier over the data points such that all observed points lie on or below the production frontier. It provides the calculation of:
technical and scale efficiencies through CRS
(Charnes, Cooper and Rhodes; 1978) and VRS (Banker, Charnes and Cooper; 1978) and also of
cost and allocative efficiencies.
These can be either input oriented technical efficiency (TE) measure (by how much can input quantities be proportionally reduced without changing the output quantities produced) or output oriented technical efficiency (TE) measure (by how much can output quantities be proportionally expanded without altering the input quantities used.
Data Envelopment Analysis (Output oriented DEA model)
The values of technical efficiency in case of Constant Return to Scale or CCR model remains same in case of both input oriented and output oriented DEA.
The output oriented Variable Return to Scale or BCC model gives different results as compared to CCR model. The output oriented DEA model for technical efficient measure of output is presented as below:
0
.
Maxθ
Subject to,
0 1
0
j n
j i i j
x x λ
= − ≤
∑
1
0
n j j
λ =
=
∑
0
j λ ≥
Where,
θ0 = output maximizing vector of output quantities for farm ‘0’
yrj = Amount of output ‘r’ of firm ‘j’ xij = Amount of input ‘i’ used by firm ‘j’ λj = Weight factors in LP analysis
The output oriented measure of technical efficiency of the ith farm unit was estimated as,
*
1
i i
i i
y y
y =θy =θ
Calculation of allocative efficiency
The allocative efficiency signifies the use of inputs in the correct proportions reflecting their marginal costs. It focuses on the ability of an economic unit to minimize the cost of production for a given set of input prices by substituting or reallocating inputs and defined as the ratio of economic efficiency (cost efficiency) to the technical efficiency.
The economic efficiency has been estimated by employing cost minimization Data Envelopment Analysis (DEA) and using the prices of inputs. The linear programming form of this model has been presented as below:
0 0
. i i
Min Cθ
Subject to,
0 1
0
j n
p j p
j
y λ y
=
0 1
0
j n i j i
j x
θ λ
= −
∑
≥0
j λ ≥
Where,
Ci0 = vector of input prices for farm ‘0’
θi0 = cost minimizing vector of input quantities for farm ‘0’
Economic efficiency
The economic efficiency has been calculated as the ratio of minimum cost to observed cost, mentioned as below:
Economic efficiency = 0 0
0 0 i i
i i
C C x
θ
Scale efficiency
The scale efficiency considers the optimal size of the establishment to minimize long-run costs. This has been estimated as the ratio of technical efficiency of CCR to technical efficiency of BCC score, i.e.:
Scale efficiency = CCR
BCC
TE TE
The DEAP Version 2.1 of “The University of New England” was used to estimate economic efficiencies by conducting Data Envelopment Analysis.
Frequency distribution and categorization of
predicted efficiencies
The frequency distribution and binning of predicted cost efficiencies was done using Doane’s formula depicted as below:
( )
1
1
1 log log 1
g
g
k n
σ
= + + +
Where g1 = estimated 3rd moment skewness of the distribution and,
(
)
(
)(
)
1
6 2
1 3
g
n
n n
σ = −
+ +
This particular formula was applied for determining the number of bins as the predicted efficiencies was not found to be normally distributed.
The number of bins decided using Doane’s formula was then categorized using Singh’s cube root method (Singh, 1975) and the respondent farmers were divided into categories with low, medium and high level of efficiencies. The formula used for categorization has been presented as below:
1 1
1
3 i
i
N C
S L h
f
− −
= + ×
Where,
S1 = segment (e.g. I, II and III)
i = indicate category number (i=1, 2 and 3) L1 = lower limit of quartile class
Ci–1 = cumulative frequency of the class preceding to the quartile class
f = frequency
h = width of the quartile class
N = total cumulative cube root of frequencies
RESULTS AND DISCUSSION
6.37 quintals with minimum of 3.30 and maximum of 11.75 quintals per farm.
The average cost of land for sampled pecan nut orchards was ` 12,434 with minimum of ` 4,868 and maximum of ` 32,000. The average cost of pecan nut trees in sampled orchards was ` 121 with minimum of ` 60 and maximum of ` 230 per farm. The average cost of human labour under sampled orchards was
` 42,599 with minimum of ` 36,104 and maximum of ` 54,519. The estimated mean total cost of pecan nut production in sampled area over a period of 44 years was ` 5,94,704 with minimum of ` 2,58,438 and maximum of ` 14,64,598.
The capital appraisal of one acre of pecan nut for a period of 44 years was conducted and the same has been presented in Table 3. The pay-back period of pecan nut orchard was 21.14, 23.62 and 28.22 years at 8, 10 and 12 percent of discount rate respectively. The net present value was ` 42,40,141, ` 19,63,808 and ` 6,65,621 at at 8, 10 and 12 percent of discount rate respectively. At the same rate of 8, 10 and 12 percent of discount rate, the profitability index was
10.75, 5.52 and 2.53 respectively. The internal rate of return of pecan nut orchard was 14%.
Table 3: Capital appraisal of pecan nut orchard
Measures of
Investment Discount rate @ 8%
Discount rate @ 10%
Discount rate @ 12% Pay-back period
(years) 21.14 23.61 28.22
Net present value (`) 42,40,141 19,63,808 6,65,621 Profitability index 10.75 5.52 2.53
PI-1 9.75 4.52 1.53
Internal rate of return
(IRR) 14%
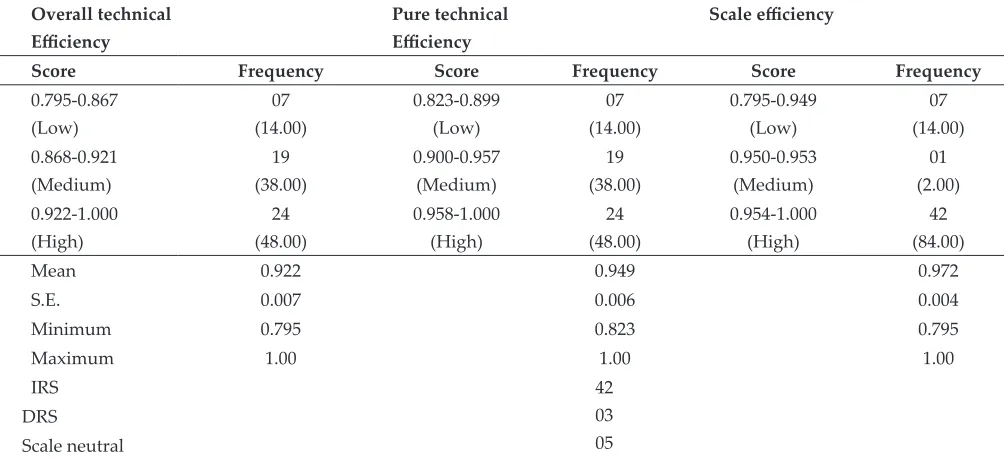
The estimated overall technical, pure technical and scale efficiencies of pecan nut production under output oriented model have been presented in Table 4. The mean overall technical efficiency under output oriented model was 0.922. The mean pure technical efficiency, however was 0.949 and the mean scale efficiency was 0.972. Four (8%), 42 (84%) and three (6%) farmers were operating under Table 1: Descriptive statistics of socio-economic characteristics (n = 50)
Particulars Unit Minimum Maximum Mean Variance
Qualitative socio-economic variables
Non-farm income No. (%) 23 (46.00)
Member of social organization No. (%) 03 (6.00)
Kisan credit card holders No. (%) 10 (20.00)
Quantitative socio-economic variables
Age years 33.00 68.00 51.34 8.64
Formal Education years 8.00 20.00 13.00 2.84
Land Holding acres 0.75 5.62 2.06 1.28
Table 2: Descriptive statistics of major inputs and output of Pecan nut
Particulars Unit Minimum Maximum Mean Variance
Descriptive statistics of quantity of inputs and output
Area under Pecan nut acres 0.62 3.50 1.57 0.41
No. of trees number 3.00 10.00 5.42 2.86
Human labour days 113.76 204.04 154.28 458.82
Yield quintals 3.30 11.75 6.37 3.80
Descriptive statistics of cost of inputs
Cost of land rupees 4,868 32,000 12434 6016
Cost of trees rupees 60 230 121 32
Cost of human labour rupees 36,104 54519 42599 4049
increasing returns to scale (IRS) and decreasing returns to scale (DRS) respectively. Five (10%) farmers were scale neutral.
The estimated output oriented efficiencies in pecan nut production has also been represented graphically through histograms (Fig. 1).
The BCC model helps us to identify optimum quantities of input use for a particular quantity of output. The Table 5 presented quantities of different inputs used excessively in per acre of pecan nut production. The actual use of human labour was 96.60 days whereas the targeted use was 93.82. Similarly, the actual use of land was 1 acre whereas targeted use was 0.84 and actual trees planted were
3.46 whereas the same output can be produced with 3.33 plants per acre.
Table 5: Excess use of inputs in pecan nut production (per acre)
Particulars Human labour (days)
Land (acres)
Plants (no.)
Actual use 96.60 1.00 3.46
Targeted use 93.82 0.84 3.33
Excess use % 2.97 18.51 3.80
Excess user farms % 22 22 22
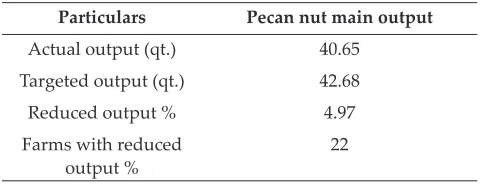
The real output obtained was 40.65 quintals and targeted output was 42.68 quintals per acre at used level of inputs. 22 (44%) farmers were obtaining less than the optimum output (Table 6).
Table 4: Frequency distribution of production efficiencies of pecan nut under output oriented DEA model (n=50)
Overall technical Efficiency
Pure technical Efficiency
Scale efficiency
Score Frequency Score Frequency Score Frequency
0.795-0.867 (Low)
07 (14.00)
0.823-0.899 (Low)
07 (14.00)
0.795-0.949 (Low)
07 (14.00) 0.868-0.921
(Medium)
19 (38.00)
0.900-0.957 (Medium)
19 (38.00)
0.950-0.953 (Medium)
01 (2.00) 0.922-1.000
(High)
24 (48.00)
0.958-1.000 (High)
24 (48.00)
0.954-1.000 (High)
42 (84.00)
Mean 0.922 0.949 0.972
S.E. 0.007 0.006 0.004
Minimum 0.795 0.823 0.795
Maximum 1.00 1.00 1.00
IRS 42
03 05 DRS
Scale neutral
Figures in parentheses indicate percentage
Table 6: Output targets for pecan nut production at prevailing level of input use (per acre)
Particulars Pecan nut main output
Actual output (qt.) 40.65
Targeted output (qt.) 42.68
Reduced output % 4.97
Farms with reduced
output % 22
REFERENCES
Ares, A., Reid, W. and Brauer, D. 2006. Production and economics of native pecan silvopastures in central United States. Agroforestry Systems, 66: 205-215.
Banker, R.D., Charnes, A. and Cooper, W.W. 1984. Some models for estimating technical and scale inefficiencies in data envelopment analysis. Management Science, 30: 1078-1092.
Benucci, G.M.N., Bonito, G., Falini, L.B., Bencivenga, M. and Donnini, D. 2012. Mycorrhizal inoculation of pecan seedlings with some marketable truffles. Acta Mycologica, 47(2): 179–184.
Charnes, A., Cooper, W. and Rhodes, E. 1978. Measuring the efficiency of decision-making units. European Journal of Operational Research, 3: 429-444.
Cooper, W.W., Seiford, L.M. and Tone, K. 2006. Introduction to DEA and its uses with DEA-Solver software and references. New York: Springer.
Doane, D.P. and Seward, L.E. 2011. Measuring Skewness: A Forgotten Statistic? Journal of Statistics Education,19(2): 1-17.
Economic Survey, 2014-15. Jammu & Kashmir, Directorate of Economics & Statistics, Planning and Development Department, Government of Jammu & Kashmir.
Ferencz, A. and Notari, M. 2010. Evaluation of organization and economics of regional apple orchard. Acta Technica Corviniensis-Bulletin of Engineering, 3(3): 121-123.
Singh, R. 1975. Optimum stratification for proportional allocation. SANKHYA,37: 109-115.