1 | P a g e
International Journal of Pharmaceutical
Development & Technology
e ISSN - 2248 - 910X
www.ijpdt.com
Print ISSN - 2248 - 9096PREPARATION AND EVALUATION OF SUSTAINED RELEASE (SR)
MATRIX TABLETS OF AZITHROMYCIN USING DIFFERENT
POLYMERS
Swathi D*, Umasankar K, Jayachandra Reddy P
Department of Pharmaceutics,
Krishna Teja Pharmacy College, Chadalawada Nagar, Tirupati-517605, Andhra Pradesh, India.
ABSTRACT
Azithromycin is an oral antibiotic used for the treatment of bactrerial infections. It belongs to the It is an azalide, a subclass of macrolide antibiotic. It is derived from erythromycin, with a methyl-substituted nitrogen atom incorporated into the lactone ring, thus making the lactone ring 15-membered. Azithromycin is somewhat more potent against certain bacterial species than erythromycin, but its widespread popularity arises primarily from its slow elimination from the body, which allows many infections to be treated with 3–5 days of once-daily administration, compared to 3-4 times a day for up to two weeks for erythromycin. The conventional dosage form such as tablets and capsules are the major oral preparations. Conventional dosage form have wide acceptance up to 50-60% of total dosage forms. Solid dosage forms are popular because of ease of administration, accurate dosage, self-medication, pain avoidance and most importantly the patient compliance in last two decades the drug delivery technology has been developed rapidly and many novel oral drug delivery systems have been invented.
Keywords: Azithromycin, Matrix Tablets, Sustained Release.
INTRODUCTION
The most commonly used method of modulating the drug release is to include it in a matrix system [1]. An effort was therefore made to develop simple and effective sustained-release Azithromycin tablets using a polymer matrix system. Hence, in the present study, an attempt has been made to develop the sustained-release matrix tablets of Azithromycin using hydrophilic polymer HPMC K4M, Gaur gum and carrageenan gumthe sustained pattern of it was evaluated by in-vitro drug release for 12 hours. The drug release data were plotted using various kinetic equations (zero-order, first-order, Higuchi’s kinetics, Korsmeyer’s equation, and Hixson-Crowell cube root law) to evaluate the drug release mechanism and kinetics [2].
Azithromycin
Fig: 1. Structure of Azithromycin
Empirical Formula: C38H72N2O12
Molecular weight: 749.984 Color: White
Half-life: 11-14 hr Bio Availability: 38%
Mechanism of Action
Azithromycin binds to the 50S subunit of the 70S bacterial ribosomes, and therefore inhibits RNA-dependent protein synthesis in bacterial cells [3].
Excipients Profile
The following are the different polymers and excipients used in this work.
Hypromellose
Hypromellose is a partly O-methylated and O-(2- hydroxypropylated) cellulose.
Synonyms: Benecel MHPC, Hydroxypropylmethylcellulose (HPMC), Methocel, Metolose, Tylopur.
Description: Odorless and tasteless, white or creamy-white fibrous or granular powder.
Grade: Methocel K100 Premium LVEP, Methocel K4M, K15M, K100M, Metolose 60SH, 65SH, 90SH.
2 | P a g e
Stability: Stable material, although it is hygroscopic after drying.
Acidity/alkalinity: pH = 5.5–8.0 for a 1% w/w aqueous solution
Density (true): 1.326 g/cm3
Melting point: Browns at 190–200°C; chars at 225–230°C. Glass transition temperature is 170–180°C.
Viscosity: Ranges from 3-100000 (mPa s), Methocel K100M (100000 mPa s), Methocel K15M (15000 mPa s), Methocel K4M (4000 mPa s).
Safety: Non-toxic and non-irritant material, although excessive oral consumption may have a laxative effect. Uses: As a tablet binder (2% - 5% w/w), Matrix former (10% - 80% w/w), Thickening agent (0.45% - 1% w/w).
It is also used as an emulsifier, suspending agent, and stabilizing agent in topical gels and ointments matrix former, mucoadhesive polymer as effective thickener [4].
Microcrystalline cellulose
Microcrystalline cellulose is purified, partially depolymerized cellulose.
Synonyms: Avicel PH, Celex, cellulose gel, Celphere, Ceolus KG, Crystalline cellulose, E460, Emcocel, Ethispheres, Fibrocel, Pharmacel, Tabulose, Vivapur. Description: It occurs as a white, odorless, tasteless, crystalline powder composed of porous particles.
Grades: Avicel PH-101, PH-102, PH-103, Emcocel 50M, 90M, Vivapur101, 102.
Functional Category: Adsorbent; suspending agent; tablet and capsule diluent; Tablet disintegrant.
Solubility: Slightly soluble in 5% w/v sodium hydroxide solution; practically insoluble in water, dilute acids, and most organic solvents.
Melting point: Chars at 260-270°C.
Stability and Storage: It is a stable though hygroscopic material. The bulk material should be stored in a well-closed container in a cool, dry place.
Safety: It isa relatively nontoxic and nonirritant material. Uses: It is widely used as a diluent (20 – 90 %w/w), As a tablet disintegrant (5-15% w/w), It can be used as an adsorbent, antiadherent (20-90%w/w) [5].
Talc
Talc is a purified, hydrated, magnesium silicate. Synonyms: Altalc; E553 b; Hydrous magnesium calcium silicate; Hydrous Magnesium silicate; Luzenac Pharma; Magnesium hydrogen metasilicate; Magsil Osmanthus; Magsil Star; Powdered talc; Purified French chalk; Purtalc; Soapstone; Steatite; Superiore.
Description: Talc is a very fine, white to grayish-white, odorless, Impalpable unctuous, crystalline powder. It adheres readily to the skin and is soft to the touch and free from grittiness.
Functional Category: Anticaking agent; glidant; tablet and capsule diluent; tablet and capsule lubricant.
Solubility: Practically insoluble in dilute acids and alkalis, organic solvents and water.
Stability and Storage: Talc is a stable material and may be sterilized by heating at 160°C for not less than 1 hour. It may also be sterilized by exposure to ethylene oxide or gamma irradiation. It should be stored in well closed container in a cool, dry place.
Safety: Talc is used mainly in tablet and capsule formulations. It is not absorbed systemically following oral ingestion and is therefore regarded as an essentially nontoxic material. However, intranasal or intravenous abuse of products containing talc can cause granulomas in body tissues, particularly the lungs. Contamination of wounds or body cavities with talc may also cause granuloma therefore, it should not be used to dust surgical gloves. Inhalation of talc causes irritation and may cause severe respiratory distress in infants.
Incompatibilities: Incompatible with quaternary ammonium compounds.
Uses: Talc can be used in oral solid dosage formulations as a Lubricant diluent. However, it is widely used as a dissolution retardant in the development of controlled-release products. It is also used as a lubricant in tablet formulations; in a novel powder coating for extended-release pellets; and as an adsorbent. In topical preparations, talc is used as a dusting powder, although it should not be used to dust surgical gloves. Talc is additionally used to clarify liquids and is also used in cosmetics and food products, mainly for its lubricant properties [6].
Magnesium Stearate
Synonyms: Magnesium octadecanoate; Octadecanoic acid, Magnesium salt; stearic acid, magnesium salt.
Functional Category: Tablet and capsule lubricant. Description: It is a very fine, light white, precipitated or milled, impalpable of low bulk density, having a faint odor of stearic acid and a characteristic taste. The powder is greasy to the touch and readily adheres to the skin.
Flowability: Poorly flowing, cohesive powder.
Melting range: 117–150°C (commercial samples); 126– 130°C (high purity magnesium stearate).
Solubility: Practically insoluble in ethanol, ethanol (95%), ether and water, slightly soluble in warm benzene and warm ethanol (95%).
Stability and Storage: It is stable and should be stored in a well-closed container in a cool dry place.
Incompatibilities: Incompatible with strong acids, alkalis, and iron salts. Avoid mixing with strong oxidizing materials. It cannot be used in products containing aspirin, some vitamins, and most alkaloidal salts.
Safety: Nontoxic following oral administration. However, oral Consumption of large quantities may produce a laxative effect or Mucosal irritation.
3 | P a g e
lubricant in capsule and tablet manufacture at concentrations between 0.25% and 5.0% w/w [7].
MATERIALS AND METHOFS
Construction of Standard Graph of Azithromycin Accurately weighed amount of 100 mg of Azithromycin was transferred into a 100 ml volumetric flask. Methanol was added to dissolve the drug and the primary stock solution was made by adding 100 ml of methanol. This gives a solution having concentration of 1 mg/ml of Azithromycin stock solution. From this primary stock 10 ml was transferred in to another volumetric flask and made up to 100 ml with 6.8 pH phosphate buffer and this gives secondary stock solution. From this secondary stock 0.2, 0.4, 0.6, 0.8 and 1mL was taken separately and made up to 10 ml with 0.1N HCl and 6.8 pH phosphate buffer seperately. The absorbance was measured at 210 nm using a UV spectrophotometer (Systronic, Hyderabad, India).
Preparation of 0.1N HCl
A 8.65 ml of Conc. HCl was placed in a 1000 ml volumetric flask and the volume was made up with water and pH was adjusted to 1.2.
Preparation of Standard Solution Azithromycin
Accurately weighed 100mg of Azithromycin was placed in a 100mL volumetric flask and 50mL of 0.1 N HCl was added to dissolve the drug. The volume was made up to 100mL HCl to give 1000 μg/mL of solution (stock solution -I). A 10mL aliquot from stock solution -I was taken and diluted to 100mL with in a volumetric flask to get 100μg/mL (stock solution -II). Aliquotes of 0.2, 0.4, 0.6, 0.8 and 1mL of Azithromycin standard solution of 100mcg/ml (stock solution-II) was taken and diluted to 10ml to obtain concentrations from 2 to 10μg/mL with 0.1 N HCl. The absorbance of solutions was determined at 210nm against respective media solutions as blank and a standard curve was plotted.
Preparation of pH 6.8 phosphate buffer
Accurately measured 50 ml of 0.2 M potassium dihydrogen orthophosphate was transferred to a 200ml volumetric flask and 22.4 ml of 0.2 M sodium hydroxide was added to it. Volume was made up to 200 ml with distilled water, mixed and pH was adjusted to 6.8 with 0.2 M sodium hydroxide or 0.2 M othophosphoric acid. Preparation of 0.2 M potassium dihydrogen phosphate solution
Accurately weighed 27.218 g of monobasic potassium dihydrogen phosphate was dissolved in 1000 ml of distilled water and mixed.
Preparation of 0.2 M sodium hydroxide solution
Accurately weighed 8 g of sodium hydroxide pellets were dissolved in 1000 ml of distilled water and mixed.
Preparation of Azithromycin Matrix Tablets
All the matrix tablets, each containing 5 mg of Azithromycin, were prepared by direct compression
method and also to study the effect of various ratios of different types of polymers on the drug release (Table 1).
Formulations
In formulations prepared, the release retardants included were Hydroxypropylmethylcellulose (HPMCK4M), Guar gum and Ca.Drug polymer ratios were 1:1, 1:2 and combination for all batches. Microcrystalline cellulose (MCC) was used as diluents. Magnesium stearate (MS) 1% and talc 2 % were used as lubricants.
Evaluation of Precompression Blend a) Angle of Repose
The angle of repose of precompression blend was determined by the funnel-method. The accurately weighed blend was taken in a funnel. The height of the funnel was adjusted in such a manner that the tip of the funnel just touched the apex of the heap of the powder blend. The powder blend was allowed to flow through the funnel freely onto the surface. The diameter of the powder cone measured and angle of repose was calculated using the following equation [8].
tan θ = h/r
where, h and r are the height and radius of the powder cone, θ is the angle of repose (Table 2).
b) Determination of Bulk Density and Tapped Density An accurately weighed quantity of the granules/ powder (W) was carefully poured into the graduated cylinder and volume (V0) was measured. Then the
graduated cylinder was closed with lid and set into the tap density tester (USP). The density apparatus was set for 500 tabs and after that the volume (Vf) was measured and
continued operation till the two consecutive readings were equal. The bulk density and the tapped density were calculated using the following formulae [2].
Bulk density = W/V0
Tapped density = W/Vf
where, W= Weight of the powder; V0 = Initial volume;
Vf = final volume
c) Compressibility Index (Carr’s Index)
Carr’s index (CI) is an important measure that can be obtained from the bulk and tapped densities. In theory, the less compressible a material the more flowable it is (Table 3).
CI = (TD-BD) x 100/TD
where, TD is the tapped density and BD is the bulk density.
d) Hausner’s Ratio
4 | P a g e
properties. Generally a value less than 1.25 indicates good flow properties, which is equivalent to 20% of Carr’s index
Hausner’s Ratio= Tapped density/ Bulk density
Evaluation of Matrix Tablets i) Thickness
Twenty tablets from the representative sample were randomly taken and individual table thickness was measured by using vernier caliper. Average thickness and standard deviation values were calculated.
ii) Hardness
Tablet hardness was measured by using Monsanto hardness tester. From each batch six tablets were measured for the hardness and average of six values was noted along with standard deviations.
iii) Friability Test
From each batch, ten tablets were accurately weighed and placed in the friability test apparatus (Roche friabilator). Apparatus was operated at 25 rpm for 4 minutes and tablets were observed while rotating. The tablets were then taken after 100 rotations, dedusted and reweighed. The friability was calculated as the percentage weight loss.
Note: No tablet should stick to the walls of the apparatus. If
so, brush the walls with talcum powder. There should be no capping also. %Friability was calculated as follows
% Friability = (W1 – W2) x 100/W1
where W1 = Initial weight of the 20 tablets
W2 = Final weight of the 20 tablets after testing.
Friability values below 0.8% are generally acceptable.
iv) Weight Variation Test
To study weight variation individual weights (WI)
of 20 tablets from each formulation were noted using electronic balance. Their average weight (WA) was
calculated. Percent weight variation was calculated as follows. Average weights of the tablets along with standard deviation values were calculated.
% weight variation = (WA–WI) x 100/ WA
As the total tablet weight was 250 mg, according to IP 1996, out of twenty tablets ±7.5 % variation can be allowed for not more than two tablets. According to USP 2004, ±10% weight variation can be allowed for not more than two tablets out of twenty tablets.
v) Drug Content (Assay)
The drug content of the matrix tablets was determined according to in-house standards and it meets the requirements if the amount of the active ingredient in each of the 3 tested tablets lies within the range of 90% to 110%
of the standard amount. Three tablets were weighed and taken into a mortar and crushed into fine powder. An accurately weighed portion of the powder equivalent to average weight of three tablets of Azithromycin was transferred to a 100 ml volumetric flask containing 6.8 pH Phosphte buffer solution and the volume was made upto the mark. From this 10ml was taken and shaken by mechanical means using centrifuge at 3000rpm for 30min. Then it was filtered through whatman filter paper. From this resulted solution 1 ml was taken, diluted to 10 ml with 6.8 pH Phosphate buffer solution and absorbance was measured against blank at 210 nm.
vi) In -vitro Drug Release Characteristics
Drug release was assessed by dissolution test under the following conditions: n = 3, USP type II dissolution apparatus (paddle method) at 50 rpm in 900 ml of and the phosphate buffer pH 6.8 upto 24 hours and temperature was maintained at 37°C ± 0.5°C. An aliquot (5mL) was withdrawn at specific time intervals and replaced with the same volume of prewarmed (37°C ± 0.5°C) fresh dissolution medium. And drug content in each sample was analyzed by UV-visible spectrophotometer at 210 nm [3].
vii) Kinetic Analysis of Dissolution Data
To analyze the in vitro release data various kinetic models were used to describe the release kinetics. The zero order rate Eq. (1) describes the systems where the drug release rate is independent of its concentration. The first order Eq. (2) describes the release from system where release rate is concentration dependent (Bourne, 2002). Higuchi (1963) described the release of drugs from insoluble matrix as a square root of time dependent process based on Fickian diffusion Eq. (3). The Hixson-Crowell cube root law Eq. (4) describes the release from systems where there is a change in surface area and diameter of particles or tablets.
C = K0t (1)
where, K0 is zero-order rate constant expressed in units of
concentration/time and t is the time.
LogC = LogC0 - K1 t / 2.303 (2)
where, C0 is the initial concentration of drug and K1 is first
order constant.
Q = KHt1/2 (3)
where, KH is the constant reflecting the design variables of
the system.
Q01/3 – Qt1/3 = KHC t (4)
where, Qt is the amount of drug remained in time t, Q0 is the
initial amount of the drug in tablet and KHC is the rate
constant for Hixson-Crowell rate equation.
The following plots were made using the in-vitro drug release data
5 | P a g e
2. Log cumulative of % drug remaining vs. time (First order kinetic model);
3. Cumulative % drug release vs. square root of time (Higuchi model);
4. And cube root of initial concentration minus the cube root of percentage of drug remaining in the matrix vs. time (Hixson-Crowell cube root law).
viii) Mechanism of drug release
Korsmeyer derived a simple relationship which described drug release from a polymeric system Eq. (5). To find out the mechanism of drug release, first 60% drug release data was fitted in Korsmeyer–Peppas model.
Mt / M∞ = Ktn (5)
where Mt / M∞ is fraction of drug released at time t, K is
the release rate constant incorporating structural and geometric characteristics of the tablet, and n is the release exponent. The n value is used to characterize different release mechanisms.
A plot of log cumulative % drug release vs. log time was made. Slope of the line was n. The n value is used to characterize different release mechanisms as given in Table11, for the cylindrical shaped matrices. Case-II generally refers to the erosion of the polymeric chain and anomalous transport (Non-Fickian) refers to a combination of both diffusion and erosion controlled-drug release.
ix) Similarity Factor (f2) Analysis
In vitro release profiles of the selected batches (F12 and F21) of sustained release tablets were compared with the theoretical release profile which was calculated earlier. The data were analyzed by the following formula.
f2 = 50 log {[1+ (1/N) ∑ (Ri – Ti)2 ]-0.5 x 100}
where N = number of time points, Ri and Ti = dissolution of reference and test products at time i. If f2 is greater than
50 it is considered that 2 products share similar drug release behaviors.
x) Mean Dissolution Time
The other dissolution parameter used for comparing the formulations was mean dissolution time (MDT).This is calculated from the amount of drug released to the total cumulative drug. MDT is a measure of the rate of the dissolution process: the higher the MDT, the slower the release rate. The following equation was used to calculate the MDT from the mean dissolution data.
Where i is the dissolution sample number, n is the number of dissolution sample time, t mid is the time at the midpoint
between i and i-1 and ∆M is the additional amount of drug dissolved between i and i-1.
xi) Swelling and Erosion Studies
Swelling and eroding behavior was determined by a method similar to that reported by Avachat and Vikram. The dissolution jars were marked with the time points of 0.5, 1, 2, 3, 4, 6, 8, and 12 hours. One tablet was placed in each dissolution jar containing 900 ml of phosphate buffer pH 6.8 at 37 °C ± 0.5 °C, and the apparatus was run at 50 rpm using paddle. The tablets were taken out after completion of the respected stipulated time span as mentioned above and weighed after the excess of water at the surface had been removed with filter paper. The wetted samples were then dried in an oven at 40 °C up to constant weight. The increase of the weight on the tablet reflects the weight of the liquid uptake. It was estimated according to following equation.
Q = 100(Ww – Wi) / Wi
where Q is the percentage swelling, and Ww and Wi are the masses of the hydrated samples before drying and the initial starting dry weight, respectively.
The degree of erosion (expressed as percentage erosion of the polymer content, E) was determined using following equation.
E = 100(Wi – Wf) / Wi
where Wf is the final mass of the same dried and partially
eroded sample.
xi) Fourier Transform Infrared Spectroscopy (FTIR) Studies
FTIR studies were performed on drug and the optimized formulation using Shimadzu FTIR (Shimadzu Corp., India). The samples were analyzed between wavenumbers 4000 and 400 cm-1.
6 | P a g e
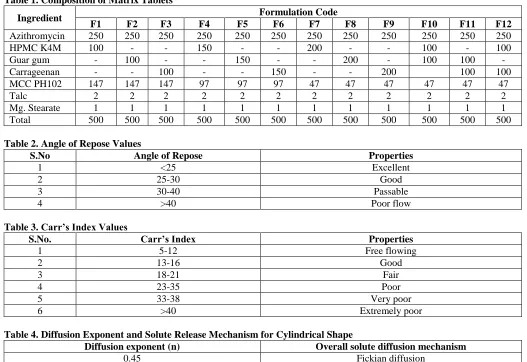
Table 1. Composition of Matrix Tablets
Ingredient Formulation Code
F1 F2 F3 F4 F5 F6 F7 F8 F9 F10 F11 F12
Azithromycin 250 250 250 250 250 250 250 250 250 250 250 250
HPMC K4M 100 - - 150 - - 200 - - 100 - 100
Guar gum - 100 - - 150 - - 200 - 100 100 -
Carrageenan - - 100 - - 150 - - 200 100 100
MCC PH102 147 147 147 97 97 97 47 47 47 47 47 47
Talc 2 2 2 2 2 2 2 2 2 2 2 2
Mg. Stearate 1 1 1 1 1 1 1 1 1 1 1 1
Total 500 500 500 500 500 500 500 500 500 500 500 500
Table 2. Angle of Repose Values
S.No Angle of Repose Properties
1 <25 Excellent
2 25-30 Good
3 30-40 Passable
4 >40 Poor flow
Table 3. Carr’s Index Values
S.No. Carr’s Index Properties
1 5-12 Free flowing
2 13-16 Good
3 18-21 Fair
4 23-35 Poor
5 33-38 Very poor
6 >40 Extremely poor
Table 4. Diffusion Exponent and Solute Release Mechanism for Cylindrical Shape
Diffusion exponent (n) Overall solute diffusion mechanism
0.45 Fickian diffusion
0.45 < n < 0.89 Anomalous (non-Fickian) diffusion
0.89 Case-II transport
n > 0.89 Super case-II transport
RESULTS AND DISCUSSION
Table 5. Physical and chemical characteristics
Description Specifications Observations
Appearance White Crystalline powder White
Identification FTIR Complies
Assay Not less than 90.0% w/w and not more than 110.0% w/w of Venlafaxine 99.97%w/w
Table 6. Calibration Curve of Azithromycin
Concentration (µg/mL) Absorbance
0 0
1 0.188
2 0.378
4 0.556
6 0.748
8 0.952
Table 7. Calibration Curve of Azithromycin in 6.8pH
Concentration(µg/mL) Absorbance
7 | P a g e
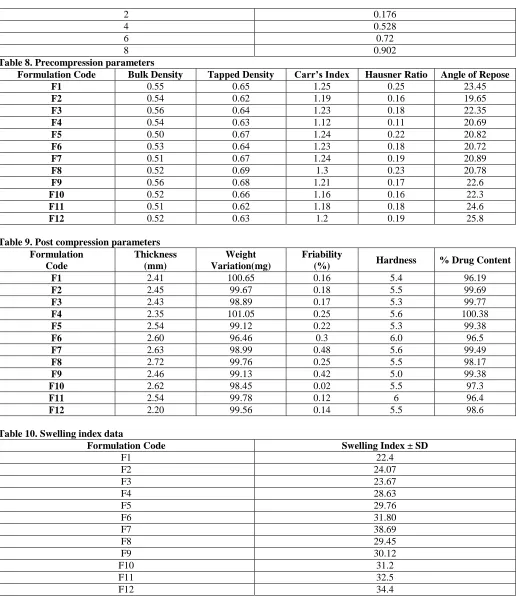
2 0.176
4 0.528
6 0.72
8 0.902
Table 8. Precompression parameters
Formulation Code Bulk Density Tapped Density Carr’s Index Hausner Ratio Angle of Repose
F1 0.55 0.65 1.25 0.25 23.45
F2 0.54 0.62 1.19 0.16 19.65
F3 0.56 0.64 1.23 0.18 22.35
F4 0.54 0.63 1.12 0.11 20.69
F5 0.50 0.67 1.24 0.22 20.82
F6 0.53 0.64 1.23 0.18 20.72
F7 0.51 0.67 1.24 0.19 20.89
F8 0.52 0.69 1.3 0.23 20.78
F9 0.56 0.68 1.21 0.17 22.6
F10 0.52 0.66 1.16 0.16 22.3
F11 0.51 0.62 1.18 0.18 24.6
F12 0.52 0.63 1.2 0.19 25.8
Table 9. Post compression parameters Formulation
Code
Thickness (mm)
Weight Variation(mg)
Friability
(%) Hardness % Drug Content
F1 2.41 100.65 0.16 5.4 96.19
F2 2.45 99.67 0.18 5.5 99.69
F3 2.43 98.89 0.17 5.3 99.77
F4 2.35 101.05 0.25 5.6 100.38
F5 2.54 99.12 0.22 5.3 99.38
F6 2.60 96.46 0.3 6.0 96.5
F7 2.63 98.99 0.48 5.6 99.49
F8 2.72 99.76 0.25 5.5 98.17
F9 2.46 99.13 0.42 5.0 99.38
F10 2.62 98.45 0.02 5.5 97.3
F11 2.54 99.78 0.12 6 96.4
F12 2.20 99.56 0.14 5.5 98.6
Table 10. Swelling index data
Formulation Code Swelling Index ± SD
F1 22.4
F2 24.07
F3 23.67
F4 28.63
F5 29.76
F6 31.80
F7 38.69
F8 29.45
F9 30.12
F10 31.2
F11 32.5
F12 34.4
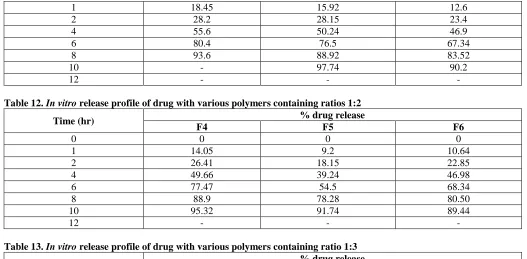
Table 11. In vitro release profile of drug with various polymers containing ratio 1:1
Time (hr) % drug release
F1 F2 F3
8 | P a g e
1 18.45 15.92 12.6
2 28.2 28.15 23.4
4 55.6 50.24 46.9
6 80.4 76.5 67.34
8 93.6 88.92 83.52
10 - 97.74 90.2
12 - - -
Table 12. In vitro release profile of drug with various polymers containing ratios 1:2
Time (hr) % drug release
F4 F5 F6
0 0 0 0
1 14.05 9.2 10.64
2 26.41 18.15 22.85
4 49.66 39.24 46.98
6 77.47 54.5 68.34
8 88.9 78.28 80.50
10 95.32 91.74 89.44
12 - - -
Table 13. In vitro release profile of drug with various polymers containing ratio 1:3
Time (hr) % drug release
F7 F8 F9
0 0 0 0
1 14.25 8.56 6.45
2 22.10 15.50 12.40
4 49.60 28.24 26.92
6 70.02 49.76 48.34
8 82.65 68.80 64.52
10 98.9 76.52 78.3
12 - 96.2 92.4
Table 14. In vitro release profile of drug with various polymers containing ratio 1:1
Time (hr) % drug release
F10 F11 F12
0 0 0 0
1 8.5 10.6 12.6
2 26.7 19.8 24.8
4 55.8 46.4 52.4
6 69.3 60.8 66.9
8 78.4 72.6 78.4
10 90.4 85.3 87.6
12 98.4 91.2 95.3
Table 15. Kinetic Analysis of Dissolution Data
Formulation Code Mathematical models (Kinetics)
Zero order First order Higuchi Peppas model
r2 r2 r2 N r2
F5 0.942 0.900 0.965 0.94 0.943
9 | P a g e
Fig: 2. Calibration Curve of Azithromycin Fig: 3. Calibration Curve of Azithromycin in 6.8pH
Fig: 4. In vitro release profile of drug with various polymers containing ratio 1:1
Fig: 5. In vitro release profile of drug with various polymers containing ratios 1:2
Fig: 6. In vitro release profile of drug with various polymers containing ratio 1:3
10 | P a g e
Fig: 8. FTIR Spectra for Azithromycin
DISCUSSION
The present investigation was under taken to formulate and Sustained release tablets of Azithromycin.
Sustain release Tablets
Using various polymers like HPMC K4M, Guar gum and Carrageenan tablets were prepared along with other additives. Wet granulation method was used for the preparation of tablets. A total number of 12 formulations were prepared and evaluated. To retain tablet for long period, most of the excipients selected must be water soluble by nature. This excipient was used a bulking agent to achieve the desired tablet weight. Talc was employed as a lubricant and megnisium stearate used as glidant.
Pre compressional studies
The results obtained by evaluating the powder blends of drug and excipients are shown in table no ???Bulk density and tapped density were found in the range 0.52-0.56 g/cc and 0.62-0.69 g/cc respectively. The value of hausner’s ratio was in between 1.16-1.25 (< 1.3) indicating that all batches of powder blends were having good compressibility. Values of angle of repose (θ) was found in the range of 19.65-25.8 showing that blend of powder mass was Good flowing.
Weight variation and Thickness
The average weight in all the 9formulations was found to be 96.7mg to 101.3 mg. In all 15 formulations no tablets were outside the ±10%of tablet weight in weight variation test. The thickness varies between 2.4 to 2.72mm. In all formulations tablet thickness of all formulations was within ±5% of standard value. Friability values were less
than 1% in all cases. Hardness of all the tablets was maintained at 5 to 6 kg/cm2 for all the formulations. Assay was performed and percent drug content of all the tablets were found to be between 96.5 % and 100.38% of Azithromycin, which was within the acceptable limits
In vitro dissolution
In vitro dissolution studies are performed for
Sustained tablets of Azithromycin mixture of solvent 0.1N HCl using USP dissolution apparatus type 2. The dissolution rate was found to increase linearly with increasing concentration of polymer. The optimized formulations are HPMC K15M with HPMC K4M combination containing tablets (F10).Formulation have recorded drug 98.6 respectively in 12 hrs.
Drug Release Kinetics
In vitro drug release data of all the Sustained
11 | P a g e
This data reveals that drug release follows non-Fickian diffusion mechanism Higuchi model.
CONCLUSION
SuccessoftheInvitrodrugreleasestudiesrecommends theproductforfurtherin vivo studies, which may improve patient compliance. From the results, formulationF6 containing Azithromycin 5 mg, HPMC (K4M) 5 mg and
Guar gum5mg evolved as the optimized formulation and it releases more than 98% drug in 12hrs. IR spectroscopic studies indicated that there are no drug-excipient interactions in the optimized formulation. The optimized formulation F6 can be considered as a promising Sustained drug delivery system of Azithromycin providing nearly zero order drug release over a period of 12 hrs.
REFERENCES
1. Barra J, Somma R. Influence of the physicochemical variability of magnesium stearate on its lubricant properties: possible solutions. Drug DevInd Pharm., 22(11), 1996, 1105-1120.
2. Marwaha SB, Rubinstein MH. Structure-lubricity evaluation of magnesium stearate. Int J Pharm., 43(3), 1988, 249-255. 3. Mason WD, Winer N. Kinetics of aspirin, salicylic acid and salicyluric acid following oral administration of aspirin as a
tablet and two buffered solutions. J Pharm. Sci., 70(3), 1981, 262-265.
4. Okoye P, Wu SH. Lubrication of direct-compressible blends with magnesium stearate monohydrate and dihydrate. Pharm.
Techno., 31(9), 2007, 116-129.
5. Rao KP et al. Impact of solid-state properties on lubrication efficacy of magnesium stearate. Pharm. Dev Technol., 10(3), 2005, 423-437.
6. Steffens KJ, Koglin J. The magnesium stearate problem. Manuf. Chem., 64(12), 1993, 16-19.
7. Billany MR, Richards JH. Batch variation of magnesium stearate and its effect on the dissolution rate of salicylic acid from solid dosage forms. Drug DevInd Pharm., 8, 1982, 497-511.