Int. J. Data Envelopment Analysis (ISSN 2345-458X)
Vol.7, No.4, Year 2019 Article ID IJDEA-00422, 12 pages Research Article
A Data Envelopment Analysis Model with
Triangular Intuitionistic Fuzzy Numbers
S. A. Edalatpanah*
Department of Industrial Engineering, Ayandegan Institute of Higher Education, Iran
Received 03 April 2019, Accepted 20 October 2019
Abstract
DEA (Data Envelopment Analysis) is a technique for evaluating the relative effectiveness of decision-making units (DMU) with multiple inputs and outputs data based on non-parametric modeling using mathematical programming (including linear programming, multi-parameter programming, stochastic programming, etc.). The classical DEA methods are developed to handle the information in the form of a crisp number but have no capability in dealing with fuzzy information like triangular intuitionistic fuzzy numbers (TIFNs), which is flexible in reflecting the uncertainty and hesitation associated with the decision-makers’ opinion. In this paper, an extended model of DEA is proposed under the triangular intuitionistic fuzzy environment where the inputs and outputs of DMUs are TIFNs. At first, the definition and characteristics of a classical model of DEA and the comparative TIFNs are introduced. In addition, a new ranking function considering the interaction between membership and non-membership values of different intuitionistic fuzzy sets are defined. Then, the triangular intuitionistic DEA model and a new strategy to solve it is proposed. Finally, the new approach is illustrated with the help of a numerical example.
Keywords: Data envelopment analysis, Efficiency, Intuitionistic fuzzy numbers, Ranking.
*. Corresponding author: Email: [email protected]
1. Introduction
The efficiency evaluation of every system is important to find its weakness so that subsequent improvements can be made. Data envelopment analysis (DEA) is a mathematical technique to evaluate the relative efficiency of a set of some homogeneous units called decision-making units (DMUs) that use multiple inputs to produce multiple outputs. DMUs are called homogeneous because they all employ the same inputs to produce the same outputs. DEA by constructing an efficiency frontier measures the relative efficiency of decision-making units (DMUs). Charnes et al. [1] developed a DEA model (CCR) based on the seminal work of Farrell [2] under the assumption of constant returns to scale (CRS). Banker et al. [3] extended the pioneering work Charnes et al. [1] and proposed a model conventionally called BCC to measure the relative efficiency under the assumption of variable returns to scale (VRS). DEA technique has just been effectively connected in various cases such as broadcasting companies [4], banking institutions [5-8], R&D organizations [9-10], health care services [11-12], manufacturing [13-14],
telecommuni-cation [15], and supply chain
management [16-19]. However, the classical DEA methods are limited to deal with the decision information in the format of the crisp number, and unable to handle uncertainty and imprecision information. Due to the estimation inaccuracies, knowledge deficiency and data unavailability in practical problems, DMs’ preferences are usually presented in fuzziness and may exist some hesitations. Zadeh [20] first proposed the theory of fuzzy sets (FSs) against certain logic where the membership degree is a real number between zero and one. After this work, many researchers studied this topic; details of some researches can be observed in [21-30].
The use of this theory in DEA can be
traced to Sengupta [31]. According to Hatami Marbini, Emrouznejad, and Tavana [32], DEA approaches using fuzzy theory can be classified into four primary categories: (a) parametric approaches that convert a fuzzy DEA model into a parametric model depending on a parameter α level [33-36]; (b) possibility approaches that represent
fuzzy variables by probability
distributions [37-38]; (c) ranking approaches, with the main objective of designing a fuzzy DEA model able to yield fuzzy efficiencies that can be ranked using different methods [39]; and (d) defuzzification approaches that try to first convert fuzzy values of inputs and outputs into crisp values then to solve the resulting DEA crisp model [40]. Many other approaches have also been introduced to fuzzy DEA development [41-50].
Although the traditional fuzzy theory provides a powerful framework to characterize vagueness and uncertainty, it ignores the hesitation of DMs in the decision-making process. Also, this theory cannot deal with certain cases in which it is difficult to define the membership degree using one specific value. To overcome this lack of knowledge, Atanassov [51] extended the traditional fuzzy set in 1986 to the intuitionistic fuzzy set (IFS) which simultaneously considers the degrees of membership and non-membership with hesitation index. Generally, the DEA models described with intuitionistic fuzzy numbers are more exquisite than those with fuzzy numbers.
Although the theory of IFS has been used extensively in decision-making problems, there are not many studies that have incorporated IFS to handle uncertainty or vagueness in DEA.
49
TOPSIS and DEA to select the units with the most efficiency. First, the alternative evaluation problem is formulated by DEA and separately formulates each pair of units. In the second stage, he used the opinion of experts to be applied to a model of group Decision-Making called the Intuitionistic Fuzzy TOPSIS method. Gandotra et al. [53] proposed an algorithm to rank DMUs in the presence of intuitionistic fuzzy weighted entropy. Hajiagha et al. [54] developed a DEA model when input/output data was expressed in the form of IFS. They further extended the model to the case of a weighted aggregated operator for IFS. Puri and Yadav [55] developed optimistic and pessimistic DEA models under intuitionistic fuzzy input data. They also presented the application of their proposed models through a case from the banking sector in India where some of the inputs were represented as triangular intuitionistic fuzzy numbers in the form of A
a a a a a al, m, u; l, m, u
.Although these approaches are
interesting, however, some limitations exist. One limitation is that the proposed approaches appear time-consuming, especially when many input and output sets are employed or when the number of DMUs under evaluation is important. So, in this paper, we design a new model of DEA with triangular intuitionistic fuzzy numbers with a different form of [55-57] and establish a new strategy to solve it. The proposed method is based on the ranking function and has a simple structure.
The remainder of the paper is organized as follows: In Section 2, the basic concepts of TIFNs and comparative methods are explained. The classical DEA method is reviewed in Section 3. In Section 4, some new ranking functions
are established. In Section 5, an extended CCR model is proposed to handle efficiency problems under the TIFNs environment. In Section 6, a numerical study is given to illustrate the validity and practicality of the proposed method. Finally, some concluding remarks are drawn in Section 7.
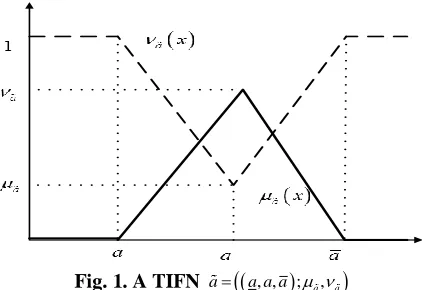
2. TINFs and the comparison method Definition 1 [58-59]. A TIFN
, , ; a, a
a a a a is a special IFS on a real number set R, its membership function is defined as follow:
, if
if
, if
0, if or
a
a a
a
x a
a x a
a a
x a
x
a x
a x a
a a
x a x a
,
(1)
And its non-membership function can be defined as:
, if
if
, if
1, if or
a a
a
a
a x x a
a x a
a a
x a
x
x a a x
a x a
a a
x a x a
,
(2)
Where a and a are the maximal
membership degree and the minimal non-membership degree respectively, and they satisfy the condition: 0a1, 0a1, 0 a+ a1. Also, a x 1 a x a x ,
a x
is called the degree of
indeterminacy of the element x to a. It reflects the hesitancy degree of the element x to a, the smaller a x , the
clearer the fuzzy number is. The
membership function and
Fig. 1. A TIFN a
a a a, , ; a, a
Definition 2 [60]. Let a
a b c, , ; a, a
bea TIFN, its score function can be defined as follows:
2
4 a a
a b c
S a (3)
and its accuracy function can be defined as:
2
4 a a
a b c
H a (4)
Definition 3 [61]. Let aa a a, , ; a, a and
, , ; b, b
b b b b be two TIFNs, then If S a S b
, then ab;If S a S b
, then1. If H a H b
, then ab; 2. If H a
H b
, then ab .Definition 4 [61]. Let a
a a a, , ; a, a
and b
b b b, ,
; b, b
be two TIFNs, and is a real number, some new arithmetic operations on TIFNs considering interactions are defined as follows: (i)a b+
a b a b a b , ,
; min{ , a b}, max{ , } , a b
(ii)a b-
a b a b a b , ,
;min{ , a b}, max{ , } , a b
(iii)ab
ab ab ab, ,
;min{ , },max{ , } , a b a b
if a0,b0, (iv)ab
a b a b a b/ , / , /
;min{ , }, max{ , } , a b a b
if a0,b0,(v)
, , ; , if 0
, , ; , if 0.
a a
a a
a a a
a
a a a
Definition 5 [29]. Suppose A and B be two TIFNs, then
(i)AB iff R A( )R B( ), (ii) AB iff R A( )R B( ).
3. The classical Data Envelopment Analysis
The efficiency of a DMU is established as the ratio of sum weighted output to sum weighted input, subjected to happen between one and zero. Let a set of
n
DMUs, with each DMUj (j1, 2,..., )n by using m inputs
x
ij (i1, 2,..., )m and producings
outputs yrj (r1, 2,..., )s . If DMUp is under consideration, the CCR model for the relative efficiency is the following model [1]:* 1
1
1
1
max
. .
1,
, 0 ,
s
r rp
r
p m
i ip i
s r rj r
m i ij i
r i
u y
v x
s t
u y
j v x
u v r i
(5)
Where u rr( 1, 2,...., )s and v ii( 1, 2,...., )m
51
simplify the computation, the nonlinear program shown as (6)can be converted to a linear programming (LP) and the model was called the CCR model:
* 1 1 1 1 max . . 1 0,
, 0 ,
s
p r rp
r
m
i ip
i
s m
r rj i ij
r i
r i
u y
s t
v x
u y v x
u v r i
(6)We run Model (6) n-times to work out the efficiency of n DMUs. The DMUp is efficient if *
1
, otherwise, it is inefficient.
4. New Ranking Functions
Here, we propose a ranking function.
Definition 6. One can compare any two TIFNs based on the ranking functions. Let a
a a a, , ; a, a
be a TIFN; then: (1 ) .
6 a a
a a a
R a
Example 1. Let a
1, 2,3 ;0.5, 0.3
then
1.2.R a Also. For 1
1,1,1 ;1, 0
,
0 0, 0, 0 ;1,1 we have: R
1 1 and
0 0.R
Also, since R a b
R a R b
,we define an aggregation ranking function as follows:Definition 7. Let ai
a a ai, i, i; i, i
be nTIFNs. Then the aggregation ranking function is as follows:
1 1
1
( ) (1 min max )
1 x
(1 min max )
( ).
6
n n
i
i i i
i i i i
n
i i
i i i i
R a R a
a a a
Example 2. Let a
1, 2,3 ;0.5, 0.3
and
4,8,10 ; 0.2, 0.6
b then:
1.2,
2.2,
5,10,13 ; 0.2, 0.6 .
R a R b a b
But:
2.8 1.2 2.2
.R a b R a R b
So,
(1 0.2 0.6)
(6 22) 2.8 .
6
R ab R ab
5. Triangular Intuitionistic Fuzzy Data Envelopment Analysis
In this section, we establish DEA under triangular intuitionistic fuzzy environment. Consider the input and
output for the jth DMU as
, , ; ,
ij ij
l m u
ij ij ij ij x x
x x x x and
, , ; ,
rj rj
l m u
rj rj rj rj y y
y y y y which are the
triangular intuitionistic fuzzy numbers (TIFNs). Then the triangular intuitionistic fuzzy CCR model that called TIFN-CCR is defined as follows:
* 1 1 1 1 max . . 1 0,
, 0 ,
s
p r rp
r
m i ip i
s m
r rj i ij
r i
r i
u y
s t
v x
u y v x
u v r i
(7)Next, to solve the Model (7), we propose the following algorithm:
Algorithm 1.
Step 1. Consider the DEA model (7) that the inputs and outputs of each DMU are TIFNs.
Step 2. Using Definition 4, the model of Step 1 can be transformed into the following model:
*
1
max , , ; ,
rp rp
s
l m u
p r rp rp rp y y
r
u y y y
1 1 1 . ., , ; , 1
, , ; ,
, , ; , ,
, 0 ,
ip ip
rj rj
ij ij
m
l m u
i ip ip ip x x
i s
l m u
r rj rj rj y y
r m
l m u
i ij ij ij x x
i
r i
s t
v x x x
u y y y
v x x x
u v r i
(8)Step 3. Transform Model (8) into the following model:
* 1 1 1 1( ) max ( , , ; , )
. .
( , , ; , ) (1)
( , , ; , )
( , , ; , ),
, 0 ,
rp rp
ip ip
rj rj
ij ij s
l m u
p r rp rp rp y y
r
m
l m u i ip ip ip x x i
s
l m u r rj rj rj y y r
m
l m u i ij ij ij x x i
r i
R R u y y y
s t
R v x x x R
R u y y y
R v x x x
u v r i
(9)Step 4.Based on Definition 7, convert the Model (9) into the following crisp model:
* 1 1
1 1 1 1 1 1 1 1
(1 min max )
( ) max ( )
6 . .
(1 min max )
( ) 1,
6
(1 min max )
( ) 6 (1 min rp rp ip ip rj rj ij s
y y l m u
r s r s
p r rp rp rp
r
m
x x l m u
i m i m
i ip ip ip i
s
y y l m u
r s r s
r rj rj rj r
x i m
R u y y y
s t
v x x x
u y y y
1 1 max ) ( ), 6, 0 ,
ij m
x l m u
i m
i ij ij ij i
r i
v x x x u v r i
Step 5. Run the crisp model of Step 4 and
obtain the optimal solution.
Theorem 1. The models (6) and (7) are equivalent.
Proof. By considerate the aggregation ranking function and Algorithm.1, it is to see that every optimal feasible solution of Model (7) is an optimal feasible solution of Model (6), on the other hand, every optimal feasible solution of Model (6) is an optimal feasible solution of Model (7). Theorem 1 also shows that the sets of all feasible solutions of Model (7) and Model (6) are the same. Furthermore, if r i, ,
is an optimal solution for Model u vˆ ˆr, i (7), then u vˆ ˆr, iis an optimal solution for the Model (6). Moreover, if Model (6) does not have an optimal solution, then Model (7) does not have an optimal solution either.
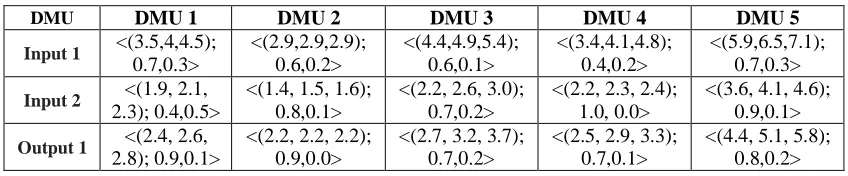
6. Numerical Experiment
For the purpose of interpreting the practicability and the feasibility of the new method proposed in this paper, a numerical example is employed. There are five DMUs that consume two inputs to produce two outputs. These inputs and outputs are given by triangular intuitionistic numbers and do not have obligatory symmetrical triangular truth and falsity membership functions. Table 1 provides the data for this example.
Now, we use Algorithm.1 to solve the performance assessment problem. For example, Algorithm.1 for DMU1 can be
used as follows:
Table 1. Data for the five DMUs used in the numerical example
DMU DMU 1 DMU 2 DMU 3 DMU 4 DMU 5
Input 1 <(3.5,4,4.5);
0.7,0.3> <(2.9,2.9,2.9); 0.6,0.2> <(4.4,4.9,5.4); 0.6,0.1> <(3.4,4.1,4.8); 0.4,0.2> <(5.9,6.5,7.1); 0.7,0.3>
Input 2 <(1.9, 2.1,
2.3); 0.4,0.5>
<(1.4, 1.5, 1.6); 0.8,0.1>
<(2.2, 2.6, 3.0); 0.7,0.2>
<(2.2, 2.3, 2.4); 1.0, 0.0>
<(3.6, 4.1, 4.6); 0.9,0.1>
Output 1 <(2.4, 2.6,
2.8); 0.9,0.1>
<(2.2, 2.2, 2.2); 0.9,0.0>
<(2.7, 3.2, 3.7); 0.7,0.2>
<(2.5, 2.9, 3.3); 0.7,0.1>
53
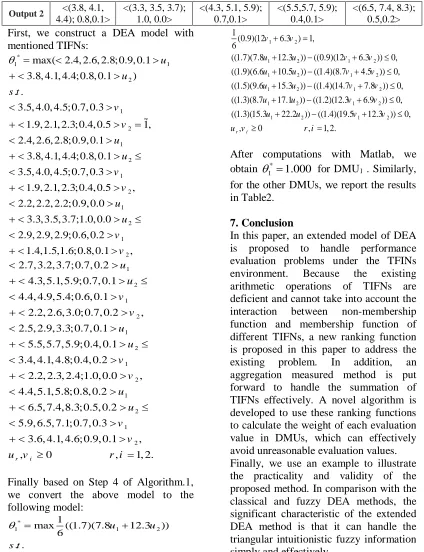
First, we construct a DEA model with mentioned TIFNs: * 1 1 2 1 2 1 2 1
max( 2.4, 2.6, 2.8;0.9, 0.1
3.8, 4.1, 4.4;0.8, 0.1 )
. .
3.5, 4.0, 4.5;0.7, 0.3
1.9, 2.1, 2.3;0.4, 0.5 1,
2.4, 2.6, 2.8;0.9, 0.1
3.8, 4.1, 4.4;0.8, 0.1
3.5, 4.0, 4.5;0.7, 0.3 1.9, 2.1, 2.3;0.4,
u u s t v v u u v
2
1
2
1
2
0.5 ,
2.2, 2.2, 2.2;0.9, 0.0
3.3,3.5,3.7;1.0, 0.0 2.9, 2.9, 2.9;0.6, 0.2
1.4,1.5,1.6;0.8, 0.1 ,
v u u v v 1 2 1 2 1 2 1 2
2.7, 3.2, 3.7; 0.7, 0.2 4.3, 5.1, 5.9; 0.7, 0.1
4.4, 4.9, 5.4; 0.6, 0.1
2.2, 2.6, 3.0; 0.7, 0.2 ,
2.5, 2.9, 3.3; 0.7, 0.1
5.5, 5.7, 5.9; 0.4, 0.1
3.4, 4.1, 4.8; 0.4, 0.2
2.2, 2.3, 2.4;1.0, 0.0 ,
4.4, 5.1 u u v v u u v v 1 2 1 2
, 5.8; 0.8, 0.2
6.5, 7.4,8.3; 0.5, 0.2
5.9, 6.5, 7.1; 0.7, 0.3
3.6, 4.1, 4.6; 0.9, 0.1 ,
, 0 , 1, 2.
r i
u
u
v v
u v r i
Finally based on Step 4 of Algorithm.1, we convert the above model to the following model:
*
1 1 2
1
max ((1.7)(7.8 12.3 ))
6 . . u u s t 1 2
1 2 1 2
1 2 1 2
1 2 1 2
1 2 1 2
1
(0.9)(12 6.3 ) 1, 6
((1.7)(7.8 12.3 )) ((0.9)(12 6.3 )) 0, ((1.9)(6.6 10.5 )) ((1.4)(8.7 4.5 )) 0, ((1.5)(9.6 15.3 )) ((1.4)(14.7 7.8 )) 0, ((1.3)(8.7 17.1 )) ((1.2)(12.3 6.9 ))
v v
u u v v
u u v v
u u v v
u u v v
1 2 1 2
0,
((1.3)(15.3 22.2 )) ((1.4)(19.5 12.3 )) 0,
, 0 , 1, 2.
r i
u u v v
u v r i
After computations with Matlab, we obtain 1* 1.000 for DMU1 .Similarly,
for the other DMUs, we report the results in Table2.
7. Conclusion
In this paper, an extended model of DEA is proposed to handle performance evaluation problems under the TFINs environment. Because the existing arithmetic operations of TIFNs are deficient and cannot take into account the interaction between non-membership function and membership function of different TIFNs, a new ranking function is proposed in this paper to address the existing problem. In addition, an aggregation measured method is put forward to handle the summation of TIFNs effectively. A novel algorithm is developed to use these ranking functions to calculate the weight of each evaluation value in DMUs, which can effectively avoid unreasonable evaluation values. Finally, we use an example to illustrate the practicality and validity of the proposed method. In comparison with the classical and fuzzy DEA methods, the significant characteristic of the extended DEA method is that it can handle the triangular intuitionistic fuzzy information simply and effectively.
Table 2. The efficiencies of the DMUs
DMUs 1 2 3 4 5
Output 2 <(3.8, 4.1,
4.4); 0.8,0.1>
<(3.3, 3.5, 3.7); 1.0, 0.0>
<(4.3, 5.1, 5.9); 0.7,0.1>
<(5.5,5.7, 5.9); 0.4,0.1>
Efficiency 1.0000 0.8587 0.5760 0.7779 0.5934
Ranking 1 2 5 3 4
References
[1] Charnes, A., Cooper, W. W., & Rhodes, E. (1978). Measuring the efficiency of decision making units. European journal of operational research, 2(6), 429-444.
[2]Farrell, M. J. (1957). The measurement of productive efficiency. Journal of the Royal Statistical Society: Series A (General), 120(3), 253-281.
[3]Banker, R. D., Charnes, A., & Cooper, W. W. (1984). Some models for
estimating technical and scale
inefficiencies in data envelopment analysis. Management science, 30(9), 1078-1092.
[4]Zhu, J. (2014). Quantitative models for performance evaluation and benchmarking: data envelopment analysis with spreadsheets (Vol. 213). Springer.
[5]Sahoo, B. K., & Tone, K. (2009). Decomposing capacity utilization in data envelopment analysis: An application to banks in India. European Journal of Operational Research, 195(2), 575-594.
[6]Roodposhti, F. R., Lotfi, F. H., & Ghasemi, M. V. (2010). Acquiring targets in balanced scorecard method by data envelopment analysis technique and its application in commercial banks. Applied Mathematical Sciences, 4(72), 3549-3563.
[7]Lee, Y. J., Joo, S. J., & Park, H. G. (2017). An application of data envelopment analysis for Korean banks with negative data. Benchmarking: An International Journal, 24(4), 1052-1064.
[8]Jiang, H., & He, Y. (2018). Applying Data Envelopment Analysis in Measuring
the Efficiency of Chinese Listed Banks in the Context of Macroprudential Framework. Mathematics, 6(10), 184.
[9]Lee, S. K., Mogi, G., & Hui, K. S. (2013). A fuzzy analytic hierarchy process (AHP)/data envelopment analysis (DEA) hybrid model for efficiently allocating energy R&D resources: In the case of energy technologies against high oil prices. Renewable and Sustainable Energy Reviews, 21, 347-355.
[10]Karasakal, E., & Aker, P. (2017). A multicriteria sorting approach based on data envelopment analysis for R&D project selection problem. Omega, 73, 79-92.
[11]Bahari, A. R., & Emrouznejad, A. (2014). Influential DMUs and outlier detection in data envelopment analysis with an application to health care. Annals of Operations Research, 223(1), 95-108.
[12]Lacko, R., Hajduová, Z., & Gábor, V. (2017). Data Envelopment Analysis of Selected Specialized Health Centres and Possibilities of its Application in the Terms of Slovak Republic Health Care System. Journal of Health Management, 19(1), 144-158.
[13]Ertay, T., Ruan, D., & Tuzkaya, U. R. (2006). Integrating data envelopment analysis and analytic hierarchy for the facility layout design in manufacturing systems. Information Sciences, 176(3), 237-262.
[14]Düzakın, E., & Düzakın, H. (2007).
55
manufacturing firms with super slacks based model of data envelopment analysis: An application of 500 major industrial enterprises in Turkey. European journal of operational research, 182(3),
1412-1432.
[15]Lotfi, F. H., & Ghasemi, M. V. (2007). Malmquist productivity index on interval data in telecommunication firms, application of data envelopment analysis. Applied Mathematical Sciences, 1(15), 711-722.
[16]Shafiee, M., Lotfi, F. H., & Saleh, H. (2014). Supply chain performance evaluation with data envelopment analysis and balanced scorecard
approach. Applied Mathematical
Modelling, 38(21-22), 5092-5112.
[17]Soheilirad, S., Govindan, K., Mardani, A., Zavadskas, E. K., Nilashi, M., & Zakuan, N. (2017). Application of data envelopment analysis models in supply chain management: A systematic review and meta-analysis. Annals of Operations Research, 1-55.
[18]Dobos, I., & Vörösmarty, G. (2018). Inventory-related costs in green supplier
selection problems with Data
Envelopment Analysis (DEA).
International Journal of Production Economics.
[19]Huang, C. W. (2018). Assessing the performance of tourism supply chains by
using the hybrid network data
envelopment analysis model. Tourism Management, 65, 303-316.
[20]Zadeh, L. A. (1965). Fuzzy sets. Information and control, 8(3), 338-353.
[21]Hsu, T. K., Tsai, Y. F., & Wu, H. H. (2009). The preference analysis for tourist choice of destination: A case study of Taiwan. Tourism management, 30(2), 288-297.
[22]Zadeh, L. A. (1977). Fuzzy sets and their application to pattern classification and clustering analysis. In Classification and clustering (pp. 251-299).
[23]Finol, J., Guo, Y. K., & Jing, X. D. (2001). A rule based fuzzy model for the prediction of petrophysical rock parameters. Journal of Petroleum Science and Engineering, 29(2), 97-113.
[24]Jain, R., & Haynes, S. (1983). Imprecision in computer vision. In Advances in Fuzzy Sets, Possibility Theory, and Applications (pp. 217-236). Springer, Boston, MA.
[25]Najafi, H. S., & Edalatpanah, S. A. (2013). An improved model for iterative algorithms in fuzzy linear systems.
Computational Mathematics and
Modeling, 24(3), 443-451.
[26]Najafi, H. S., & Edalatpanah, S. A. (2013). A note on “A new method for solving fully fuzzy linear programming problems”. Applied Mathematical Modelling, 37(14), 7865-7867.
[27]Wang, W. K., Lu, W. M., & Liu, P. Y. (2014). A fuzzy multi-objective two-stage DEA model for evaluating the performance of US bank holding
companies. Expert Systems with
Applications, 41(9), 4290-4297.
[28]Das, S. K., Mandal, T., &
Edalatpanah, S. A. (2017). A
trapezoidal fuzzy numbers. Applied Intelligence, 46(3), 509-519.
[29]Najafi, H. S., Edalatpanah, S. A., & Dutta, H. (2016). A nonlinear model for fully fuzzy linear programming with fully unrestricted variables and parameters. Alexandria Engineering Journal, 55(3), 2589-2595.
[30]Das, S. K., Mandal, T., & Edalatpanah, S. A. (2017). A new approach for solving fully fuzzy linear fractional programming problems using the multi-objective linear programming. RAIRO-Operations Research, 51(1), 285-297.
[31]Sengupta, J. K. (1992). A fuzzy systems approach in data envelopment analysis. Computers & Mathematics with Applications, 24(8-9), 259-266.
[32]Hatami-Marbini, A., Emrouznejad, A., & Tavana, M. (2011). A taxonomy and review of the fuzzy data envelopment analysis literature: two decades in the making. European journal of operational research, 214(3), 457-472.
[33]Kao, C., & Liu, S. T. (2000). Fuzzy efficiency measures in data envelopment analysis. Fuzzy sets and systems, 113(3), 427-437.
[34]Kao, C., & Liu, S. T. (2000). Data envelopment analysis with missing data: an application to university libraries in Taiwan. Journal of the Operational Research Society, 51(8), 897-905.
[35]Lotfi, F. H., Firozja, M. A., & Erfani, V. (2009). Efficiency measures in data envelopment analysis with fuzzy and ordinal data. In International Mathematical Forum (Vol. 4, No. 20, pp. 995-1006).
[36]Emrouznejad, A., & Mustafa, A. (2010). Fuzzy assessment of performance of a decision making units using DEA: A non-radial approach. Expert Systems with Applications, 37(7), 5153-5157.
[37]Lertworasirikul, S., Fang, S. C., Joines, J. A., & Nuttle, H. L. (2003). Fuzzy data envelopment analysis (DEA): a possibility approach. Fuzzy sets and Systems, 139(2), 379-394.
[38]Wang, C. H., Chuang, C. C., & Tsai, C. C. (2009). A fuzzy DEA–Neural approach to measuring design service
performance in PCM projects.
Automation in Construction, 18(5), 702-713.
[39]Jahanshahloo, G. R., Lotfi, F. H., Shahverdi, R., Adabitabar, M., Rostamy-Malkhalifeh, M., & Sohraiee, S. (2009). Ranking DMUs by l1-norm with fuzzy data in DEA. Chaos, Solitons & Fractals, 39(5), 2294-2302.
[40]Juan, Y. K. (2009). A hybrid approach using data envelopment analysis and case-based reasoning for housing refurbishment contractors selection and performance improvement. Expert Systems with Applications, 36(3), 5702-5710.
[41]Wu, D. D., Yang, Z., & Liang, L. (2006). Efficiency analysis of cross-region bank branches using fuzzy data
envelopment analysis. Applied
Mathematics and Computation, 181(1), 271-281.
[42]Wen, M., & Li, H. (2009). Fuzzy data envelopment analysis (DEA): Model and ranking method. Journal of Computational and Applied Mathematics, 223(2), 872-878.
57
based upon fuzzy arithmetic with an application to performance assessment of manufacturing enterprises. Expert systems with applications, 36(3), 5205-5211.
[44]Emrouznejad, A., Tavana, M., & Hatami-Marbini, A. (2014). The state of the art in fuzzy data envelopment analysis. In Performance measurement with fuzzy data envelopment analysis (pp. 1-45). Springer, Berlin, Heidelberg.
[45]Dotoli, M., Epicoco, N., Falagario, M., & Sciancalepore, F. (2015). A cross-efficiency fuzzy data envelopment analysis technique for performance evaluation of decision making units under uncertainty. Computers & Industrial Engineering, 79, 103-114.
[46]Egilmez, G., Gumus, S., Kucukvar, M., & Tatari, O. (2016). A fuzzy data envelopment analysis framework for dealing with uncertainty impacts of input–output life cycle assessment models on eco-efficiency assessment. Journal of cleaner production, 129, 622-636.
[47]Hatami-Marbini, A., Agrell, P. J., Tavana, M., & Khoshnevis, P. (2017). A flexible cross-efficiency fuzzy data
envelopment analysis model for
sustainable sourcing. Journal of cleaner production, 142, 2761-2779.
[48]Wang, S., Yu, H., & Song, M. (2018). Assessing the efficiency of environmental regulations of large-scale enterprises based on extended fuzzy data envelopment analysis. Industrial Management & Data Systems, 118(2), 463-479.
[49]Pourmahmoud, J., Bafekr Sharak, N. (2019). Assessing the undesirable cost imposed on the system with fuzzy DEA.
International Journal of Data
Envelopment Analysis, 7(3), 15-22.
[50]Edalatpanah, S. A., & Smarandache, F. (2019). Data Envelopment Analysis for
Simplified Neutrosophic Sets.
Neutrosophic Sets and Systems, 29, 215-226.
[51]Atanassov, K. T. (1986).
Intuitionistic fuzzy sets. Fuzzy sets and Systems, 20(1), 87-96.
[52]Daneshvar Rouyendegh, B. (2011). The DEA and intuitionistic fuzzy TOPSIS approach to departments' performances: a pilot study. Journal of Applied Mathematics, 2011.
[53]Gandotra, N., Bajaj, R. K., & Gupta, N. (2012). Sorting of decision making units in data envelopment analysis with intuitionistic fuzzy weighted entropy. In
Advances in Computer Science,
Engineering & Applications (pp. 567-576). Springer, Berlin, Heidelberg.
[54]Hajiagha, S. H. R., Akrami, H., Kazimieras Zavadskas, E., & Hashemi, S. S. (2013). An intuitionistic fuzzy data envelopment analysis for efficiency evaluation under ucertainty: case of a finance and credit institution.
[55]Puri, J., & Yadav, S. P. (2015). Intuitionistic fuzzy data envelopment analysis: An application to the banking sector in India. Expert Systems with Applications, 42(11), 4982-4998.
[57]Arya, A., & Yadav, S. P. (2019). Development of intuitionistic fuzzy data envelopment analysis models and intuitionistic fuzzy input–output targets. Soft Computing, 23(18), 8975-8993.
[58]Shu, M. H., Cheng, C. H., & Chang, J. R. (2006). Using intuitionistic fuzzy sets for fault-tree analysis on printed circuit board assembly. Microelectronics Reliability, 46(12), 2139-2148.
[59]Li, D. F. (2010). A ratio ranking method of triangular intuitionistic fuzzy numbers and its application to MADM problems. Computers & Mathematics with Applications, 60(6), 1557-1570.
[60]Wan, S. P., Wang, Q. Y., & Dong, J. Y. (2013). The extended VIKOR method for multi-attribute group decision making with triangular intuitionistic fuzzy numbers. Knowledge-Based Systems, 52, 65-77.