Topical issue on:
NICHE PRODUCTS AND CROP DIVERSIFICATION: IN SEARCH OF ADDED VALUE
PRODUITS DE NICHE ET CULTURES DE DIVERSIFICATION : À LA RECHERCHE DE VALEUR AJOUTÉE
RESEARCH
ARTICLE
Physicochemical characteristics of high free fatty acid crude palm oil
Abd Al-Wali Japir
1,2, Jumat Salimon
2, Dar
fi
zzi Derawi
2, Murad Bahadi
2, Salah Al-Shuja
’
a
3and Muhammad Rahimi Yusop
2,*1
Department of Chemistry, Faculty of Education, Thamar University, Thamar, Yemen
2
School of Chemical Sciences and Food Technology, Faculty of Science and Technology, Universiti Kebangsaan Malaysia, 43600 Bangi, Selangor, Malaysia
3
School of Chemical Engineering and Technology, Tianjin University, 135, Yaguan Road, Jinnan District, 300350 Tianjin, PR China
Received 24 March 2017–Accepted 13 June 2017
Abstract – The physicochemical properties of different grades of Malaysian crude palm oil (high free fatty acid crude palm oil (HFFA-CPO) and low free fatty acid crude palm oil (LFFA-CPO)) were analyzed in this study to determine their applicability as edible oils. The percentages of free fatty acids (FFAs%), iodine value, hydroxyl value, unsaponifiable value, moisture content for HFFA-CPO and LFFA-CPO were 8.7 ± 0.3 and 3.8 ± 0.1%; 53.1 ± 0.4 and 56 ± 0.3 g I2/100 g; 32.5 ± 0.6 and 18.5 ± 0.9 mg KOH/g oil; 0.31 ± 0.01 and 0.46 ± 0.02%; 0.31 ± 0.01 and 0.33 ± 0.01%, respectively. The fatty acid compositions were determined using a gas chromato-graphy-flame ionization detector (GC-FID). The results showed that the dominant fatty acids are palmitic acid (43.2%–44.4%) and oleic acid (39.8%–41.4%). The major triacylglycerols (TAGs) of HFFA-CPO and LFFA-CPO estimated using high-performance liquid chromatography (HPLC), were POP (30.8%–33.6%) and POO (24.9%–29.7%). In general, the physicochemical properties of HFFA-CPO and LFFA-CPO are consistent with the standard Malaysian crude palm oil, with the exception of FFAs%, hydroxyl value, moisture contents.
Keywords:physicochemical characteristic / hydroxyl value / high free fatty acid crude palm oil / triacylglycerol profile / fatty acid composition
Résumé – Caractéristiques physico-chimiques de l’huile de palme brute à haute teneur en acides gras libres.Les propriétés physico-chimiques des différentes nuances de l’huile de palme brute malaisienne (huile de palme brute à haute teneur en acides gras libres (HFFA-CPO) et huile de palme brute à faible teneur en acides gras libres (LFFA-CPO)) ont été analysées dans cette étude pour déterminer leur applicabilité sous forme d’huiles comestibles. Les pourcentages d’acides gras libres (FFAs %), de valeur d’iode, de valeur d’hydroxyle, de valeur insaponifiable, de teneur en humidité pour HFFA-CPO et LFFA-CPO étaient de 8,7 ± 0,3 et 3,8 ± 0,1 % ; 53,1 ± 0,4 et 56 ± 0,3 g I2/100 g ; 32,5 ± 0,6 et 18,5 ± 0,9 mg KOH/g huile ; 0,31 ± 0,01 et 0,46 ± 0,02 % ; 0,31 ± 0,01 et 0,33 ± 0,01 %, respectivement. Les compositions d’acides gras ont été déterminées en utilisant un détecteur de chromatographie-flamme ionisation en phase gazeuse (GC-FID). Les résultats ont montré que les acides gras dominants sont l’acide palmitique (43,2 %–44,4 %) et l’acide oléique (39,8 %–41,4 %). Les principaux triacylglycérols (TAGs) de HFFA-CPO et LFFA-CPO estimés en utilisant la chromatographie liquide haute performance (HPLC), étaient POP (30,8 %–33,6 %) et POO (24,9 %–29,7 %). En général, les propriétés physico-chimiques de HFFA-CPO et LFFA-CPO sont compatibles avec l’huile de palme brute malaisienne standard, à l’exception des FFAs %, valeur hydroxyle, teneur en humidité.
Mots clés :caractéristique physico-chimique / valeur hydroxyle / huile de palme brute à haute teneur en acides gras libres / profil de triacylglycérol / composition en acides gras
Topical
Issue
Corresponding author:rahimi@ukm.edu.my
DOI:10.1051/ocl/2017033
Oilseeds & fats Crops and Lipids
OCL
Available online at:
1 Introduction
The oil palm tree (Elaeis guineensis) is cultivated extensively in Southeast Asia and Equatorial Africa as an agricultural crop (Muhamadet al., 2012), to extent of being expanded into the highest-yielding cash crop (3.66 tons/ha/ year) in Malaysia (Basiron, 2007). Malaysian palm oil comprises an estimated 27% of export trade of fats and oils and make up 13% of the global production of oils and fats. This ensures Malaysia is the second largest producer and exporter of palm oil after Indonesia (Pakiam, 2013).
The fresh fruit bunches (FFB) of oil palm tree contain two types of oil: crude palm kernel oil (CPKO) extracted from the seed or kernel, and crude palm oil (CPO) extracted from theflesh of the fruit (mesocarp) (Tanet al., 2009). The composition of Malaysian CPO includes triacylglycerols (TAGs), diacylglycer-ols (DAGs), monoacylglycerdiacylglycer-ols (MAGs) and free fatty acids (FFAs) which are the major components [(%99–95 while the minor components (1–5%)] comprise of carotenoids, tocopher-ols, stertocopher-ols, phosphatides, and aliphatic alcohols (Prasanth Kumar and Gopala Krishna, 2014). In general, approximately 80% of the palm oil produced is used for human consumption and 20% are utilized for non-edible purposes such as the manufacture of oleochemicals (Basiron and Weng, 2004).
The low free fatty acid crude palm oil displays exceptional physicochemical properties, such as oil yield of 37.19 ± 2.04 (%), FFAs% of 0.65 ± 0.09 (%), the moisture content of 0.52 ± 0.37 (%), and its high industrial applicability. However, there are dearth of studies on the characterization of high free fatty acid crude palm oil, although it has been noted that endogenous lipase (triacylglycerol acylhydrolase) is present in oil palm fruits (Ngando Ebongue et al., 2008), which is the first enzyme to be associated with the degradation of triacylglycerols and liberated of FFAs, MAGs, and DAGs (Sambanthamurthi et al., 2000). The degradation action of lipase increases FFAs levels in crude palm oil, which is important because FFAs level is considered one of the most characteristic quality index for the length of the storage, marketing and production, and price of palm oil products (Saadet al., 2007).
The currently evolving climate, torrential rainfall, humidi-ty and inadequate storage result in the breakdown of TAGs and release of FFAs. Consequently, the increasing FFAs level in CPO, exceeding 5%, makes it unhealthy for human consumption (Ngando Ebongueet al., 2008). Nonetheless, the quality of the palm oil is influenced by its FFAs content. Normally, the FFAs content of good quality crude palm oil should not exceed 5% (Adjei-Nsiahet al., 2012). Therefore, crude palm oil (CPO) with FFAs percentage of less than 5% is valuable for food applications or oleochemicals. Conversely, FFAs percentage exceeding 5% indicates the CPO can be beneficial for non-food applications such as bioplastics, biodiesel and biolubricant similar to other plants oil (Salih et al., 2013a, 2013b). Thus, the quantitative analysis of the oil is tremendously significant in order to determine the applicability of CPO either in the food industry or non-food applications such as surfactants (Harun et al., 2013; Hong et al., 2013). This study quantitatively characterizes the physicochemical properties and composition of HFFA-CPO and LFFA-CPO.
2 Experimental
2.1 Samples
HFFA-CPO and LFFA-CPO were provided by Sime Darby Company, Kuala Lumpur and stored at 4°C.
2.2 Chemicals
All solvents and chemicals were used as received, and they include hydrochloric acid (36.5%), methanol (99.8%), toluene (99%), isopropanol (99.7%), ethanol (95%), potassium hydrox-ide (99%), pyridine (99%), sodium sulphate (99%) and potassium iodide (99.5%), which were purchased from SYSTERM. Acetone (99.5%) and acetonitrile (99.5%) of HPLC grade purchased from JT Baker were also used. Cyclohexane (99.7%),n-hexane (99%), sodium thiosulphate (99%) and wij’s solution were purchased from Qrec. Anhydride acetic (98.5%) was purchased from Riedel-deHaen (Sigma Aldrich.com, Germany). Phenolphthalein and fatty acid methyl ester standard were purchased from BDH and Fluka, respectively.
2.3 Physicochemical characteristics
2.3.1 Free fatty acids (FFAs%) and acid value (AV)
The oil was tested for acidity using the American Oil Chemists’Society (AOCS) method Ca 5a–40 (1989) (Prasanth Kumar and Gopala Krishna, 2015). Firstly, 5 g of the oil sample was placed in a dried conical flask. Approximately 50 mL of pre-neutralized isopropanol was then added to the sample. Afterward, 500mL of 1% phenolphthalein indicator was then added to the mixture. The flask was subsequently positioned on a hot plate and heated until a temperature of around 40°C was attained. The mixture was then titrated with sodium hydroxide solution (0.1 N) until a pink color emerged for at least 30 seconds. The FFAs% and acid value were determined using the underlying equations.
FFAs%as palmitic acid¼ mL of titrant
ð Þ ð ÞNof titrant
ð Þ ð25:6Þ
weight of samples in grams
mg NaOH g sample
;
ð1Þ where, 25.6 is the formula for FFAs determination and equivalence factor for palmitic acid; the dominant fatty acid in palm oil.
AV¼FFAs% 2:19; ð2Þ
where, AV = acid value; 2.19 is the conversion factor for palmitic acid.
2.3.2 Iodine value (IV)
and 20 mL of potassium iodide solution (KI 10%) were then added to the mixture. The mixture was subsequently titrated against sodium thiosulphate (0.1 N Na2S2O3) until a yellow color emerged. After that, 1 mL of (starch, 1%) was added and the titration process was continued till the blue color dissipated. The same procedure was replicated with a blank. Iodine value was determined using equation (3).
IV¼ððVbVsÞ ð ÞNof titrantÞ ð12:69Þ weight of samples in grams
gI2 100 g sample
;
ð3Þ
where, Vb= mL of blank; Vs= mL of titrant, 12.69 is used to transfer equivalent thiosulphate to g (I2).
2.3.3 Hydroxyl value (HV)
Five grams of oil sample were placed in a 250 mL round bottom flask. Five milliliters of acetic anhydride-pyridine reagent (acetic anhydride: pyridine, 1:4, v/v) were then added to the sample. The mixture was refluxed at 100°C and shaken vigorously for duration of 1 hour. Afterwards, the mixture was cooled for a minimum of 10 min at ambient temperature. The hydrolysis process of the excess acetic anhydride reagent was completed with the addition of 10 mL of deionized water and return of the flask to the oil bath for 10 min. Twenty five milliliters of neutralized ethanol and 1 mL of phenolphthalein indicator were subsequently added after cooling the mixture to room temperature. The mixture was then titrated with methanolic potassium hydroxide (0.5 N) until a faint pink color emerged (Fernandes et al., 2014). Hydroxyl value was calculated using equation (4).
HV¼ððVbVsÞ ð ÞNof titrantÞ ð56:1Þ weight of samples in grams þAV mg KOH
g sample
; ð4Þ
where, Vb= mL of blank; Vs= mL of titrant; AV = acid value.
2.3.4 Saponification value (SV)
The saponification value (SV) of crude palm oil was determined in line with British Standards BS 684 2.6.1977 (Abdullahet al., 2013). Firstly, 2 g of the oil sample was placed in a 100 mL round bottom flask. Afterward, 25 mL of 0.5 N ethanolic potassium hydroxide was added to the sample. The mixture was subsequently refluxed, boiled uniformly and repeatedly agitated for a duration of 1 hour. The warm mixture was then titrated against 0.5 N HCl in the presence of phenolphthalein (1%). The saponification value was calculated using equation (5) shown below.
SV¼ððVbVsÞ ð ÞN of titrantÞ ð56:1Þ weight of samples in grams
mgKOH gsample
;
ð5Þ where, Vb= mL of blank; Vs= mL of titrant.
2.3.5 Unsaponifiable matter USM (%)
The unsaponifiable matter was determined in line with AOCS Ca 6a–40 (1989) (Salimon et al., 2012). Precisely
weighed 5 g of crude palm oil was placed in a 250 mL round bottom flask two necks. Thirty milliliters of ethanol alcohol and 5 mL of 5% potassium hydroxide aqueous solution (w/v %) were then poured into the flask. The mixture was refluxed, boiled uniformly and repeatedly agitated for 1 hour. The mixture was briskly stirred to ensure the solution was thoroughly mixed and to attain complete saponification. Afterward, the experimental set up was dismantled, and the
flask was subsequently rinsed with 10 mL of ethanol, 20 mL warm distilled water, and 20 mL cold distilled water, sequentially. The contents of the flask were transferred carefully to a 250 mL separating funnel and kept to cool at ambient temperature. Fifty milliliters of hexane were then added to the mixture, and the separating funnel was shaken vigorously for 1 min. The funnel was left for a few minutes until two distinct layers in the mixture emerged. The upper organic layer was collected by transferring the lower aqueous layer of the solution into a different separating funnel. The extraction procedure of the aqueous layer was similarly repeated five times more using hexane. The combined extracts were then washed three times with 25 mL portions of 10% (v/v, %) ethanol and the mixture was shaken vigorously. The organic layer was then washed with 20 mL portions of distilled water until the wash water no longer changed to pink color with the addition of a few drops of phenolphtha-lein. The organic layer was subsequently poured into a round
flask. The hexane contained in the organic layer was evaporated under reduced pressure. Afterward, the flask was fully dried in a vacuum oven at 75°C, and then cooled in a desiccator until constant weight was attained. The extract was dissolved in 50 mL of freshly boiled and neutralized 95% ethanol and then titrated against 0.02 N NaOH solution using phenolphthalein (1%). The weight of the residue for free fatty acids (FFAs) content was calculated using the formula below:
Wal¼mL of NaOH 0:00056; ð6Þ
where, Walis the weight in grams of fatty acids; mL is volume of NaOH used for titration; 0.00056 is conversion factor for KOH.
Unsaponifiable matter amount was calculated by using the equation (7).
USM%¼ðWrWalÞ
W ; ð7Þ
where, W denotes weight in grams of the oil taken for the test portion; Wrrepresents weight in grams of the residue.
2.3.6 Moisture content
The moisture content of oil was carried out by using air oven method according to AOCS Ca 2c–25 (Bahadi et al., 2016;Salimon and Ahmed, 2012). The moisture content was determined using IR moisture analyzer, this method based on direct infrared radiation in the dry oven instead of hot circulation air. The IR rays are absorbed by the sample and caused the wanted heating of the sample. The instrument operates on the thermogravimetric principle. The fundamental for the estimation of the moisture content is the weight loss of the sample at the end of drying. Then, about 5 g of oil sample subjected in the aluminum dish. Thereafter, the oil sample was
Topical
heated at 101°C for half an hour. Then display reading was recorded. This procedure was repeated until constant weight was achieved.
2.3.7 Viscosity
Viscosity of oil was determined by using the Brookfield model DV-I (U.S.A) equipped with a n05 spindle. The sample mixture was stirred for 1 min at speed of 100 rpm at ambient temperature. The spindle was allowed to rotate in the oil for a duration of 1 min awaiting the reading on the meter’s monitor to be stable (Isaac Bamgboye and Adejumo, 2010).
2.3.8 Refractive index
Refractive index of oil was measured in line with AOCS official methods (Cc 7–25) using a refractometer (TAGO Co. Ltd. Series N0 11506, Japan) as explained by Salimon and Ahmed (2012). Two drops of oil were placed on the prism, which was secured firmly by tightening up screw heads. The refractometer was allowed to be stable for a couple of minutes before taking the readings on the display monitor. Oil stains on the prism should be wiped off between readings using cotton pad damped with ethanol and allowed to dry afterward.
2.3.9 Specific gravity
It was carried by using digital balance; 1 mL of oil sample was placed on the digital balance and recorded its weight at ambient temperature. After that, the density gravity was calculated by using Lund relationship (Gunstone, 2011).
2.3.10 Color
The color of oil was estimated according to AOCS Official methods Cc 13b45 (97) by using a Lovibond Tintometer 181059 Model F (U.K) (Salimon and Ahmed, 2012). The oil sample was heated at 60°C and then gently shaken it till completely homogenized. The melted sample was introduced by an inch cell up to three-quarter and the color was carried out at ambient temperature (28°C) by performing the suitable probable match among the standard color slides equipped.
2.3.11 Fatty acid composition (FAC)
The fatty acid methyl esters (FAME) were prepared using two methods: acid catalyzed and base catalyzed preparations. In acid catalyzed preparation, a reagent mixture of 10 mL methanol and 2.5 mL concentrated hydrochloric acid (37%) was used. Two grams of the oil sample were placed in a small (50 mL) two-neck round-bottom flask, equipped with a standard taper joint (19/38) and short condenser. Afterward, 7.5 mL methanol was added to 1.5 mL of the previous reagent followed by 1.5 mL of toluene. The mixture was then heated at 65°C for 1.5 hour. The heated mixture was subsequently transferred to a separatory funnel. Fifteen milliliters of hexane and 10 mL distilled water were added to the mixture. Afterward, the mixture was left to stand until two distinct layers emerged. The upper layer was decanted and dried using anhydrous sodium sulphate Na2SO4overnight. Then 1mL of the FAME was then injected into a gas chromatograph.
For base catalyzed preparation, the FAME were prepared by blending 0.1 mL of sample with 1 mL of hexane. One
milliliter of sodium methoxide (MeOH) (1.55 g NaOH and 50 mL of methanol) was subsequently added to the sample, followed by vigorous shaking until a cloudy mixture was obtained. Afterward, 1 mL of distilled water was added to the mixture. The mixture was kept at room temperature until two distinct layers appeared. The FAME layer was gradually decanted, and dried over anhydrous sodium sulphate (Alabi et al., 2013). Then 1mL of the FAME was then injected into a gas chromatograph.
2.3.11.1 Gas Chromatography
FAME analysis was carried out using gas chromatograph (Model 5890 SERIES II GC, HEWLETT PACKARD, USA) equipped withflame ionization detector (FID) and a BPX-70 fused silica capillary column (30 m, 0.25 mm i.d., 0.25mmfilm thickness). The temperature of the injector was maintained at 280°C. Helium was used as the carrier gas at aflow rate of 1 mL/min with an injection volume of 1mL and a split ratio of 60:1. The oven temperature was maintained at 120°C and gradually increased to 245°C at a rate of 3°C per min for 56.6 min. The temperature was held for 15 min. The FAME peaks were then classified and quantified by comparatively analyzing their peak areas and retention times with those of standard FAME (Japiret al., 2016a).
2.3.12 Triacylglycerols (TAGs) profile
To obtain TAGs profiles, 10 g of the oil sample was diluted with 30 mL hexane and subsequently dehydrated overnight using 10 g of anhydrous sodium sulphate. Afterward, the samples werefiltrated throughfilter paper, and the hexane was evaporated under reduced pressure. After that, 100mL of the oil sample was dissolved in a mixture of 1.0 mL acetone and acetonitrile combined at ratio of 63.5:36.5, which was shaken vigorously using a vortex mixture until it became totally dissolved. The mixture was filtrated twice using a 0.45mL disposable LC filter disk. About 5mL of the sample was injected into HPLC at operation duration of 40 min.
After sample preparation, the triacylglycerols (TAGs) composition was analyzed with High-performance liquid chromatography (HPLC) system comprising Waters 1525 Binary HPLC Pump, provided with Waters 2707 Auto-sampler and Waters 2424 Evaporative Light Scattering Detector ELSD Bridge TM, [Waters, BEH Technology, USA]. The isocratic separation of TAGs was performed using the reverse phase HPLC on C18 column (C18 column, 4.6250 mm, 5mm). Elution was attained at a solvent flow rate of 1 mL/min evaporator with a temperature of 30°C and air pressure of 3.5 bar, using acetonitrile (63.5:36.5, v/v) as the mobile phase. The TAGs was calculated as relative area percentage in accordance with AOCS O.M. No. Ce 5b–89. TAGs peaks were determined based on the theoretical carbon number (TCN) (Prasanth Kumar and Gopala Krishna, 2014).
3 Results and Discussion
3.1 Physicochemical characteristics of CPO
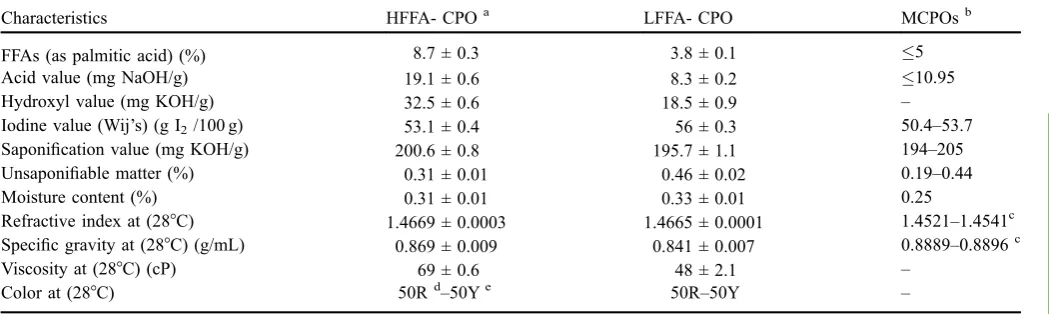
quality. The chemical characteristics of CPO are outlined in Table 1. The percentage of FFAs in the oil is an indication of their level of degeneration and quality. In addition, duration and storage conditions of the seeds are also factors that may affect the value of free fatty acid (Fokou et al., 2009). The free fatty acids composition (%) of the two oil samples which ranged from 3.8 ± 0.1% to 8.7 ± 0.3%, while that of HFFA-CPO is approximately 8.5% as reported in an earlier study (Chonget al., 2007). The high value of free fatty acid in CPO may be attributable to the method selected to process the oil seeds. The rottenness of the fat leads to the release of FFAs from triacylglycerol (Ekwenye, 2006). The lipolytic enzymes carry out the process of fermentation by hydrolyzing the triglyceride in the seeds and releasing the free fatty acid. The degeneration of triacylglycerol in the oil is accelerated by light and temperature.
The acid value is also a factor that significantly affects the use of oil for industrial applications or human nutritional purposes (Akinyeyea et al., 2011). The acid value was determined to be 19.1 ± 0.6, 8.4 ± 0.2 mg NaOH/g oil for HFFA-CPO and LFFA-CPO, respectively. According to literature, the acid value (oleic acid) of oil for food applications should not exceed 0.4% (Amoo, 2004), which indicates the acid values of the study samples fall outside the nutritional limit. The hydroxyl values were 32.5 ± 0.6 and 18.5 ± 0.9 mg KOH/g for HFFA-CPO and LFFA-CPO, respectively. These values mean high free fatty acid-crude palm oil involves DAGs and MAGs higher than crude palm oil low free fatty acid as reported in triacylglycerols (TAGs) analysis as shown inTable 3.
Iodine values of 53.1 ± 0.4 and 56 ± 0.3 g/100 g were determined for HFFA-CPO to LFFA-CPO, respectively, as shown in Table 1. The disparity in these values can be attributed to the fatty acid composition in CPO, where the percentage of unsaturated fatty acid in LFFA-CPO is lower compared to the unsaturated fatty acid content of HFFA-CPO. In contrast, the percentage of saturated fatty acid in LFFA-CPO is relatively higher compared to that of HFFA-LFFA-CPO as shown in Table 2. The oils with unsaturated fatty acid (monounsaturated or polyunsaturated) are merely absorbed and comparably easier to decompose into calories than
saturated fatty acid. Thus, the higher iodine number of LFFA-CPO is an indication of decline in stability and more susceptibility to oxidative rancidity compared to HFFA-CPO (Olanrewaju and Moriyike, 2013).
Saponification value (SV) is an estimation of oxidation during storage and is also an indication of the decomposition level of the oils (Neagu et al., 2013). SV is an important parameter for characterizing the industrial use of oil, specifically for soap production (Olanrewaju and Moriyike, 2013). Oils with low SV value can be used for the production of soap, candle, and raw materials for lubricants (Agatemor, 2006). The unsaponifiable matter of crude palm oil basically comprises higher aliphatic alcohols, tocopherols, carote-noids, phytosterols, tocotrienols, coenzyme Q, and squalene (Prasanth Kumar and Gopala Krishna, 2014). The SV of HFFA-CPO was evaluated to be 200.6 ± 0.8 mg KOH/g, while that of LFFA-CPO was 195.7 ± 1.1 mg KOH/g, as shown inTable 1. The unsaponifiable matter for HFFA-CPR and LFFA-CPO were found to be 0.31 ± 0.01% and 0.46 ± 0.02%, respectively.
The high refractive index of these oils is attributable to the high number of carbon atoms in their fatty acid composition (Falade et al., 2008). The specific gravities of oils showed slight difference and were in the range of 0.869 ± 0.009 for HFFA-CPO to 0.841 ± 0.007 for LFFA-CPO. The viscosities at 28°C of 69 ± 0.5 cP and 48 ± 2.1 cP were determined for HFFA-CPO and LFFA-CPO, respectively, as shown inTable 1. The moisture contents for HFFA-CPO and LFFA-CPO fall outside the range of Malaysian crude palm oil standard due to decreased quality of oil caused by increased activity of endogenous lipase (triacylglycerol acylhydrolase) in the oil palm fruits. Therefore, the high moisture content is due to released FFAs and poor quality of the crude palm oil.
3.2 Variation in fatty acid composition of CPO
The free fatty acids (FFAs) composition of HFFA-CPO and LFFA-CPO subjected to acid catalyzed preparation comprises palmitic (44.4%, 44.9%), oleic (39.2%, 39.5%), and linoleic acid (10.7%, 10.6%), stearic (4.1%, 3.5%), myristic (1.1%, 1.3) and lauric acid (0.4%, 0.2%), respectively, as shown in
Topical
Issue
Table 1. Physicochemical characteristics of HFFA-CPO and LFFA-CPO.
Characteristics HFFA- CPOa LFFA- CPO MCPOsb
FFAs (as palmitic acid) (%) 8.7 ± 0.3 3.8 ± 0.1 5
Acid value (mg NaOH/g) 19.1 ± 0.6 8.3 ± 0.2 10.95
Hydroxyl value (mg KOH/g) 32.5 ± 0.6 18.5 ± 0.9 –
Iodine value (Wij’s) (g I2/100 g) 53.1 ± 0.4 56 ± 0.3 50.4–53.7
Saponification value (mg KOH/g) 200.6 ± 0.8 195.7 ± 1.1 194–205 Unsaponifiable matter (%) 0.31 ± 0.01 0.46 ± 0.02 0.19–0.44
Moisture content (%) 0.31 ± 0.01 0.33 ± 0.01 0.25
Refractive index at (28°C) 1.4669 ± 0.0003 1.4665 ± 0.0001 1.4521–1.4541c Specific gravity at (28°C) (g/mL) 0.869 ± 0.009 0.841 ± 0.007 0.8889–0.8896c
Viscosity at (28°C) (cP) 69 ± 0.6 48 ± 2.1 –
Color at (28°C) 50Rd–50Ye 50R–50Y –
Table 2. The free fatty acid compositions of HFFA-CPO and LFFA-CPO were relatively close because of similar activity of microbial lipase in both palm fruits. The composition of HFFA-CPO and LFFA-CPO prepared with base catalyst comprises palmitic (44.4%, 43.2%), oleic (39.8%, 41.4%), linoleic acid (10.0%, 9.6%), stearic (4.4%, 4.3%), myristic (1.1%, 1.1%) and lauric (0.3%, 0.2%) and linolenic acid (0.0%, 0.3%) for HFFA-CPO and LFFA-CPO, respectively, as shown inTable 2.
The gas chromatography (GC) results show a slight difference between HFFA-CPO and LFFA-CPO prepared with acid and base catalysts. The results suggest that TAGs, DAGs, and MAGs were possibly completely hydrolyzed by the base catalyzed preparation. It is evident inTable 2 that the compositions of acid and base catalysts based HFFA-CPO and LFFA-CPO are slightly similar. The distinctiveness of the GC peaks is dependent on the number of carbon and boiling point of each fatty acid. The higher the retention times for the peaks detected, the greater the carbon number. The results suggest that retention time and boiling point increased with increasing intermolecular forces due to the double bond in the FFAs backbone for the same carbon chain length such as oleic and stearic acid (Japiret al., 2016b).
3.3 Triacylglycerols profile analysis of CPO
The triacylglycerols (TAGs) content of Malaysian high and low free fatty acid crude palm oils is an important factor that controls their quality and industrial applicability. In this study, monoacylglycerol (MAGs) content of HFFA-CPO was 2.2%. However, the MAGs level was relatively lower in LFFA-CPO with a value of 0.9%, due to the variation in FFAs composition as shown inTable 3. The diacylglycerols (DAGs) level was determined to be 8.2% and 78.9%, while the triacylglycerol Table 2. Free fatty acid composition and oil composition HFFA-CPO and LFFA-CPO.
Relative composition (%)
Acid catalyst Base catalyst
Fatty acids HFFA-CPOa LFFA- CPO HFFA- CPOa LFFA-CPO MPOBsb
Lauric acid 0.4 0.2 0.3 0.2 0–0.5
Myristic acid 1.1 1.3 1.1 1.1 0.9–1.5
Palmitic acid 44.4 44.9 44.4 43.2 39.2–45.8
Stearic acid 4.1 3.5 4.4 4.3 3.7–5.4
P
SFAs 50.1 49.9 50.2 48.8 45.3–55.4
Oleic acid 39.2 39.5 39.8 41.4 37.4–44.1
P
MUFAs 39.2 39.5 39.8 41.4 37.4–44.1
Linoleic acid 10.7 10.6 10.0 9.6 8.7–12.5
Linolenic acid – – – 0.3 0–0.5
P
PUSFAs 49.9 50.1 49.8 51.3 44.8–57.3
Notes:aJapiret al.(2016a),bMS814:2007,Sue and Pantzaris (2009); MPOBs = Malaysian Palm Oil Board specification; HFFA- CPO = high free fatty acid-crude palm oil; LFFA-CPO = low free fatty acid-crude palm oil; PSFAs = total saturated fatty acid; PMUFAs = total monounsaturated fatty acids;PPUFAs = total polyunsaturated fatty acids.
Table 3. The composition of high and low free fatty acid crude palm oil.
CPO % HFFA-CPOa LFFA-CPO
P
FFAs 10.7 3.7
P
MAGs 2.2 0.9
P
DAGs 8.2 4.9
P
TAGs 78.9 90.5
Notes:aJapiret al.(2016a); CPO = crude palm oil; FFAs = free fatty acids; MAGs = monoacylglycerols; DAGs = diacylglycerols; TAGs = triacylglycerols; HFFA- CPO = high free fatty acid-crude palm oil; LFFA-CPO = low free fatty acid-crude palm oil.
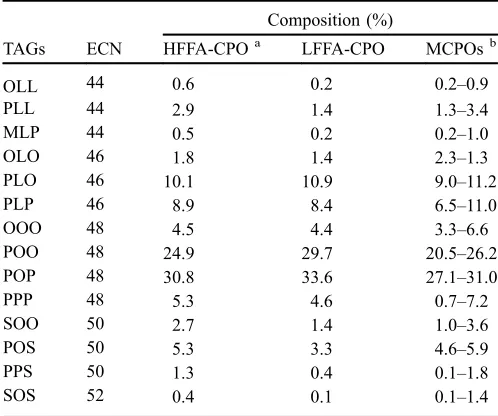
Table 4. Triacylglycerols composition of high and low free fatty acid crude palm oil.
Composition (%)
TAGs ECN HFFA-CPOa LFFA-CPO MCPOsb
OLL 44 0.6 0.2 0.2–0.9
PLL 44 2.9 1.4 1.3–3.4
MLP 44 0.5 0.2 0.2–1.0
OLO 46 1.8 1.4 2.3–1.3
PLO 46 10.1 10.9 9.0–11.2
PLP 46 8.9 8.4 6.5–11.0
OOO 48 4.5 4.4 3.3–6.6
POO 48 24.9 29.7 20.5–26.2
POP 48 30.8 33.6 27.1–31.0
PPP 48 5.3 4.6 0.7–7.2
SOO 50 2.7 1.4 1.0–3.6
POS 50 5.3 3.3 4.6–5.9
PPS 50 1.3 0.4 0.1–1.8
SOS 52 0.4 0.1 0.1–1.4
(TAGs) level was 4.9% and 90.5%, in HFFA-CPO and LFFA-CPO, respectively. These differences can be attributed to the high activity of endogenous lipase (triacylglycerol acylhy-drolase) during the rainy season. The activity of lipase increases FFAs%, MAGs%, and DAGs% in crude palm oil, which in turn modifies the physiochemical properties of the crude palm oilviadegradation of triacylglycerols.
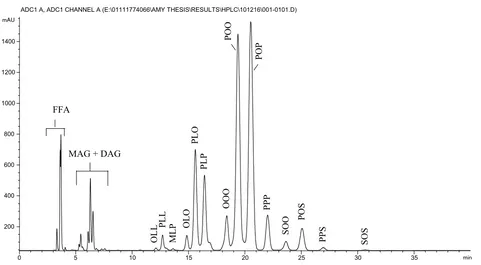
The TAGs composition analysis of HFFA-CPO and LFFA-CPO based on the HPLC profile phase showed that both oil samples comprise a minimum of 14 significant TAGs as shown
in Table 4, Figures 1 and 2. The TAGs composition was identified based on equivalent carbon number (ECN) (Prasanth Kumar and Gopala Krishna, 2014). The major TAGs of HFFA-CPO and LFFA-HFFA-CPO were POO (30.8% and 33.6%), POP (24.9% and 29.7%), PLO (10.1% and 10.9%), PLP ( 8.9% and 8.4%) and PPP (5.3% and 4.6%), respectively. The other identified TAGs are 5% of the total composition (Tab. 4). The TAGs compositions of HFFA-CPO and LFFA-CPO are slightly similar to that of Malaysian crude palm oil standard, as shown inTable 4.
Topical
Issue
䣯䣫䣰
0 5 10 15 20 25 30 35
䣯䣃䣗
200 400 600 800 1000 1200 1400 1600 1800
ADC1 A, ADC1 CHANNEL A (E:\01111774066\AMY THESIS\RESULTS\HPLC\001-0101.D)
SOS
PPS
POS
SOO
PPP
POP
POO
OOO
PLP
PLO
OLO
MLP
PLL
OLL
MAG + DAG
FFA
FFA
FFA
Fig. 1.Triacylglycerol profile of high free fatty acid crude palm oil.
䣯䣫䣰
0 5 10 15 20 25 30 35
䣯䣃䣗
200 400 600 800 1000 1200 1400
ADC1 A, ADC1 CHANNEL A (E:\01111774066\AMY THESIS\RESULTS\HPLC\101216\001-0101.D)
SOS
PPS
POS
SOO
PPP
POP
POO
OOO
PLP
PLO
OLO
MLP
PLL
OLL
MAG + DAG FFA
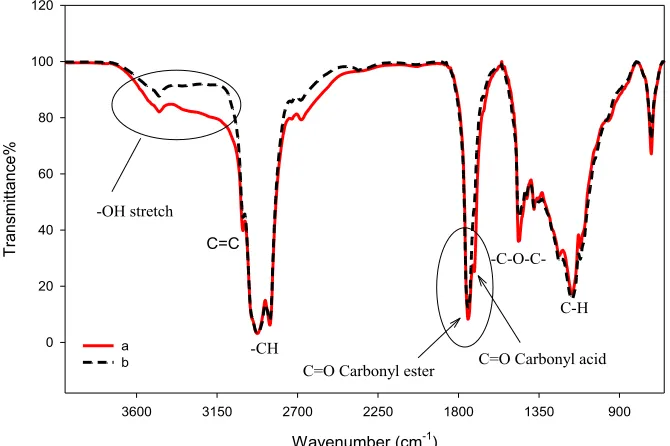
3.4 FTIR analysis
The FTIR spectra of HFFA-CPO and LFFA-CPO are shown in Figure 3. The major peaks and their assigned functional groups are shown inTable 5. The absorption band at 1712 cm1for HFFA-CPO denotes carbonyl (C=O) carboxylic acid. The absorption band is more distinct in LFFA-CPO because of the higher percentage of FFAs. Sharp absorption bands of high intensity at 1746 cm1 and 1747 cm1 for HFFA-CPO and LFFA-CPO, respectively, are assigned to functional groups of esterified carbonyl C=O. The peaks at 2927 cm1and 2855 cm1indicate CH2and CH3scissoring of HFFA-CPO and LFFA-CPO, respectively. The peak at 3005 cm1 indicates stretching aliphatic double C═C bond while the peaks of 3473 cm1 and 3474 cm1signify OH stretching of HFFA-CPO and LFFA-CPO, respectively.
4 Conclusion
In conclusion, the findings point out that HFFA-CPO contains high free fatty acid (FFAs) content, hence it is inappropriate for food applications, although useful as a source
material in the production of bioplastics, biolubricants and biodiesel. In contrast, LFFA-CPO displayed exceptional physiochemical properties and superior quality; hence it is comparably more suitable for industrial and food applications than HFFA-CPO. Based on thefindings of this study, HFFA-CPO requires pre-treatment refining stages in order to produce edible oil similar to LFFA-CPO.
Acknowledgments.The authors appreciatively acknowledge the support of Universiti Kebangsaan Malaysia for thefinancial and technical assistance for the carrying out of this research and Ministry of Science, Technology and Innovation (MOSTI) of Malaysia, which funded this projectviagrant # FRGS/2/2014/ ST01/UKM/01/2, GUP/2016/063 and Sime Darby Sdn Bhdvia
grant # ST-2014-019.
References
Abdullah BM, Yusop RM, Salimon J, Yousif E, Salih N. 2013. Physical and chemical properties analysis of Jatropha Curcas
seed oil for industrial applications.Int J Chem Nucl Mater Metall Eng7: 475–479.
Wavenumber (cm-1)
900 1350
1800 2250
2700 3150
3600
%e
cn
atti
ms
nar
T
0 20 40 60 80 100 120
a
b C=O Carbonyl acid
C=O Carbonyl ester -OH stretch
C=C
-CH
C-H
-C-O-C-Fig. 3.FTIR spectrums of (a) HFFA-CPO and (b) LFFA-CPO.
Table 5. FTIR Functional groups of HFFA-CPO and LFFA-CPO and their wavelengths.
Functional group Wavelength of HFFA-CPO Wavelength of LFFA-CPO
-OH stretching 3473 3473
C=C bending vibration (aliphatic) 3004 3005
CH stretching vibration (aliphatic) 2923, 2855 2927, 2855
C=O stretching vibration (ester) 1746 1747
C=O stretching vibration (carboxylic acid) 1712 –
C–H scissoring and bending vibration (aliphatic) 1459 1465
C–O–C stretching vibration (ester) 1235, 1165, 1118 1235, 1165, 1117
Adjei-Nsiah S, Zu A, Nimoh F. 2012. Technological and Financial assessment of small scale palm oil production in Kwaebibrem district, Ghana.J Agri Sci4: 111–120.
Agatemor C. 2006. Studies of selected physicochemical properties of
fluted pumpkin (Telfairia occidentalis Hook F.) seed oil and tropical almond (Terminalia catappiaL.) seed oil.Pak J Nutr5: 306–307.
Akinyeyea RO, Adeyeye EI, Fasakina O, Agboolaa A. 2011. Physico-chemical properties and anti-nutritional factors of palm fruit products (Elaeis Guineensis Jacq.) from Ekiti State Nigeria.
Electr J Environ Agri Food Chem10: 2190–2198.
Alabi KA, Lajide L, Owolabi BJ. 2013. Analysis of fatty acid composition ofThevetia peruvianaandHura crepitansseed oils using GC-FID.Fountain J Nat Appl Sci2: 32–37.
Amoo IA. 2004. Effect of roasting on the chemical composition of coconut (Cocos nucifera) seedflour and oil.J Food Agri Environ
2: 18–20.
Bahadi MA, Japir AW, Salih N, Salimon J. 2016. Free fatty acids separation from Malaysian high free fatty acid crude palm oil using molecular distillation.Malaysian J Anal Sci20: 1042–1051. Basiron Y. 2007. Palm oil production through sustainable plantations.
Eur J Lipid Sci Technol109: 289–295.
Basiron Y, Weng CK. 2004. The oil palm and its sustainability.J Oil Palm Res16: 1–10.
Chong CL, Kamarudin Z, Lesieur P, Marangoni A, Bourgaux C, Ollivon M. 2007. Thermal and structural behaviour of crude palm oil: crystallisation at very slow cooling rate. Eur J Lipid Sci Technol109: 410–421.
Ekwenye UN. 2006. Chemical characteristics of palm oil biodeterio-ration.Biokemistri18: 141–149.
Falade OS, Adekunle AS, Aderogba MA, Atanda SO, Harwood C, Adewusi SR. 2008. Physicochemical properties, total phenol and tocopherol of some Acacia seed oils.J Sci Food Agri88: 263–268. Fernandes E, Vicente J, Cruz R, Nele M, Nunes É, Costa-Félix R. 2014. A methodology free of pyridine for measuring hydroxyl value in polymers and oils.Polymer Testing33: 16–20. Fokou E, Achu M, Kansci G,et al.2009. Chemical properties of some
cucurbitaceae oils from Cameroon.Pak J Nutr8: 1325–1334. Gunstone F. 2011. Vegetable oils in food technology: composition,
properties and uses. Oxford: John Wiley & Sons.
Harun NS, Talip NNM, Hong LK, Jamil MSM, Yusop RM. 2013. Phase behaviour of fatty alcohol sulphate and fatty alcohol ether sulphate from Palm based.Malaysian J Anal Sci17: 139–145. Hong LK, Harun NS, Jamil MSM, Yusop RM. 2013. Phase behavior
and rheology of fatty alcohol sulphate, fatty alcohol ether sulphate from Palm based and mixtures with other surfactants.Malaysian J Anal Sci17: 101–108.
Isaac Bamgboye A, Adejumo OI. 2010. Physicochemical properties of Roselle seed oil.Nutr Food Sci40: 186–192.
Japir AAW, Salimon J, Derawi D, Bahadi M, Yusop MR. 2016a. Purification of high free fatty acid crude Palm oil using molecular distillation.Asian J Chem28: 2549–2554.
Japir AAW, Salimon J, Derawi D, Bahadi M, Yusop MR. 2016b. Separation of free fatty acids from high free fatty acid crude palm oil using short-path distillation. In: The 2016 UKM FST postgraduate colloquium: Proceedings of the Universiti Kebang-saan Malaysia, Faculty of Science and Technology 2016 Postgraduate Colloquium (Vol. 1784, N° 1, p. 030001). AIP Publishing. DOI: 10.1063/1.4966739.
Muhamad H, Zainudin BH, Bakar NKA. 2012. Comparative study of different clean-up techniques for the determination ofl -cyhalo-thrin and cyperme-cyhalo-thrin in palm oil matrices by gas chromatogra-phy with electron capture detection.Food Chem134: 2489–2496. Neagu A-A., NiÛa I, Botez E, Geaca S. 2013. A physico-chemical study for some edible oils properties.Analele Universitatii“Ovidius” Constanta-Seria Chimie24: 121–126.
Ngando Ebongue GF, Koona P, Nouy B,et al. 2008. Identification of oil palm breeding lines producing oils with low acid values.
Eur J Lipid Sci Technol110: 505–509.
Olanrewaju AS, Moriyike OE. 2013. Physicochemical Characteristics and the effect of packaging materials on the storage stability of selected Cucurbits oils.Am J Food Nutr1: 34–37.
Pakiam R. 2013. Palm oil advances as Malaysia’s export tax may boost shipments. Kuala Lumpur: Bloomberg, Jan.
Prasanth Kumar P, Gopala Krishna A. 2014. Physico-chemical characteristics and nutraceutical distribution of crude palm oil and its fractions.Grasas y Aceites65: e018.
Prasanth Kumar P, Gopala Krishna A. 2015. Physicochemical characteristics of commercial coconut oils produced in India.
Grasas y Aceites66: e062.
Saad B, Ling CW, Jab MS,et al.2007. Determination of free fatty acids in palm oil samples using non-aqueous flow injection titrimetric method.Food Chem102: 1407–1414.
Salih N, Salimon J, Abdullah BM, Yousif E. 2013a. Thermo-oxidation, friction-reducing and physicochemical properties of ricinoleic acid based-diester biolubricants. Arab J Chem. Available from:http://dx.doi.org/10.1016/j.arabjc.2013.08.002.
Salih N, Salimon J, Yousif E, Abdullah BM. 2013b. Biolubricant basestocks from chemically modified plant oils: ricinoleic acid based-tetraesters.Chem Centr J7: 1–13.
Salimon J, Ahmed WA. 2012. Physicochemical characteristics of tropical Jatropha curcas seed oil.Sains Malaysiana41: 313–317. Salimon J, Abdullah BM, Salih N. 2012. Saponification ofJatropha curcas seed oil: optimization by D-optimal design.Int J Chem Eng2012: 6. DOI:10.1155/2012/574780.
Sambanthamurthi R, Sundram K, Tan Y-A. 2000. Chemistry and biochemistry of palm oil.Progr lipid Res39: 507–558. Sue TT, Pantzaris T. 2009. Pocketbook of palm oil uses (6th ed).
Kuala Lumpur, Malaysia: Malaysian Palm Oil Board.
Tan C-H., Ghazali HM, Kuntom A, Tan C-P., Ariffin AA. 2009. Extraction and physicochemical properties of low free fatty acid crude palm oil.Food Chem113: 645–650.
Tan Y, Ainie K, Siew W, Mohtar Y, Chong C. 1997. Crude palm oil survey.Report on Project CT 351/97. Viva Report: 7.
Cite this article as: Japir AA-W, Salimon J, Derawi D, Bahadi M, Al-Shuja’a S, Yusop MR. 2017. Physicochemical characteristics of high free fatty acid crude palm oil.OCL24(5): D506.