Experimental investigation, modeling, and optimization of combined
electro-(Fenton/coagulation/flotation) process
Gilas Hosseini1, Snur Ahmadpour1, Maryam Khosravi1, Amir Hossein Mahvi2, Sang Woo Joo3, Hiua Daraei1
1 Environmental Health Research Center, Kurdistan University of Medical Sciences, Sanandaj, Iran
2 Center for Solid Waste Research, Institute for Environmental Research AND School of Public Health, Tehran University of Medical Sciences, Tehran, Iran
3 School of Mechanical Engineering, Yeungnam University, Gyeongsan 712-749, Republic of Korea
Abstract
In this study, a combined electro-(Fenton/coagulation/flotation) (EF/EC/El) process was studied via degradation of Disperse Orange 25 (DO25) organic dye as a case study. Influences of seven operational parameters on the dye removal efficiency (DR%) were measured: initial pH of the solution (pH0), applied voltage between the anode and cathode (V), initial ferrous ion concentration (CFe), initial hydrogen peroxide concentration (CH2O2), initial DO25
concentration (C0), applied aeration flow rate (FAir), and process time (tP). Combined design of experiments (DOE) was applied, and experiments were conducted in accordance with the design. The experimental data were collected in a hand-made laboratory-scaleglass cylindrical batch reactor equipped with four graphite barcathodes, an aluminum sheet anode, an aeration pump equipped with an air filter and air distributer, a 150-rpm mixer, and a DC power supply. A DR% of 98 was achieved with a pH0 of 4, V of 10, CFe of 7.5, CH2O2 of 0, C0 of 140, and
FAir of 0. The data were used for modeling using normal and reduced multiple regression models (MLR & r-MLR) and artificial neural networks (ANN & r-ANN). Further statistical tests were applied to determine the models’ goodness and to compare the models. Based on statistical comparison, ANN models clearly outperformed the stepwise multiple linear regression (SMLR) models. Finally, an optimization process was carried out using a genetic algorithm (GA) over the outperformed ANN model. The optimization procedure was used to determine the optimal operating conditions of the combined process.
KEYWORDS: Fenton Reagents Concentration, Artificial Neural Network, Genetic Algorithm, Dye Removal Efficiency, Electro-(Fenton/Coagulation/Flotation)
Date of submission: 22 Oct 2015, Date of acceptance: 13 Jan 2016
Citation: Hosseini G, Ahmadpour S, Khosravi M, Mahvi AH, Joo SW, Daraei H. Experimental
investigation, modeling, and optimization of combined electro-(fenton/coagulation/flotation) process. J Adv Environ Health Res 2016; 4(2): 120-8.
Introduction
1Several methods have been developed for the removal of organic pollutants to decrease their impact on the environment, including adsorption,1-4 photocatalysis,5 oxidation
processes,6 and microbiological degradation.7
The application of techniques,8
electro-flotation,9 Fenton,10 electro-Fenton,11
Corresponding Author:
Hiua Daraei
Email: [email protected]
coagulation, and electro-coagulation processes,12 as well as some combinations of
these methods has also been assessed in recent years. The previous reports revealed that the efficiency of pollutant removal depends on the method and operational parameters.6,13,14
The difficulties in degradation of new resistant organic compounds have inspired research to use combined procedures to increase efficiency and reduce process time by using synergetic effects. But there are
drawbacks of the complex design of a combined reactor and the interference of coupled methods in a common reactor. Finding the proper combination of methods with high compatibility is a new research interest.
The electrocoagulation (EC), electro-Fenton (EF), and electroflotation (EL) techniques are considered to be potentially effective approaches to treat several types of wastewaters.15,16 EC consists of metallic
hydroxide flocs generation within the wastewater by electro-dissolution of soluble anodes, which are usually made of iron or aluminum. The hydrogen gas produced at the cathode in the electrocoagulation unit could create and float the flocs. In other words, EC mainly plays a role in destabilizing and aggregating fine particles, and EL is responsible for floating the flocs formed in the effluent of EC unit. It makes it easy to use the synergetic effect of both EC and EL. In addition, because EC happens in the anode and floatation happens in the cathode, there is no interference between the processes. The several publications about EC and EF prove the compatibility of the combined methods.17
The oxidation of alcohols in the presence of H2O2 and Fe(H2O)62+ was reported by Fenton in
1894.18 Among the advanced oxidation
processes (AOPs), Fenton’s treatment was found to be effective for treating wastewater containing several organic pollutants such as phenols, aniline, herbicides, and dyes. Fenton’s treatment has two different stages. First, Fenton’s oxidation occurs based on hydroxyl radicals (°OH), and second, Fenton’s coagulation occurs based on ferric coagulation following the oxidation stage. Insitu generation of Fenton reagents induced by electrochemistry has become the focus of increasing research because it can oxidize organic compounds quickly and economically. Many persistent organic pollutants have successfully been degraded by the method. This process consists of electrogeneration of H2O2 by the reduction of
dissolved oxygen on the electrodes such as
graphite, a mercury pool, carbon fiber, carbon-felt, carbon-polytetrafluoroethylene, and generation of Fe2+ by the reduction of
externally applied Fe3+. This avoids the high
cost of H2O2, maintains an almost constant
H2O2 concentration, and regenerates Fe2+ more
effectively.19
It is important to see that H2O2 and Fe2+
production and regeneration accrue in the cathode. It makes it easy to merge the process with electrocoagulation that happens in the anode electrode. In addition, at the proper current intensity and voltage, production of H2 from the reduction of water continues in
the cathode. Then, the combined method of EC/EF/EL has a synergistic effect with no interference of processes. Although combinations of both EC/EF and EC/EL have been used and studied in water and wastewater treatment, the efficiency and effective empirical parameters of the EC/EF/EL combination have not been studied in previous research. It is important to examine the feasibility of the EC/EF/EL combination and to investigate the effects of operational variables on its performance.
The first objective of this study was to report the degradation of Disperse Orange 25 (DO25) organic dye as a case study. This was done through a synthetic aqueous solution using a simple undivided electrochemical cell equipped with an aluminium (Al) anode for electrochemical generation of Al3+ and a
graphite cathode for electrochemical regeneration of Fe2+ and H2O2 and H2
production. The second objective of the study was to investigate the effects of seven operational parameters, including initial pH of the solution (pH0), applied voltage between the anode and cathode (V), initial ferrous ion concentration (CFe), initial hydrogen peroxide concentration (CH2O2),
last objective was the application and assessment of an artificial neural network (ANN) and genetic algorithm (GA) for process modeling and optimization.13,14,20
Materials and Methods
Ferrous ammonium sulfate was used to prepare a ferrous standard solution. Thirty percent hydrogen peroxide solution (Merck, Germany) was used for stock solution preparation by dilution. The hydrogen peroxide stock solutions were standardized using a titration method with a permanganate reagent solution (Merck, Germany) that was standardized by using a standard oxalic acid reagent solution (Merck, Germany) and a titration method. DO25 (C17H17N5O2) was
purchased from AlvanSabet Co., Iran.
Stock solutions of synthetic wastewater were prepared by dissolving a desired amount of DO25 powder in distilled water. The desired concentrations of DO25 were prepared by diluting the stock solution. Graphite electrodes were purchased from KIG-Co., Iran. The characterization of the graphite electrodes is presented in table 1. Aluminum sheet electrodes were purchased from a local seller and prepared by cutting to a desired size. pH0 of the solutions was adjusted using NaOH (1 M) and H2SO4 (1 M) (Merck, Germany).
Statistical design of experiments is a useful technique for investigating a phenomenon by performing a minimum number of experiments. In this study, a 32-run Taguchi design of experiments was applied for investigation of pH0, V, CFe, CH2O2, C0, FAir, and tP using Minitab 14.
The details of the 32 designed runs are presented in table 2. Furthermore, tP was investigated in eight levels for each run. The
levels of each parameter and its interval were determined by pre-tests.20,21
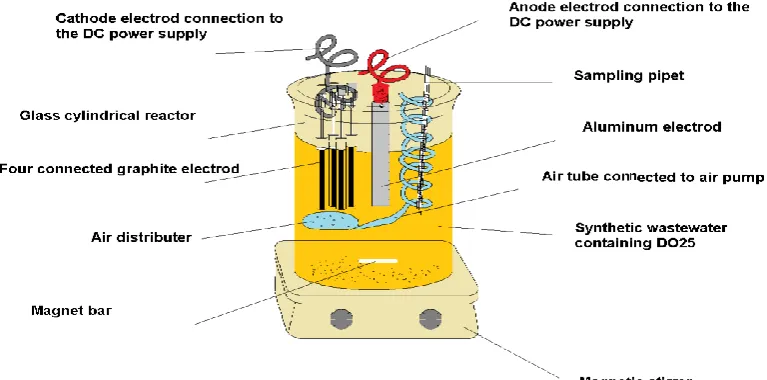
The handmade reactor consisted of an 850-ml cylindrical glass reactor (9.5 cm diameter, 12 cm height), a 120-rpm magnetic stirrer, a DC power supply (RXN-303D-II, Zhaoxin Electronic Tech. Co.), an aluminum anode, and four connected graphite cathodes. The anode was made of aluminum sheets (40 × 100 × 1 mm) with an effective immersed surface area of 40 cm2. Each cathode was made of a
graphite bar [10 mm (diameter) × 120 mm (height)] with an effective immersed surface area of 3 cm2. A cubic arrangement of four
electrodes was used to increase the effective current intensity. The electrodes were placed vertically and dipped in 500-ml synthetic waste solutions. The distance between electrodes was fixed at 1 cm (Figure 1).
In each run, a 500-ml DO25 solution was decanted into the reactor. The empirical parameters were adjusted to the desired value based on design of experiments. In each eight desired tP, a 10-ml sample was extracted at a specific position of the reactor using a sampling pipet. Samples were centrifuged for 3 minutes at 2000 rpm, and then DR% was calculated for the decanted solution. The concentration of samples was evaluated by a standard spectrophotometric method using a calibration curve and a DR5000 spectrophotometer. Because of matrix effects, λmax was extracted experimentally from the zero-time sample spectra in each run. Finally, DR% was calculated for samples using equation 1: DR% = (1-C/C0) × 100 (1)
where C0 and C are the concentration of the solution before and after the process, respectively.
Table 1. The characterization of graphite electrodes.
Characteristic Characteristic
Impregnation None Density (g/cm3) 1.70
Flexural strength (mpa) 55 Compressive strength (mpa) 155
Modulus 22.000 Rockwell ball size/load 5/100
Hardness 105 Thermal conductivity (w/mk) 12
Thermal expansion (10-6/k) 3
Table 2. The parameter levels for 32 runs.
Run pH0
V (v)
CFe (ppm)
CH2O2
(ppm) C0 (ppm)
FAir (l/min)
1 2 0 0 0 20 0
2 4 5 2.5 1.5 20 0
3 6 10 5.0 2.7 20 0
4 8 15 7.5 4.3 20 0
5 2 5 2.5 0 80 0
6 4 0 0 1.5 80 0
7 6 15 7.5 4.2 80 0
8 8 10 5.0 1.6 80 0
9 2 15 5.0 5.0 140 0
10 4 10 7.5 0 140 0
11 6 5 0 6.1 140 0
12 8 0 2.5 4.5 140 0
13 2 10 7.5 2.0 200 0
14 4 15 5.0 0 200 0
15 6 0 2.5 6.1 200 0
16 8 5 0 4.1 200 0
17 2 15 0 6.1 20 2
18 4 10 2.5 4.1 20 2
19 6 5 5.0 2.0 20 2
20 8 0 7.5 0 20 2
21 2 10 2.5 6.2 80 2
22 4 15 0 4.5 80 2
23 6 0 7.5 2.3 80 2
24 8 5 5.0 0 80 2
25 2 0 5.0 4.2 140 2
26 4 5 7.5 7.0 140 2
27 6 10 0 0 140 2
28 8 15 2.5 2.3 140 2
29 2 5 7.5 4.1 200 2
30 4 0 5.0 6.7 200 2
31 6 15 2.5 0 200 2
32 8 10 0 2.0 200 2
V: applied voltage between the anode and cathode; CFe:
initial ferrous ion concentration; CH2O2: hydrogen peroxide
concentration; C0: initial DO25 concentration; FAir: applied aeration flow rate
Results and Discussion
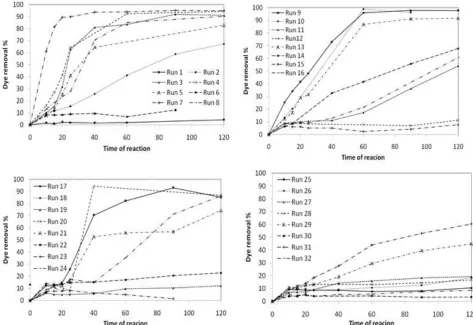
In all 32 runs, DR% of the samples at different tP was determined. The obtained DR% is presented in the four diagrams of figure 2. As can be seen from the diagrams, different operational parameters caused DR% to change from less than 1 up to 98 under experimental conditions of pH0 of 4, V of 10, CFe of 7.5, CH2O2 of 0, C0 of 140, and Fair of 0. The
combined method could be very effective to degrade DO71 when the operational parameters were fixed at the optimum conditions. Based on the results of run 7 presented in figure 2, a DR% of 90 was achievable in less than 20 minutes. This shows that the combined method could degrade the sample dye more rapidly than previously presented methods. In addition, it is clear evidence of the compatibility of the methods that were combined.
Some data were removed, and the 230 data that remained are presented in figure 2. The diagrams illustrate the influences of operational parameters on DR%.
Opposite to tP, which had obvious positive influences on DR% that were reported frequently, the influences of the six other parameters were unclear (Figure 1). It is essential to use statistical tools to clarify the parameters’ influencesand to distinguish the effective parameters for modeling and optimization.
Figure 2. The experimental dye removal efficiency (DR%) results of 32 runs
Multiple linear regression (MLR) and stepwise multiple linear regression (SMLR) were then applied to investigate the parameters’ influences. The MLR model was developed for DR%, and the statistical details of the model are shown in table 3.
Based on the coefficients presented in
table 3, among the parameters, tP, V, CH2O2,
and CFe had positive influences, which has been reported frequently and is logical too. FAir, C0, and pH had negative influences on DR%. The negative influences of pH and C0 are frequently reported in this kind of study, when the negative effect of air should be
Table 3. The multiple linear regression (MLR) and reduced multiple linear regression (r-MLR) models along with statistics of parameter influences
Parameters MLR r-MLR
coeff. St. coeff. t-value P coeff. St. coeff. t-value P
constant 1.36 - 0.29 0.77 -2.40 - -0.68 0.50
pH0 -0.90 -0.07 1.74 0.08 -
V 2.04 0.32 -1.85 0.06 2.04 0.39 9.77 ˂ 0.01
CFe 2.79 0.23 8.94 ˂ 0.01 2.81 0.27 6.70 ˂ 0.01
CH2O2 0.39 0.01 6.45 ˂ 0.01 -
C0 -0.06 -0.15 -0.31 0.75 -0.06 -0.14 -3.54 ˂ 0.01
FAir -8.84 -0.28 -4.12 ˂ 0.01 -8.47 -0.29 -7.26 ˂ 0.01
tP 0.39 0.55 -7.64 ˂ 0.01 0.39 0.51 12.76 ˂ 0.01
MLR r-MLR
Model goodness parameters F value R2 P RMSE F value R2 P RMSE 62.80 57.10 ˂ 0.01 18.00 73.70 0.59 ˂ 0.01 19.00
MLR: Multiple linear regression; r-MLR: Reduced multiple linear regression; RMSE: Root-mean-square error; Coeff: Coefficient; St. coeff
:
interpreted. It is important to see that based on the unbiased standardized coefficient presented in table 3, CH2O2 and pH almost
had a negligible effect. However, the negligible influences for H2O2 and especially
for pH are questionable, but it may accrue due to conflict of the combined methods and compensation of the negative and positive influences. Based on the unbiased parameters, tp, V, and FAir had more important influences on DR%.
The statistical parameters obtained from analysis of variances (ANOVA) showed that influences of some parameters were meaningless and should be omitted from the model. Stepwise multiple linear regressions were used to remove the meaningless variables as a common appropriate statistical tool. The reduced MLR model (r-MLR) obtained using the stepwise algorithm is presented in table 3 along with its statistical details. As presented in table 3, two parameters, pH and C0, were removed by the SMLR algorithm in a significant alpha level of 0.05.
Furthermore, table 3 and the model goodness parameters indicate that the MLR and r-MLR models did not have good predictability for DR%. This can arise from the complex mechanism of the process. The simple linear method of MLR and SMLR could not model the process and could not distinguish the nonlinear influences or interaction of the important parameters such as pH and C0. The artificial neural network (ANN) is a parallel computational procedure consisting of highly interconnected processing element groups called neurons. Owing to their inherent nature to model and learn “complexities,” ANNs have found wide applications in various areas of wastewater treatment. This has inspired us to use ANN as a more powerful nonlinear modeling approach to obtain a good predictable model. Besides, the ANN was applied to determine the importance of pH and C0 in a nonlinear ANN model. A reduced ANN (r-ANN) model and ANN model based on r-MLR and MLR model parameters were constructed.
Therefore, the seven and five operational parameters were applied as inputs of the ANN and r-ANN models, respectively, while DR% was considered as the dependent variable. The data set was randomly divided into three parts: 60% (157 data) as a training set, 20% (53 data) as a validation set, and 20% (52 data) as a testing set. The training set was used to adjust the parameters of the models, the testing set was used to calculate its estimation power, and the validation set was used to prevent over-training. A back propagation algorithm has been used because it is very fast and can be employed quite easily. The number of hidden layers, the neurons of each hidden layer, and the learning rate were determined via trial and error.
The best selected net had one hidden layer with 11 neurons and a learning rate of 0.21 (7:11:1 net) for the ANN model. The best selected net for the r-ANN model had one hidden layer with 8 neurons and a learning rate of 0.17 (5:8:1 net). The “tansig” transfer function was selected for the input and hidden layers, and “purelin” was selected for the output in both models. Once the networks were trained, the weights and bias of each neuron and layer were saved in the ANN model. Then, they were used to estimate the test set. Finally, the consistency of the ANN models was revealed by tests quantified with predictive Q2 and R2,
while the reliability or accuracy of the models was revealed by root-mean-square error (RMSE). The test results of the ANN and r-ANN model goodness are presented in table 4.
Table 4.Statistical characteristics of the artificial neural network (ANN) model
Model ANN r-ANN
Data set Train set Validation set Test set Train set Validation set Test set
R2 0.99 0.97 0.96 0.98 0.92 0.91
Q2 0.99 0.97 0.96 0.98 0.92 0.91
RMSE 2.10 6.20 5.10 3.50 9.80 7.90
ANN: Artificial neural network; r-ANN: Reduced artificial neural network; RMSE: Root-mean-square error
A genetic algorithm (GA) was used to optimize the experimental parameters using the best obtained models. A GA is an adaptive heuristic search algorithm based on the evolutionary ideas of natural selection and genetics.
The GA toolbox in MATLAB software was used for generating the optimal solution for DR% using the “ga” function. Four MATLAB functions using four MLR, r-MLR, ANN, and r-ANN models were written for creating fitness functions for the optimization problem. The DR% component to be maximized was negated in the vector valued fitness function since “ga” minimizes all the objectives. The result of the GA solution is shown in table 5.
As can be seen from table 5, the optimization process proved that the ANN and r-ANN models were more compatible with the experimental results predicting almost 99% as an optimum value of DR%. In addition, the obtained optimum values of experimental parameters were different for these four models. The ANN and r-ANN models were more powerful and accurate and should have more logical values.
In this study, the effect of initial pH was investigated in the range of pH 2 to 8. The optimum pH values were 6.1 in the ANN model and 2.1 in MLR. Both pH 2.1 and 6.1 are acidic conditions that are frequently
reported as more desirable conditions for this kind of process, but there are meaningful differences between pH 2.1 and 6.1 that can be judged by the ANN and MLR model quality. However, the low value of pH 2.1 causes more hydrogen electrogeneration or Fenton reagent efficiency, but pH 6 is in an efficient range for electrocoagulation using aluminum. It may be logical that a combination of several methods has several optimum values for one parameter like pH.
The optimum values for voltage ranged from 0.3 to 15 V. However, more voltage makes the electrodic process easy, but it can cause inversion of the efficiency in the electrocoagulation process by producing more coagulant than the efficient amount. Regarding the Fenton reagents, Fe2+ and
H2O2, the maximum available concentrations
in their investigated ranges (7.5 ppm) was selected as the optimum values by four optimization processes. This arises from the importance and strength of the Fenton and electro-Fenton methods compared to other methods. In addition, it may rise from bad range selection for these parameters.
Table 5 shows that higher C0 and lower A made it essential to apply more t. It is frequently reported that higher C0 necessitates more time for the process. In addition, less aeration makes the flotation and electro-Fenton processes weak.
Table 5. Genetic algorithm optimization result
Model Parameters
pH0 V (volt) DFe (ppm) DH(ppm) C0 (ppm) A t DR%
ANN 6.1 0.3 3.1 7.2 22 0.5 8 98.9
r-ANN - 11 6.7 - 130 2.0 20 96.5
MLR 2.1 15 7.5 7.4 21 0.0 10 56.0
r-MLR - 15 7.4 - 20 0.0 16 53.3
ANN: Artificial neural network; r-ANN: Reduced artificial neural network; MLR: Multiple linear regression; r-MLR:
Reduced multiple linear regression; V: applied voltage between the anode and cathode; DFe: Fe ion concentration;
Conclusion
The present study clearly showed the power of compatible combined methods of EF/EC/El as a fast and applicable method for degradation of DO25. The study also confirmed the deep influences of several operational parameters on the efficiency of the method. The applied design of experiment, modeling, and optimization processes were successful for obtaining the determined statistical goals. The artificial intelligence systems such as ANN and GA that were applied in the study presented acceptable performance in the modeling and optimization of the complex combined method. The statistical tools were applied to distinguish the effective operational parameters and also to determine the quantity of the influences.
Conflict of Interests
Authors have no conflict of interests.
Acknowledgements
This manuscript is extracted from the research project of the first author and approved by the Environmental Health Research Center and funded by the Kurdistan University of Medical Sciences. The authors offer their thanks to the sponsors of the project.
References
1. Asgarzadeh S, Rostamian R, Faez E, Maleki A, Daraei H. Biosorption of Pb(II), Cu(II), and Ni(II) ions onto novel lowcost P. eldarica leaves-based biosorbent: isotherm, kinetics, and operational parameters investigation. Desalination Water Treat 2016; 57(31): 14544-51.
2. Maleki A, Daraei H, Khodaei F, Aghdam KB, Faez E. Direct blue 71 dye removal probing by potato peel-based sorbent: applications of artificial intelligent systems. Desalination Water Treat 2016; 57(26): 12281-6.
3. Maleki A, Daraei H, Khodaei F, Bayazid-Aghdam K, Rezaee R, Naghizadeh A. Investigation of potato peel-based bio-sorbent efficiency in reactive dye removal: Artificial neural network modeling and
genetic algorithms optimization. J Adv Environ Health Res 2013; 1(1): 21-8.
4. Maleki A, Daraii H, Mahvi AH, Rezaee R, Ebrahimi R. Fluoride adsorption from aqueous systems using barley husk and barley husk ash. Proceedings of the 30th Conference of the. International Society for Fluoride Research, which will be held. 2012 Sep 5-8; Szczecin,Poland; 2012. 5. Maleki A, Safari M, Shahmoradi B, Zandsalimi Y, Daraei H, Gharibi F. Photocatalytic degradation of humic substances in aqueous solution using Cu-doped ZnO nanoparticles under natural sunlight irradiation. Environ Sci Pollut Res Int 2015; 22(21): 16875-80.
6. Maleki A, Daraei H, Hosseini EA, zizi S, aez E, haribi F. Azo Dye DB71 Degradation Using Ultrasonic-Assisted Fenton Process: Modeling and Process Optimization. Arab J Sci Eng (2015) 40: 295 2015; 40(2): 295-301.
7. Pandey A, Singh P, Iyengar L. Bacterial decolorization and degradation of azo dyes. Int Biodeterior Biodegradation 2007; 59(2): 73-84. 8. Horng JY, Da Huang S. Removal of organic dye
(direct blue) from synthetic wastewater by adsorptive bubble separation techniques. Environ Sci Technol 1993; 27(6): 1169-75.
9. Raghu S, Ahmed BC. Chemical or electrochemical techniques, followed by ion exchange, for recycle of textile dye wastewater. J Hazard Mater 2007; 149(2): 324-30.
10. Chen S, He S, Lou J, Xie S. Oxidation Mechanism and Application of Fenton Reagent [J]. Environmental Science and Technology. 2004; 3: 045.
11. Isarain-Chavez E, Garrido JA, Rodriguez RM, Centellas F, Arias C, Cabot PL, et al. Mineralization of metoprolol by electro-Fenton and photoelectro-Fenton processes. J Phys Chem A 2011; 115(7): 1234-42.
12. Ilhan F, Kurt U, Apaydin O, Gonullu MT. Treatment of leachate by electrocoagulation using aluminum and iron electrodes. J Hazard Mater 2008; 154(1-3): 381-9.
13. Hosseini G, Maleki A, Daraei H. Electrochemical Process for Diazinon Removal from Aqueous Media: Design of Experiments, Optimization, and DLLME-GC-FID Method for Diazinon Determination. Arab J Sci Eng 2015; 40(11): 3041-6.
14. Maleki A, Daraei H, Alaei L, Izadi LA. Dye Removal probing by electrocoagulation process: modeling by MLR and ANN methods. J Chem Soc Pak 2012; 34(5): 1056-69.
16. Mollah MY, Gomes JA, Das KK, Cocke DL. Electrochemical treatment of Orange II dye solution--use of aluminum sacrificial electrodes and floc characterization. J Hazard Mater 2010; 174(1-3): 851-8.
17. Chen G. Electrochemical technologies in wastewater treatment. Sep Purif Technol 2004; 38(1): 11-41.
18. Chacon JM, Teresa Leal M, Sanchez M, Bandala ER. Solar photocatalytic degradation of azo-dyes by photo-Fenton process. Dyes Pigm 2006; 69(3): 144-50.
19. Deng Y, Englehardt JD. Treatment of landfill leachate by the Fenton process. Water Res 2006; 40(20): 3683-94.
20. Maleki A, Mahvi A, Daraei H, Zandi S. Influence of selected anions on fluoride removal in electrocoagulation/electroflotation. Fluoride 2015; 48(1): 37-47.