DOI: 10.22103/jlst.2017.10494.1198
Comparisons of different models for lactation curves of fat to protein ratio and
somatic cell score of Holstein cows in Iran
M. S. Mokhtari
1*, M. Razmkabir
2, Y. Mohammadi
3and M. Soflaee Shahrbabak
41Department of Animal Science, Faculty of Agriculture, University of Jiroft, P.O. Box 364, Jiroft, Iran. 2Department of Animal Science, Faculty of Agriculture, University of Kurdistan, Sanandaj, Iran.
3Department of Animal Science, Faculty of Agriculture, University of Ilam, Ilam, Iran. 4Kerman Agricultural and Natural Resources Research and Education Center, AREEO, Kerman, Iran.
* Corresponding author, E-mail address: [email protected]
Abstract A total of 989,582 test-day records of 160,243 first-parity cows collected from 131 herds of Iranian Holstein dairy cows from 1995 to 2014 by the Animal Breeding and Improvement Centre of Iran, were used to determine the best model for lactation curves of fat to protein ratio (FPR) and somatic cell scores (SCS) in the first lactation. Several mathematical models including the Wood (WD), Wilmink (WL), Rook (RK), Dijkstra (DJ), Narushin-Takma (NT) and Ali and Schaeffer (AS) functions were fitted and compared by four comparison measures; adjusted coefficient of determina-tion (R2adj), residual standard deviation (RSD), Akaike's information criterion (AIC) and Durbin-Watson statistic (DW). The NT function was the best model for describing the lactation curves of FPR and SCS in terms of higher R2adj and lower RSD and AIC. The calculated values of DW for FPR and SCS under NT function were 1.99 and 1.86, respectively; implying that the existence of positive autocorrelation between residuals was not important for these traits. The Pearson's correlation coef-ficients between the actual and predicted records of SCS and FPR values were 0.98 and 0.99 (P <0.01), respectively by fitting NT function.
Keywords: non-linear models, goodness of fit, milk constituents, Holsteins Received: 22 Jun. 2017, accepted: 03 Dec. 2017, published online: 25 Dec. 2017
Introduction
Selection for milk production traits has traditionally been received more emphasis in breeding programs and selection indexes of dairy cows (Oltenacu and Broom, 2010). Dairy farm husbandry including the health, feed-ing and breedfeed-ing practices affects daily milk production and its constituents. Therefore, by applying accurate tools such as mathematical models when determining changes in milk production, the degree of the impact of the influencing factors may better identified (Ehrlich, 2011). Making appropriate management and breeding decisions requires accurate models for describing the lactation curves (Cobuci and Costa, 2012). Graphical representation of the dairy cow's milk production and its constituents against time throughout the lactation period is called the lactation curve (Sherchand et al., 1995). For example, arrangement of feeding programs might be managed according to the shape of the lactation curve (Kocak and Ekiz, 2008), while the ascending part of the curve suggests that a higher plane of nutrition should be supplied to cows; the descending part is suggestive of a
lower plane of nutrition (Sherchand et al., 1995; Tekerli et al., 2000).
At the beginning of the lactation period cows with severe energy deficiency are metabolically more stressed and show greater occurrence of diseases such as mastitis (Jamrozik and Schaeffer, 2012). Measure-ment of milk components can be easily achieved at rou-tine milk performance testing without any extra costs (Nishiura et al., 2015). Fat to protein ratio (FPR) is con-sidered an appropriate indicator trait as a measure of en-ergy balance (Buttchereit et al., 2010; Nishiura et al., 2015) and a risk factor for many diseases, including mastitis (Heuer et al., 1999).
36
that patterns of changes in FPR and SCS during lacta-tion can potentially be applied to detect mastitis in dairy cows. They also showed that FPR may be a potential and easily measurable trait to differentiate between cows that can or cannot adapt to the energy related chal-lenge of early lactation.
Namjo et al. (2016) evaluated the effects of several environmental factors such as lactation stage, produc-tion season, age at first calving, somatic cell count in milk yield, province and calving year on the occurrence of negative energy balance in Iranian dairy cows and concluded that all considered factors, except age of cow at first calving, had significant effects on the occurrence of negative energy balance. They considered fat to pro-tein ratio as a measure of energy balance. In a previous study, Pakdel et al. (2010) fitted six non-linear models including the Wood, Wilmink, Ali and Schaeffer, Rook, Nedler and Morant for describing the somatic cell score curves in the first four lactations of Iranian Holstein cows. Ghavi Hossein-Zadeh (2016) compared seven mathematical models including Brody, Wood, Dhanoa, Sikka, Nelder, Rook and Dijkstra for describing the tation curves for fat to protein ratio in the first three lac-tation periods of Iranian Holstein cows and determined Dijkstra function as the best fitted model during the first three lactations.
Patterns of changes in test day FPR and SCS throughout the lactation period can be used to identify the dairy cows with mastitis (Jamrozik and Schaeffer, 2012). In the present study, test-day records on both FPR and SCS of the same individuals were considered. Therefore, the objective of the present study was to compare six mathematical models fitted on FPR and SCS lactation curves in first-parity Iranian Holsteins and to determine the most appropriate model for de-scribing phenotypic changes of these traits in the lacta-tion period.
Materials and methods
Data and editing protocol
Data included 989,582 test-day records of 160,243 cows collected from 131 herds of Iranian Holstein dairy cows during 1995 to 2014 by the Animal Breeding and Im-provement Centre of Iran. Age of cows at first calving was restricted to be ranged from 20 to 38 months. Test-day records were limited to cows for which the first milk recording had been measured between 5 days in milk (DIM) and 60 DIM, consecutive sampling intervals of 25-35 days and lactation length was not greater than 305 days. Test-day somatic cell counts (SCC) were trans-formed into SCS applying Box-Cox transformation as the following, achieving a normal distribution:
SCS= SCCλλ-1 (1)
in which, 𝝀 was determined as -0.237 applying R soft-ware (R Development Core Team, 2016).
Fitting lactation curves
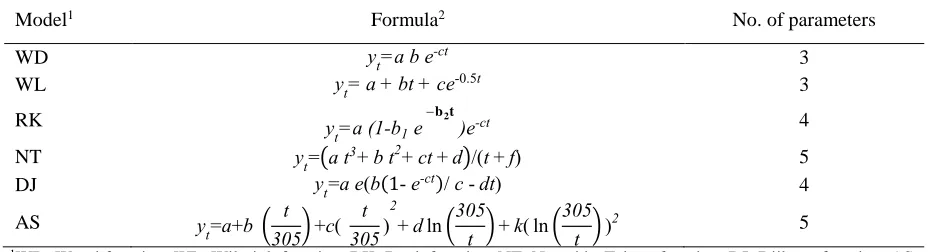
Data were analyzed using NLIN procedure and Newton-Gauss iterative method applying SAS software (SAS, 2004). The considered mathematical models were shown in Table 1, which included the Wood function (Wood, 1967), Wilmink function (Wilmink, 1987), Rook function (Rook et al., 1993), Dijkstra function (Dijkstra et al., 1997), Narushin-Takma function (Narushin and Takma, 2003) and Ali and Schaeffer (Ali and Schaeffer, 1987).
Comparison criteria
For comparing the fitted models four criteria were used including adjusted coefficient of determination (𝑅2𝑎𝑑𝑗), residualstandarddeviation(RSD), Akaike's information
Table 1. Models used to describe fat to protein ratio and somatic cell score curves of Iranian Holsteins
Model1 Formula2 No. of parameters
WD yt=a b e-ct 3
WL yt=a+bt+ ce-0.5t 3
RK y
t=a (1-b1 e t b2
)e-ct 4
NT yt=(a t3+ b t2+ ct+d)/(t+f) 5 DJ yt=a e(b(1- e-ct)/ c -dt) 4
AS y
t=a+b (
t 305)+c(
t 305)
2
+dln(305
t )+k( ln( 305
t ))
2 5
1WD: Wood function, WL: Wilmink function, RK: Rook function, NT: Narushin-Takma function, DJ: Dijkstra function, AS:
Ali and Schaeffer
2y
t: Fat to protein ratio and / or somatic cell score at time t; t: time of measurement; a, b, c, d, t and f are parameters that define
37 criterion (AIC) and Durbin-Watson statistic (DW).
The first criterion, adjusted coefficient of determina-tion or adjusted square of correladetermina-tion coefficient be-tween the actual and predicted values of FPR and/or SCS was computed as:
R2adj=1-(nn-p-1 )×(1- R2) (2)
The model with the highest adjusted R2 is the most appropriate model among the tested models.
The second criterion, residual standard deviation was computed as follows:
RSD = √SSe
√n-p (3)
The model with the lowest RSD is the most appro-priate model among the tested models. The third crite-rion was Akaike's information critecrite-rion and was com-puted as follows:
AIC=nlog (SSen ) + 2p (4)
The model with the lowest AIC is the most appropri-ate model among the tested models.
In the above mentioned comparison criteria, n is the number of observations, p is the number of model pa-rameters and SS e is the residual sum of squares.
The fourth criterion for comparing the tested models was Durbin-Watson statistic which was calculated using the following formula (Durbin, 1970):
n
t t n
i
t t
e e e
1 2 2
2 1)
( DW
(5) where et is the residual at time t, and et-1 is the residual
at time t-1. The presence of autocorrelation in the resid-uals from the regression analysis may be assessed ap-plying DW. Such autocorrelation implies that the func-tionmay beinappropriate for fitting onthe data.The
Durbin-Watson statistic ranges from 0 to 4. A value near 2 denotes a non-autocorrelation, a value toward 0 notes a positive autocorrelation and a value toward 4 de-notes a negative autocorrelation.
Results and discussion
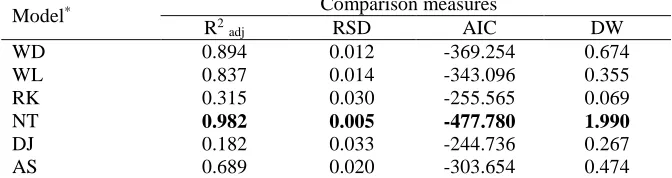
The results of model fitting for FPR under the tested models applying the considered comparison criteria are presented in Table 2. Among the tested models, NT showed better fitting in terms of the highest R2adj and the lowest RSD and AIC. The values of DW varied from 0.069 (RK) to 1.990 (NT) across the considered models; implying positive autocorrelation between residuals un-der the tested models expect for NT.
The observed and predicted FPR curves based on NT function are presented in Figure 1. A statistically signif-icant Pearson's correlation coefficient of 0.99 was ob-served between the actual and predicted milk FPR val-ues (P <0.01). In the present study, a polynomial regres-sion with R2 equal to 0.86 was fitted properly for FPR curve. The maximum value for FPR was 1.17 on 5 DIM; FPR values gradually decreased afterwards until 170 DIM which reached its minimum value (1.03). From 170 DIM, milk FPR slightly increased and reached a value of 1.05 at 305 DIM. Jamrozik and Schaeffer (2012) pointed out that FPR in first-parity cows peaked soon after parturition. Nishiura et al. (2015) reported that FPR values increased in the first few days of the lactation and reached to its peak on days 10 to 20 of the lactation period in Japanese Holstein dairy cows and de-creased afterwards until 120 DIM.
Negussie et al. (2013) reported that the phenotypic value of FPR increased from 1.32 at 8 DIM to 1.42 at 40 DIM in the first lactation of Nordic Red cattle, then decreased and stabilized at the approximately value of 1.3 from 100 to 200 DIM but it increased afterwards slightly. In early lactation, the peak of milk FPR could be ascribed to the negative energy balance and in conse-
Table 2. Model comparisons for milk fat to protein ratio in Iranian Holsteins
Model* Comparison measures**
R2 adj RSD AIC DW
WD 0.894 0.012 -369.254 0.674
WL 0.837 0.014 -343.096 0.355
RK 0.315 0.030 -255.565 0.069
NT 0.982 0.005 -477.780 1.990
DJ 0.182 0.033 -244.736 0.267 AS 0.689 0.020 -303.654 0.474
*WD: Wood function, WL: Wilmink function, RK: Rook function, NT: Narushin-Takma
function, DJ: Dijkstra function, AS: Ali and Schaeffer
**𝑅2
𝑎𝑑𝑗: Adjusted coefficient of determination, RSD: Residual standard deviation, AIC:
38
Figure 1. Observed and predicted milk fat to protein ratio curves in Iranian Holsteins
quence tissue mobilization associated with stresses of calving and peak milk production (Buttchereit et al. 2010, Toni et al. 2011, Jamrozik and Schaeffer 2012). Negussie et al. (2013) pointed out that increasing trend of milk FPR after reaching the minimum value could be explained by increased energy requirements of pregnant cows to support milk production and fetal growth. A lit-tle increase in milk FPR toward the end of the lactation period in German Holstein cows has been reported by Buttchereit et al. (2010).
Energy deficiency leads to increased lipolysis and uptake of fatty acids mobilized from body fat. There-fore, the synthesis of fat in the udder is increased (Buttchereit et al., 2010). Simultaneously, insufficient intake of fermentable, energy-spending carbohydrates can result in inadequate synthesis of protein by ruminal bacteria and the flow of amino acids to the udder is com-promised and milk protein content reduces (Buttchereit et al., 2010), consequently FPR would be increased. A value of FPR which is higher than 1.5 denotes abnor-mally high lipolysis and may be a suitable index of dis-easessuchasmastitis in dairy cows (Heuer et al., 1999).
Greater values of FPR are associated with decrease in dry matter intake and increase in fat mobilization over negative energy balance phase after calving (Eicher, 2004). Milk FPR may be considered as a practical crite-rion to differentiate between cows that can or cannot prevail the metabolically challenges associated with early lactation (Jamrozik and Schaeffer, 2012). Similar behavior to that of observed in the present study for milk FPR changes over the lactation period was documented in the previous studies (Buttchereit et al. 2010, Jamrozik and Schaeffer, 2012). For modeling milk FPR in Ger-man Holsteins, five lactation curve models including Ali and Schaeffer, Guo and Swalve, Wilmink, Legendre polynomials of third and fourth degree were fitted for milk FPR by Buttchereit et al. (2010). They reported that function of Ali and Schaeffer described changes of milk FPR more appropriately than the other considered functions.
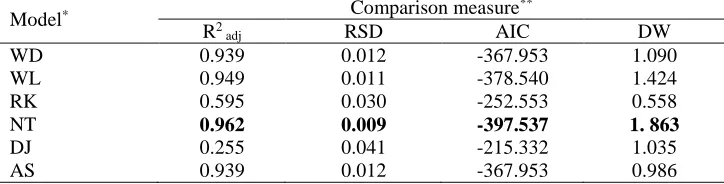
The results of model fitting for SCS in the present study under the tested models, applying the considered comparison criteria are presented in Table 3. Among the tested models,NT showedbetterfitting in terms of the
Table 3. Model comparisons for somatic cell score in Iranian Holsteins
Model* Comparison measure**
R2 adj RSD AIC DW
WD 0.939 0.012 -367.953 1.090
WL 0.949 0.011 -378.540 1.424
RK 0.595 0.030 -252.553 0.558
NT 0.962 0.009 -397.537 1. 863
DJ 0.255 0.041 -215.332 1.035
AS 0.939 0.012 -367.953 0.986
*WD: Wood function, WL: Wilmink function, RK: Rook function, NT: Narushin-Takma function,
DJ: Dijkstra function, AS: Ali and Schaeffer
**𝑅2
𝑎𝑑𝑗: Adjusted coefficient of determination, RSD: Residual standard deviation, AIC: Akaike's
in-formation criterion, DW: Durbin-Watson statistic. 0.95
1 1.05 1.1 1.15 1.2
5 15 25 35 45 55 65 75 85 95
1
0
5
1
1
5
1
2
5
1
3
5
1
4
5
1
5
5
1
6
5
1
7
5
1
8
5
1
9
5
2
0
5
2
1
5
2
2
5
2
3
5
2
4
5
2
5
5
2
6
5
2
7
5
2
8
5
2
9
5
3
0
5
F
a
t
to
pro
tein r
a
tio
Days in milk
Observed
39 highest R2adj and the lowest RSD and AIC relative to the
other considered models. The values of DW varied from 0.558 (under RK model) to 1.863 (under NT model) across the models. These values indicated positive auto-correlation between residuals with the highest for RK and the lowest for NT function. Pakdel et al (2010) fitted six non-linear models including the Wood, Wilmink, Ali and Schaeffer, Rook, Nedler and Morant for de-scribing the changes of somatic cell scores in Iranian Holstein cows and concluded that Ali and Schaeffer model fitted more appropriately than the other consid-ered models.
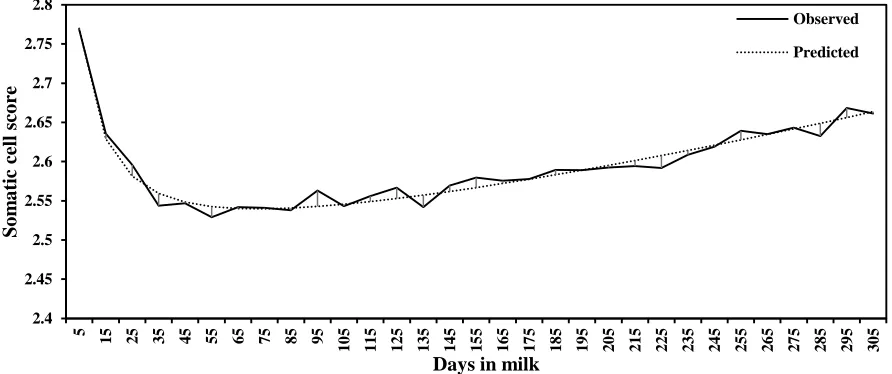
Observed and predicted SCS curves based on NT function are presented in Figure 2. In the present study, a statistically significant Pearson's correlation coeffi-cient of 0.98 was observed between the actual and pre-dicted SCS values (P <0.01). A polynomial regression with R2 equal to 0.55 was fitted properly. The value of SCS was 2.77 on 5 DIM and gradually decreased after-wards until 55 DIM of the lactation period at which it reached its minimum value (2.53). From 55 DIM, SCS gradually increased and reached a value of 2.66 at 305 DIM. Data on health traits of dairy cows are not rou-tinely recorded in dairy herds of Iran. Philipsson et al. (1995) pointed out that somatic cell count may be con-sidered as a selection criterion for mastitis resistance in dairy cattle. Therefore, indirect selection against masti-tis considers mainly somatic cell scores (SCS) as an ap-propriate correlated trait (Jamrozik and Schaeffer, 2012).
Pattern of changes in somatic cell count values dur-ing the lactation period is opposite to that of milk yield. Somatic cell count value is in maximum value at the be-ginning of the lactation period and gradually decreases until approximately 50-70 days of lactation (reaches the
minimum value) afterwards it increases toward the end of lactation period (Rodriguez-Zas et al., 2000). In the present study, lactation curve for FPR (Figure 1) was generally of a similar shape to lactation curve of SCS (Figure 2), maximum values in milk attained on days in milk immediately after calving, decreased towards the peak of lactation and steadily but slow increased toward the end of period. Such observed pattern was in agree-ment with the one observed by Jamrozik and Schaeffer (2012) in first-lactation Canadian Holstein cows.
Conclusion
Different mathematical models were investigated for determining the best fitted model for FPR and SCS changes during first lactation of Iranian Holsteins. Narushin and Takma (NT) model provided the best fit for the lactation curves of FPR and SCS in first lacta-tions of Iranian Holstein cows. The appropriate mathe-matical modeling for describing lactation curves of FPR and SCS could provide the possibility of selection on the level of the lactation curve for individual animals and is a pre-requisite to develop an optimal strategy to obtain a desired shape of lactation curve through modi-fying the parameters of models.
References
Ali, T., Schaeffer, L., 1987. Accounting for covariances among test day milk yields in dairy cows. Canadian Journal of Animal Science 67, 637-644.
Buttchereit, N., Stamer, E., Junge, W., Thaller, G., 2010. Evaluation of five lactation curve models fitted for fat:pro-tein ratio of milk and daily energy balance. Journal of Dairy Science 93, 1702-1712.
Figure 2. Observed and predicted somatic cell score curves in Iranian Holsteins
2.4 2.45 2.5 2.55 2.6 2.65 2.7 2.75 2.8
5 15 25 35 45 55 65 75 85 95
1
0
5
1
1
5
1
2
5
1
3
5
1
4
5
1
5
5
1
6
5
1
7
5
1
8
5
1
9
5
2
0
5
2
1
5
2
2
5
2
3
5
2
4
5
2
5
5
2
6
5
2
7
5
2
8
5
2
9
5
3
0
5
So
m
a
tic
ce
ll sco
re
Days in milk
Observed
40
Cobuci, J.A., Costa, C.N., 2012. Persistency of lactation using random regression models and different fixed regression modeling approaches. Revista Brasileira de Zootecnia 41, 1996-2004.
Dijkstra, J., France, J., Dhanoya, M. S., Maas, J. A., Hanigan, M. D., Rook, A. J., Beever, D. E., 1997. A model to describe growth patterns of the mammary gland during pregnancy and lactation. Journal of Dairy Science 80, 2340-2354. Durbin, J., 1970. Testing for serial correlation in least-squares
regression when some of the regressors are lagged depend-ent variables. Econometrica 38, 410-421.
Eicher, R., 2004. Evaluation of the metabolic and nutritional situation in dairy herds: diagnostic use of milk components.
Medecin Veterinaire du Quebec34, 36-38.
Ehrlich, J.L., 2001. Quantifying shape of lactation curves, and benchmark curves for common dairy breeds and parities.
The Bovine Practitioner, 45, 88-95.
Ghavi Hossein-Zadeh, N., 2016. Modelling lactation curve for fat to protein ratio in Holstein cows. Animal Science Pa-pers and Reports 34, 233-246.
Heuer, C., Schukken, Y.H., Dobbelaar, P., 1999. Postpatrum body condition score and results from the first test day milk as predictors of disease, fertility, yield, and culling in com-mercial dairy herds. Journal of Dairy Science 82, 295-304. Jamrozik J., Schaeffer L.R., 2012. Test-day somatic cell score, fat-to-protein ratio and milk yield as indicator traits for sub-clinical mastitis in dairy cattle. Journal of Animal Breeding and Genetics129, 11-19.
Kocak, O., Ekіz, B., 2008. Comparison of different lactation curve models in Holstein cows raised on a farm in the south-eastern Anatolia region. Archiv Tierzucht 51, 329-337. Namjo, M., Farhangfar, H., Bashteni, M., Eghbal, A.R., 2016.
Assessment of the impacts of different factors on the occur-rence of negative energy balance in Iranian dairy cows us-ing a logistic generalized linear model. Journal of Ruminant Research 4, 93-115.
Narushin, V., Takma, C., 2003. Sigmoid model for the eval-uation of growth and production curves in laying hens. Bio-systems Engineering, 84, 343-348.
Negussie, E., Stranden, I., Mantysaari, E.A., 2013. Genetic associations of test-day fat: protein ratio with milk yield, fertility, and udder health traits in Nordic Red cattle. Jour-nal of DairyScience 96, 1237-1250.
Nishiura, A., Sasaki, O., Aihara, M., Takeda, H., Satoh, M., 2015. Genetic analysis of fat-to-protein ratio, milk yield and somatic cell score of Holstein cows in Japan in the first three lactations by using a random regression model. Animal Sci-ence Journal86, 961-969.
Oltenacu, P.A., Broom, D.M., 2010. The impact of genetic selection for increased milk yield on the welfare of dairy cows. Animal Welfare 19, 39-49.
Pakdel, A., Heidarytabar, M., Nejati-Javaremi, A., 2010. Fit-ting non-linear models for describing milk somatic cell score at different lactations of Iranian Holstein cows. Ira-nian Journal of Animal Science, 41, 185-192.
Philipsson, J., Ral, G., Berglund, B., 1995. Somatic cell count as a selection criterion for mastitis resistance in dairy cattle.
Livestock Production Science, 41, 195-200.
R Core Team, 2016. R: A language and environment for sta-tistical computing. R Foundation for Stasta-tistical Computing, Vienna, Austria. URL https://www.R-project.org/.
Rodriguez-Zas, S. L., Gianola, D., Shook, G. E., 2000. Eval-uation of models for somatic cell score lactation patterns in Holstein. Livestock Production Science, 67, 19-30.
Rook, A.J., France, J., Dhanoa, M.S., 1993. On the mathemat-ical description of lactation curves. Journal of Agricultural Science, Cambridge 121, 97-102.
SAS, 2004. SAS User’s Guide: Statistics, Release 9.0. SAS Inst. Inc., Cary, NC.
Sherchand, L., Mcnew, R.W., Kellogg, D.W., Johnson, Z.B., 1995. Selection of a mathematical model to generate lacta-tion curves using daily milk yields of Holstein Cows. Jour-nal of Dairy Science 78, 2507-2513.
Tekerli, M., Akinci, Z., Dogan, I., Akcan, A., 2000. Factors affecting the shape of lactation curves of Holstein cows from the Balikesir province of Turkey. Journal of Dairy Sci-ence 83, 1381-1386.
Toni, F., Vincenti, L., Grigoletto L., Ricci, A., Schukken Y.H., 2011. Early lactation ratio of fat and protein percent-age in milk is associated with health, milk production, and survival. Journal of Dairy Science94, 1772-1783.
Wilmink, J.B.M., 1987. Adjustment of test day milk, fat and protein yield for age, season and stage of lactation. Live-stock Production Science 16, 307-316.
Windig, J.J., Calus M.P.L., de Jong G., Veerkamp R.F., 2005. The association between somatic cell patterns and milk pro-duction prior to mastitis. Livestock Production Science 96, 291-299.
Wood, P. D.P., 1967. Algebraic model of the lactation curve in cattle. Nature 216, 164–165.
41
لدم هسیاقم
ینحنم فلتخم یاه
لولس هرمن و نیئتورپ هب یبرچ تبسن
یاهواگ رد ریش کیتاموس یاه
ناریا نیاتشله
یراتخم یئاتس .م
1
ریبک مزر .م ،
2
یدمحم .ی ،
3
کبابرهش ییلافس .م و
4
1
.ناریا ،تفریج ،تفریج هاگشناد ،یزرواشک هدکشناد ،یماد مولع هورگ
2
،جدننس ،ناتسدرک هاگشناد ،یزرواشک هدکشناد ،یماد مولع هورگ ناریا
.
3
.ناریا ،ملایا ،ملایا هاگشناد ،یزرواشک هدکشناد ،یماد مولع هورگ
4
.ناریا ،نامرک ،یزرواشک جیورت و شزومآ ،تاقیقحت نامزاس ،نامرک ناتسا یعیبط عبانم و یزرواشک شزومآ و تاقیقحت زکرم
* :کینورتکلا تسپ ،لوئسم هدنسیون
هدیکچ
زا ینونک شهوژپ رد 989582
هب طوبرم نومزآ زور دروکر 160243
لاس یط رد هکدش هدافتسا نیاتشله واگ یاه
1384 ات 1393 رد ناریا یماد تادیلوت دوبهب و داژن حلاصا زکرم طسوت 131
زا فده .دندش یروآ عمج ششوپ تحت هلگ
من و نیئتورپ هب یبرچ تبسن ینحنم بسانم لدم نییعت شهوژپ نیا لولس هر
لدم .دوب کیتاموس یاه یضایر یاه
،دوو
نیشران ، ارتسکجیاد ،کور ،کنیملیو
فارحنا ،هدش حیحصت نییعت بیرض رایعم راهچ زا هدافتسا اب رفش و یلع و امکات
نیبرود هرامآ و کیئاکآ علاطا رایعم ،هدنام یقاب رایعم
هک دنداد ناشن هدمآ تسد هب جیاتن .دندش هسیاقم نوستاو ا
نیب ز
نیشران عبات ،هدش هسیاقم عباوت
-لولس هرمن و نیئتورپ هب یبرچ تبسن یاه ینحنم فیصوت یارب امکات رد کیتاموس یاه
یقاب رایعم فارحنا ندوب رتمک و هدش حیحصت نییعت بیرض ندوب رتشیب لیلد هب ناریا نیاتشله یاهواگ یهدریش نیتسخن ب نیرتبسانم کیئاکآ علاطا رایعم و هدنام نیبرود هرامآ هدمآ تسد هب ریداقم .دو
–
ئتورپ هب یبرچ تبسن یارب نوستاو و نی
لولس هرمن نیشران عبات تحت کیتاموس یاه
بیترت هب امکات 99
/ 1 و 86 / 1 تبثم یگتسبمه دوخ دهد یم ناشن هک دندوب
شم ریداقم نیب نوسریپ یگتسبمه بئارض .تسین مهم تفص ود نیا یارب اه هدنام یقاب نیب یب شیپ و هدش هدها
هدش ین
لولس هرمن و نیئتورپ هب یبرچ تبسن نیشران عبات تحت کیتاموس یاه
–
بیترت هب بیترت هب امکات 99
/ 0 و 98 / 0 تسد هب