WHAT PROTECT EMERGING MARKETS FROM
DEVELOPED COUNTRIES UNCONVENTIONAL
MONETARY POLICY SPILLOVER?
1Eko Sumando2
This paper investigates the macro-characteristics that reduce the spillover effect of unconventional monetary policy (UMP) from developed countries to the emerging market ones. We use event study method to examine 24 UMP announcements and a panel fixed effects model to examine the characteristics of the emerging markets. The spillover channel considered in this paper is the exchange rate. The results show inconclusiveness of the macroeconomic fundamentals role on emerging markets’ currency resilience. From three main fundamental economic indicators, only inflation was found to significantly and positively contribute to exchange rate depreciation. Deeper financial markets contribute to better resilience. Trade linkages with China provide less vulnerable currency position of the emerging markets while trade linkages with developed countries provide mixed evidence. The macro-prudential policy and the capital flow measures that the emerging markets countries implemented before to the announcements are moderately effective on reducing the spillover effect.
Abstract
Keywords: unconventional monetary policy, emerging markets, international spillover
JEL Classification: E52, E58
1 Author want to thanks Prof. Renée Fry-McKibbin (Crawford School of Public Policy, Australian National University) for her input to this research.
444 Buletin Ekonomi Moneter dan Perbankan, Volume 19, Nomor 4, April 2017
I. INTRODUCTION
The global financial crisis in 2008 had a significant impact to the design and implementation of developed countries monetary policy. In response to the crisis, the Federal Reserve Bank (FED), the European Central Bank (ECB), the Bank of England (BOE), and the Bank of Japan (BOJ) adjusted their short term interest rates to zero and applied Quantitative Easing (QE) as an alternative monetary policy strategy (Fawley & Neely 2013). The QE action included large scale purchases of government bonds and private securities, and several lending programmes (Bean 2012). Recently there has been wide interest in the impact of developed countries unconventional monetary policy not only on the country themselves but also on their international spillovers.
The International Monetary Fund (IMF) (2013) suggests that developed countries unconventional monetary policy generate greater global financial spillovers when the policy objectives were to restore the financial market stability. Global trade, liquidity and portfolio rebalancing may transmit the impact of unconventional monetary policy measures adopted in the developed countries to other countries (Chen et al., 2012). Despite this new challenge in the monetary system, few studies in literature focus on the effect of developed countries unconventional monetary policy on emerging market. Having a better understanding of the international implications of developed countries unconventional monetary policy is important for emerging market policy makers to cope better with the challenges implied by such policies.
Few studies have discussed this issue and the evidence about the effect of developed countries unconventional monetary policy on emerging market is mixed (Chen et al. 2012; Fic 2013; Fratzscher et al. 2013; Mishra et al. 2014; Moore et al. 2013). A question remains whether the emerging market macroeconomic fundamentals, financial system characteristics and macro-prudential policy are significant in reducing the spillover impacts of unconventional monetary policy. However, the focus has been on the effects of the FED’s QE. This study contributes to the existing literature in two ways: First, it fills a gap by analyzing all developed countries unconventional monetary policy, including not only the FED, but also the policy from the ECB, the BOE and BOJ between 2008 and 2012. Secondly, this study sheds new understanding on the importance of macroeconomic fundamentals, financial depth, trade linkages and macro-prudential policy in reducing the spillover of developed countries unconventional monetary policy, particularly through exchange rate as the spillover channel.
The results show unclear significance of the macroeconomic fundamentals. From three main indicators, only inflation was found to significantly contribute positively to exchange rate depreciation. Deeper financial markets contribute to better country resilience to exchange rate depreciation. Countries with higher stock market capitalization and larger liquid assets (M3) are more stable than countries that are not. Trade linkage with China provides less vulnerable currency position to the emerging markets. On the other hand, trade linkages with developed countries provide mixed evidence. Higher imports from the US and the UK contribute to higher currency volatility. Furthermore, macro-prudential policy and capital flow management measures implemented by the emerging markets prior to the unconventional monetary policy announcement were found to be moderately effective in reducing the country exchange rate depreciation from the spillover.
The rest of the paper is organized as follows: Section 2 provides literature review on unconventional monetary policy and its international spillovers, particularly to the emerging market. Section 3 describes the method and the data used in this study. Section 4 presents the estimation result and its analysis, while Section 5 concludes.
II. THEORY
2.1. Unconventional Monetary Policy
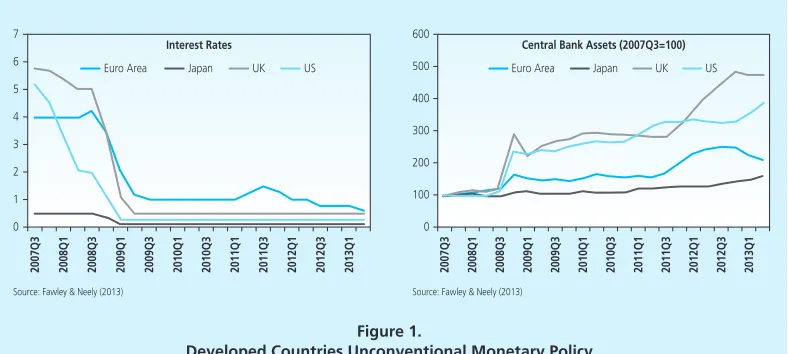
Generally, central banks implement monetary policy through managing the short term policy rate. However, facing near-zero short term interest rates, developed countries central banks have turned to unconventional monetary policies involving large scale asset purchases. The FED, the BOE, the ECB and the BOJ began to apply QE and asset purchases on a very large scale since 2008 until 2013 (Figure 1). The consequence of these policies was a large increase in central bank balance sheets. Figure 1 shows the evolution of short term interest rates in the US, the UK, the Euro Area and Japan, and the size of individual banks’ balance sheets (normalized to 100 at the beginning of August 2007) which reflects the scale of unconventional monetary policy actions (Fic 2013).
446 Buletin Ekonomi Moneter dan Perbankan, Volume 19, Nomor 4, April 2017
The IMF (2013) noted that at first the QE program was meant to prevent a financial system meltdown and strengthen financial intermediation but later the objective shifted to stimulating the economy. The QE policies are different across central banks and depend on their specific objective and different economy structures of the individual countries. For example, the FED’s and the BOE’s QE program is focused on bond purchases while the BOJ and the ECB focused on direct lending to banks. Fawley and Neely (2013) suggested that the different tools reflected different structures of these developed countries economies, in the US and the UK bond markets play a relatively more important role than banks, while it is the opposite for Europe and Japan.
2.2. The International Spillovers
The developed countries unconventional monetary policy measures had a definite impact to the emerging market countries. Emerging markets countries leaders, particularly Brazil, describes the quantitative easing is comparable to a monetary tsunami that can trigger sudden capital reversal away from emerging market countries (Fic 2013; Fratzscher et al. 2013). Some studies provide evidence about the international spillovers of developed countries unconventional monetary policy to the emerging markets. However, the studies available mainly focused on the FED policy spillovers.
Chen et al. (2012) studied the cross-border spillovers of developed countries QE to 16 emerging market countries. Using an event study method, they examine the cross-border financial market impact of the FED QE announcements of asset purchase during 2008 to 2012. They find that the FED QE announcement influenced a broad range of emerging market assets prices, raising equity prices, and lowering government and corporate bond yields.
Figure 1.
Developed Countries Unconventional Monetary Policy
7
6
5
4
3
2
1
0
Interest Rates
2007Q3 2008Q1 2008Q3 2009Q1 2009Q3 2010Q1 2010Q3 2011Q1 2011Q3 2012Q1 2012Q3 2013Q1
Euro Area Japan UK US
Source: Fawley & Neely (2013) Source: Fawley & Neely (2013)
600
500
400
300
200
100
0
Central Bank Assets (2007Q3=100)
2007Q3 2008Q1 2008Q3 2009Q1 2009Q3 2010Q1 2010Q3 2011Q1 2011Q3 2012Q1 2012Q3 2013Q1
This evidence supports the view that developed countries QE program influenced international market expectations about the strength of international capital flows to the emerging market. In other words, the QE measures increased the global liquidity through the immediate re-pricing of assets in international financial markets. Furthermore, they used a global vector error-correcting model (VECM) to measure the estimated size of the spillover and found that the size effects differed across regions. In some economies such as Hong Kong and Brazil, the expansionary impact of US quantitative easing was significant and associated with rapid credit growth and strong capital inflow, currency appreciation and inflationary pressures.
In addition, Moore et al. (2013) studied the FED large-scale asset purchases (LSAPs) announcement impact on capital flows from the US to 10 emerging market countries from 2008 to 2010. Using panel ordinary least square, they find that a 10-basis-point reduction in long-term U.S. Treasury yields contributes to almost 0.4-percentage-point increase in the foreign ownership share of emerging market debt which in turn estimated will reduce the emerging market government bond yields by almost 1.7 basis points. Their study suggests the significance of the US capital outflows to the emerging markets and its impact on the long-term emerging market government bond yields. Furthermore, the author assessed the robustness of these estimates by employing event study and vector autoregression method and find similar results in aggregates. They also find different marginal effects across emerging market countries but do not explore the country specific characteristics.
To complement the evidence about the international spillover of developed countries unconventional monetary policy, Fic (2013) investigates the effect of all unconventional monetary policy implemented four major developed countries central bank on four major developing countries: Brazil, Russia, India and China from 2008 to 2012. This means the analysis not only focused on the FED policy, but also the ECB, the BOE and the BOJ. Using the event study method, she finds that developed countries unconventional monetary policy affected exchange rates, equity prices, and long term yields.
The unconventional monetary policy has had a significant spillover through channels such as global trade, global liquidity and global portfolio rebalancing. Her event study analysis shows that the quantitative easing policy contributed to long term yields decreasing by almost 175 basis points in Brazil, and 25 basis points in Russia, India and China. The quantitative easing policy has also contributed to increases in equity prices in the Brazil, China and India.
448 Buletin Ekonomi Moneter dan Perbankan, Volume 19, Nomor 4, April 2017
2.3. The Country Characteristic and the Spillover
Fratzscher, et al. (2013) address this emerging markets characteristics issue by analyzing the global impact of the FED unconventional monetary policy from 2007 to 2010 on 65 foreign financial markets, including emerging markets, through net capital inflows and price of bonds and equity as the spillover channel. They found that the FED unconventional monetary policy has influenced the reallocation of portfolio in worldwide financial markets.
The first phase of quantitative easing triggered a rapid capital outflow from the emerging markets to the US but the next phase triggered it to the opposite direction. Furthermore, they found no evidence that exchange rate or capital account policies may aided the emerging market countries in protecting themselves from the US monetary policy spillovers. This study illustrates how US unconventional monetary policy has contributed to portfolio reallocation as well as a re-pricing of risk in global financial markets.
In addition, Eichengreen and Gupta (2014) use cross sectional regression of emerging market foreign reserves, equity prices, and exchange rates and relate the reaction of these variables to macroeconomic fundamentals and country’s financial markets characteristics. They examine the spillover effect of the FED tapering announcement from April to August 2013 and found that the tapering talk brings immediate sharp negative impact on emerging markets. Furthermore, they show that the impacts vary across countries.
Countries with higher financial depth experienced higher exchange rate depreciations. However, countries with better macroeconomics fundamentals characteristics such as lower budget deficit, lower public debt, high level of reserves, or high rate of economic growth did not experienced a significant different impact compared to those who are not. It shows that the size of the country’s financial market is a more important determinant than their macroeconomic fundamentals. This may interpreted as the global investors’ capacity to rebalance their portfolios when the target country has a relatively large and liquid financial market (IMF 2013a).
In the opposite of both studies, Mishra, et al. (2014) argue that macroeconomic fundamentals and macro-prudential policy are important in minimizing the spillover effect of US monetary policy. They conducted an event study analysis of the FED QE announcement using government bond yields, stock prices and exchange rates daily data, between January 2013 and January 2014, for 21 emerging markets.
The different period of announcements, length of data sets of countries and methodology in each paper may explain the ambiguous findings. The mixed evidence of previous studies also shows two gaps which this research will address. These are the need to cover all developed countries unconventional monetary policy spillover effects on emerging markets, and also to examine whether macro fundamentals, financial structure and macro-prudential policy is significant in minimizing spillover.
III. METHODOLOGY 3.1. Data
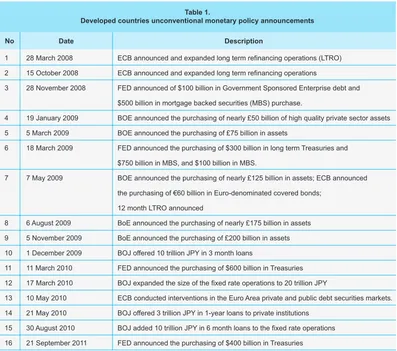
This study examined 24 unconventional monetary policy announcement events by the FED, the BOE, the ECB and the BOJ as described in Table 8 below. The key spillover channel are daily exchange rates (local currency/US$) from January 2008 to December 2012.
Table 1.
Developed countries unconventional monetary policy announcements
No 1 2 3 4 5 6 7 8 9 10 11 12 13 14 15 16 17 18 19 20 21 22 23 24
28 March 2008 15 October 2008 28 November 2008
19 January 2009 5 March 2009 18 March 2009
7 May 2009
6 August 2009 5 November 2009 1 December 2009 11 March 2010 17 March 2010 10 May 2010 21 May 2010 30 August 2010 21 September 2011 6 October 2011
8 December 2011 20 February 2012
13 September 2012 12 December 2012
9 February 2012 5 July 2012 6 September 2012
ECB announced and expanded long term refinancing operations (LTRO) ECB announced and expanded long term refinancing operations
FED announced of $100 billion in Government Sponsored Enterprise debt and $500 billion in mortgage backed securities (MBS) purchase.
BOE announced the purchasing of nearly £50 billion of high quality private sector assets BOE announced the purchasing of £75 billion in assets
FED announced the purchasing of $300 billion in long term Treasuries and $750 billion in MBS, and $100 billion in MBS.
BOE announced the purchasing of nearly £125 billion in assets; ECB announced the purchasing of €60 billion in Euro-denominated covered bonds;
12 month LTRO announced
BoE announced the purchasing of nearly £175 billion in assets BoE announced the purchasing of £200 billion in assets BOJ offered 10 trillion JPY in 3 month loans
FED announced the purchasing of $600 billion in Treasuries BOJ expanded the size of the fixed rate operations to 20 trillion JPY
ECB conducted interventions in the Euro Area private and public debt securities markets. BOJ offered 3 trillion JPY in 1-year loans to private institutions
BOJ added 10 trillion JPY in 6 month loans to the fixed rate operations FED announced the purchasing of $400 billion in Treasuries BOE announced the purchasing of nearly £275 billion in assets;
ECB announced the purchasing of €40 billion in Euro-denominated covered bonds ECB LTRO expanded, 36 month LTRO announced
FED announced the purchasing of long term securities and sell short term securities; at the pace of about $45 billion per month
FED announced the purchasing of $40 billion of MBS per month
FED announced the purchasing of $45 billion of long term Treasuries per month without sterilization
BOE announced the purchasing of £325 billion in assets BOE announced the purchasing of £375 billion in assets
ECB announced the potential purchasing of the debt of countries that applied to the European Stabilization Mechanism in unlimited amounts on the secondary market.
Date Description
450 Buletin Ekonomi Moneter dan Perbankan, Volume 19, Nomor 4, April 2017
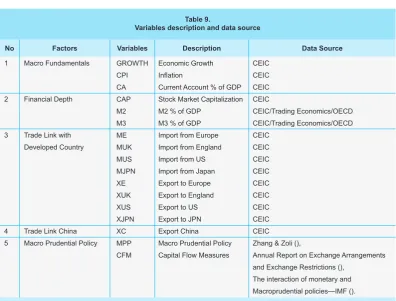
The study used data from 15 emerging markets including Brazil, Colombia, Chile, Indonesia, India, Korea, Mexico, Malaysia, Philippines, Peru, Russia, South Africa, Singapore, Turkey and Thailand. The selected country macro-characteristics are decomposed into several categories: (a) macroeconomics fundamentals: growth rate, inflation, and the ratio of current account balance to GDP; (b) financial depth: the ratio of stock market capitalization to GDP, the ratio of M2 to GDP and the ratio of M3 to GDP ratio; (c) trade linkage with Developed Countries: the United States, the United Kingdom, Europe area and Japan; (d) trade linkage with China, and (e) macro-prudential policy and or capital flow measures implemented by the countries fiscal and monetary authorities. Table 9 (Appendix) listed the variables description and data source are. All the variables occurred a quarter before the event.
The data for the macro-prudential policy and the capital flow management measure conducted by emerging market countries during 2008 to 2012 are taken from Zhang and Zoli (2014), and the IMF (2012) policy paper about the interaction of monetary and macro-prudential policies and the Annual Report on Exchange Arrangements and Exchange Restrictions (IMF 2013c).
3.2. Method
Following Mishra et al. (2014) we employ two steps method; first, an event study analysis to examine the significance of each event to the change of the exchange rate in two-day window (a day before and a day after the event). Secondly, panel fixed effect model is used to examine
Table 1.
Developed countries unconventional monetary policy announcements
No 1 2 3 4 5 6 7 8 9 10 11 12 13 14 15 16 17 18 19 20 21 22 23 24
28 March 2008 15 October 2008 28 November 2008
19 January 2009 5 March 2009 18 March 2009
7 May 2009
6 August 2009 5 November 2009 1 December 2009 11 March 2010 17 March 2010 10 May 2010 21 May 2010 30 August 2010 21 September 2011 6 October 2011
8 December 2011 20 February 2012
13 September 2012 12 December 2012
9 February 2012 5 July 2012 6 September 2012
ECB announced and expanded long term refinancing operations (LTRO) ECB announced and expanded long term refinancing operations
FED announced of $100 billion in Government Sponsored Enterprise debt and $500 billion in mortgage backed securities (MBS) purchase.
BOE announced the purchasing of nearly £50 billion of high quality private sector assets BOE announced the purchasing of £75 billion in assets
FED announced the purchasing of $300 billion in long term Treasuries and $750 billion in MBS, and $100 billion in MBS.
BOE announced the purchasing of nearly £125 billion in assets; ECB announced the purchasing of €60 billion in Euro-denominated covered bonds;
12 month LTRO announced
BoE announced the purchasing of nearly £175 billion in assets BoE announced the purchasing of £200 billion in assets BOJ offered 10 trillion JPY in 3 month loans
FED announced the purchasing of $600 billion in Treasuries BOJ expanded the size of the fixed rate operations to 20 trillion JPY
ECB conducted interventions in the Euro Area private and public debt securities markets. BOJ offered 3 trillion JPY in 1-year loans to private institutions
BOJ added 10 trillion JPY in 6 month loans to the fixed rate operations FED announced the purchasing of $400 billion in Treasuries BOE announced the purchasing of nearly £275 billion in assets;
ECB announced the purchasing of €40 billion in Euro-denominated covered bonds ECB LTRO expanded, 36 month LTRO announced
FED announced the purchasing of long term securities and sell short term securities; at the pace of about $45 billion per month
FED announced the purchasing of $40 billion of MBS per month
FED announced the purchasing of $45 billion of long term Treasuries per month without sterilization
BOE announced the purchasing of £325 billion in assets BOE announced the purchasing of £375 billion in assets
ECB announced the potential purchasing of the debt of countries that applied to the European Stabilization Mechanism in unlimited amounts on the secondary market.
Date Description
Source: Fawley & Neely (2013)
Table 1.
the relation of the change in the exchange rate with the countries macroeconomic characteristics a quarter before the event.
Examining the Announcement Event
An event study analysis was used to examine the developed countries unconventional monetary policy announcements, because this method is able to capture the impact of an event in a short time window, since the spillover effects of developed countries unconventional monetary policy is expected to rapidly transmit around the date of the event. This method is also used in previous studies (Chen et al. 2012; Fic 2013; Mishra et al. 2014). The “events” or the dates of the FED, the ECB, the BOE and the BOJ announcements and market reactions around these events will be pooled around each year period. These events will be analyzed using model (1).
(1)
(i)
(ii)
where is the exchange rate change (two-day window) of country c at the event i; is a dummy for the announcement event i. This model will provide a matrix of the change in exchange rate of emerging market countries when an unconventional moneta2ry policy announcement happened.
A pooled time-series analysis will be used to measure the significance and the size of the coefficient β. Positive β coefficient indicates exchange rate depreciation while negative β coefficient indicates exchange rate appreciation. In this study, the event that contribute to exchange rate depreciation will be classified as a negative event ( ).
Measuring the Change in the Exchange Rate
In order to standardized the change of the exchange rate (local currencies/US$) of emerging markets countries ( ), this study used two measurement of change which are the logarithm change after and before the event described in (i) and the mean deviation of the log change in the year when the event i occurs described in (ii).
452 Buletin Ekonomi Moneter dan Perbankan, Volume 19, Nomor 4, April 2017
where is the change in exchange rate of country c, at the announcement event i which come from the log of exchange rate of country c, at the time of the event i ( ) minus the mean of log of exchange rate of country c in the year when the event i occurs( ) divided by the standard deviation of log of exchange rate of country c in the same year ( ).
Significance of Macroeconomic Characteristics
Secondly, panel regressions will be estimated by pooling the events across the emerging markets. The panel fixed effects regressions in model (2) will examine the relationship of the exchange rate changes of the negative events with each country characteristics and the event and characteristics interactions. The panel fixed effects model also used in previous studies (Eichengreen & Gupta 2014; Moore et al. 2013)
The model specification is as follows:
(2)
where is a dummy for negative event i (when the country experienced exchange rate depreciation), is the country c macroeconomics and financial system characteristic a quarter before the event, is the country-fixed effect. controls country characteristics that are not varying over time. Country fixed effects also control for other country variables which are not likely to change over the one year period. can be time varying and non-time varying. For regressions where is time-invariant, the variable will be collinear with the country fixed effect and will drop out. is the coefficient of interaction variable that capture the effect of the event and country characteristics at the same time.
IV. RESULT AND ANALYSIS
4.1. The Announcements Effect of Unconventional Monetary Policy
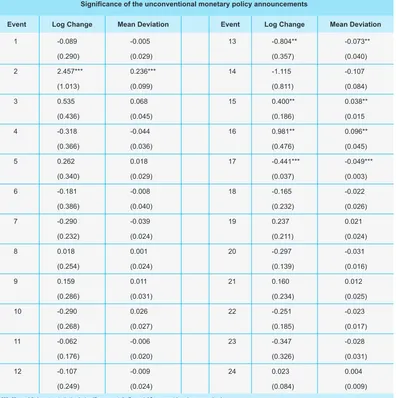
An event study method used to examine the immediate markets reactions around the unconventional monetary policy event announcement listed in Table 8. The method employs Equation (1) which relates the two-day logarithm change (i) and the mean deviation to the exchange rate logarithm change (ii) to a constant and a dummy of the events.
The first significant and strongest markets’ reaction is on October 15 2008, when the ECB announced and expanded long term refinancing operations. This event is happen at the same time with the beginning of the GFC episode in 2008. The significant currency depreciation among emerging market on this day is consistent with Fic (2014) and Chen et al. (2012), where they noted that the ECB measures to stabilize the macroeconomic condition in Europe and the GFC contributed significantly to net capital outflows from emerging markets. These findings may indicate that ECB unconventional monetary policy measures may have intensified the magnitude of the capital outflow at the time of crisis.
The next significant reaction is on September 21, 2011, when the FED announced the purchasing of US$ 400 billion US Treasury securities. This action by the FED that focused on purchases of US Treasury securities primarily aimed to stimulate the US economy by lowering yields, and pushing up asset prices in riskier market segments (Fratzscher et al. 2013). This action builds pressure to the emerging markets currency. Furthermore, Figure 3 (Appendix) shows that 13 out of 15 countries experienced exchange rate depreciation at this date. Only Turkey and Indonesia do not experience the currency depreciation impact.
The last significant depreciation event is on August 30 2010, when the BOJ added 10 trillion JPY in 6 month loans to the fixed rate operations. The BOJ central bank balance sheet policies have a small but significant financial spillover. This policy might have had negative spillover on some trade competitors via the exchange rate channel (IMF 2013b).
454 Buletin Ekonomi Moneter dan Perbankan, Volume 19, Nomor 4, April 2017
Table 2.
Significance of the unconventional monetary policy announcements
Event Log Change Mean Deviation Event Log Change Mean Deviation
1 2 3 4 5 6 7 8 9 10 11 12 -0.089 (0.290) 2.457*** (1.013) 0.535 (0.436) -0.318 (0.366) 0.262 (0.340) -0.181 (0.386) -0.290 (0.232) 0.018 (0.254) 0.159 (0.286) -0.290 (0.268) -0.062 (0.176) -0.107 (0.249) -0.005 (0.029) 0.236*** (0.099) 0.068 (0.045) -0.044 (0.036) 0.018 (0.029) -0.008 (0.040) -0.039 (0.024) 0.001 (0.024) 0.011 (0.031) 0.026 (0.027) -0.006 (0.020) -0.009 (0.024) 13 14 15 16 17 18 19 20 21 22 23 24 -0.804** (0.357) -1.115 (0.811) 0.400** (0.186) 0.981** (0.476) -0.441*** (0.037) -0.165 (0.232) 0.237 (0.211) -0.297 (0.139) 0.160 (0.234) -0.251 (0.185) -0.347 (0.326) 0.023 (0.084) -0.073** (0.040) -0.107 (0.084) 0.038** (0.015 0.096** (0.045) -0.049*** (0.003) -0.022 (0.026) 0.021 (0.024) -0.031 (0.016) 0.012 (0.025) -0.023 (0.017) -0.028 (0.031) 0.004 (0.009)
***, **, and * denote statistical significance at 1, 5, and 10 percent levels respectively
This event study method results used a pool time-series regression to analyze relation in the change in the emerging markets exchange rate and the dummy for the unconventional monetary policy announcements.
Overall, these findings are consistent with the results from Chen et al. (2012) and Fic (2013) that suggest developed countries unconventional monetary policies contributes to some capital flow episodes between developed countries and the emerging markets.
4.2. Market Reaction and Country Characteristics Macro Fundamentals
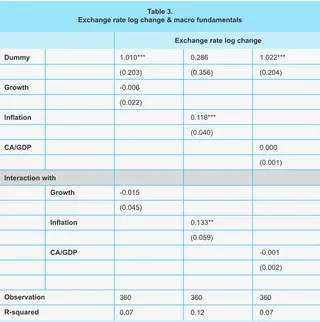
The results in Table 3 show that the exchange rates for emerging markets are differentiated only on the basis of inflation. Countries with higher inflation have higher depreciation of their exchange rate. This is rather unexpected because unlike the current account balance and economic growth which is a macroeconomic indicator for countries’ trade and output, inflation only indicates price changes. The coefficient is significant and suggests that a country with a 1 per cent higher inflation rate will have higher currency depreciation by 0.11 percentage points compared to other countries. The interaction term shows that inflation will reinforce exchange rate depreciation only if it occurs at the same time with the announcements.
Table 3.
Exchange rate log change & macro fundamentals
Exchange rate log change
Dummy
Growth
Inflation
CA/GDP
Interaction with
1.010*** (0.203) -0.006 (0.022)
0.286 (0.356)
0.118*** (0.040)
1.022*** (0.204)
0.000 (0.001)
Growth
Inflation
CA/GDP
Observation R-squared
-0.015 (0.045)
360 0.07
0.133** (0.059)
360 0.12
-0.001 (0.002)
360 0.07
456 Buletin Ekonomi Moneter dan Perbankan, Volume 19, Nomor 4, April 2017
These findings contradict the Mishra et al. (2014) study that suggests the current account and growth rate before the announcements affects emerging market resilience. However, it is consistent with evidence from Chen et al. (2012) that shows that countries with better fundamentals such as a current account surplus does not perform differently to countries that are have a deficit.
This may happen due to the different episodes in the unconventional monetary policy announcements in each studies. Mishra et al. (2014) studied 2013-2014 FED announcements, Chen et al. (2012) studied 2008-2012 FED announcements and this paper studied the FED, the BOE, the ECB and the BOJ announcements from 2008 to 2012. In other words, there might be less heterogeneity on the basis of macro-fundamentals around the announcements in this study and Chen et al. (2012) study.
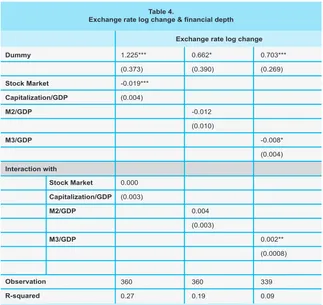
Financial Depth
Table 4 shows countries with deeper financial markets are less vulnerable compared to those that are not. The result holds for standard measures of financial depth such as the stock market capitalization to GDP ratio and the M3 to GDP ratio except the M2 to GDP ratio.
Table 4.
Exchange rate log change & financial depth
Exchange rate log change
Dummy
Stock Market Capitalization/GDP M2/GDP
M3/GDP
Interaction with
1.225*** (0.373)
-0.019*** (0.004)
0.662* (0.390)
-0.012 (0.010)
0.703*** (0.269)
-0.008* (0.004)
Stock Market Capitalization/GDP M2/GDP
M3/GDP
Observation R-squared
0.000 (0.003)
360
0.27
0.004 (0.003)
360
0.19
0.002** (0.0008)
339
This result indicates countries with more liquid capital market and had large liquid assets have better stance in mitigating the spillover than countries that are do not have large liquid assets. However, the magnitude of the impact is relatively weak. This result is consistent with Mishra et al. (2014) and Bowman et al. (2014) who find that financial depth tends to enhance countries’ resilience to shocks because their deep markets facilitated the fine-tuning needed in capital flows and portfolios rebalancing
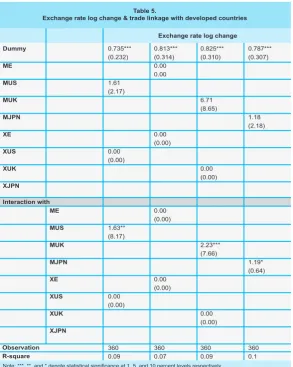
Trade Linkage with Developed Countries
The effects of developed countries unconventional monetary policy on emerging markets could also transmit directly through the external demand or trade channel. Quantitative easing may increase the demand for emerging markets goods and services through easier trade credit and increase developed countries spending (Chen et al. 2012). However, such impacts depend on the developed countries trade elasticity.
Table 5.
Exchange rate log change & trade linkage with developed countries
Exchange rate log change Dummy
ME
MUS
MUK
MJPN
XE
XUS
XUK
XJPN
Interaction with
0.735*** (0.232)
1.61 (2.17)
0.00 (0.00)
0.813*** (0.314) 0.00 0.00
0.00 (0.00)
0.825*** (0.310)
6.71 (8.65)
0.00 (0.00)
0.787*** (0.307)
1.18 (2.18)
ME
MUS
MUK
MJPN
XE
XUS
XUK
XJPN
Observation R-square
1.63** (8.17)
0.00 (0.00)
360 0.09
0.00 (0.00)
0.00 (0.00)
360 0.07
2.23*** (7.66)
0.00 (0.00)
360 0.09
1.19* (0.64)
458 Buletin Ekonomi Moneter dan Perbankan, Volume 19, Nomor 4, April 2017
Table 5 describes the impact of trade linkages with developed countries. It shows that countries with higher import from the US and UK experience a higher depreciation of currencies. This result indicates quantitative easing’s ability to initiate carry trades and capital flows into developed countries when it is able to push consumer demand and increase asset prices.
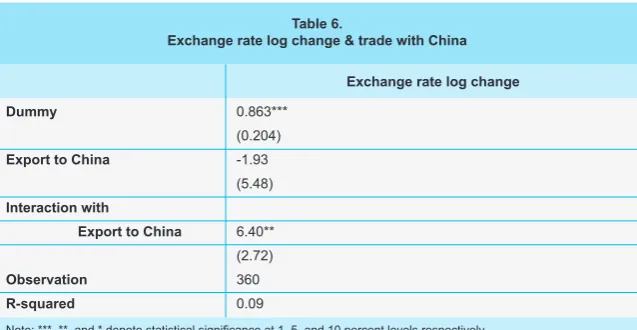
Trade Linkage with China
Results in Table 6 show that countries with higher trade exposure to China have a much lower currency depreciation at the announcement event. Exposure to China is measured by the sum of a country’s exports to and imports from China as a ratio of its GDP. This result supports Mishra (2014) that suggest that greater trade linkage to other big economies offers better opportunity for diversifying risks, which helps reduce emerging market countries reactions to the developed countries unconventional monetary policy.
Table 6.
Exchange rate log change & trade with China
Exchange rate log change Dummy
Export to China
Interaction with
Export to China
Observation R-squared
0.863*** (0.204) -1.93 (5.48)
6.40** (2.72) 360 0.09
Note: ***, **, and * denote statistical significance at 1, 5, and 10 percent levels respectively
The coefficient on the interaction between the negative event dummy and exposure to China is negative and statistically significant. Countries with stronger trade links to China were less hit during the volatility episodes. These results can be interpreted as linkages with China acting as a buffer, whereby investors tend to display more confidence in countries which have greater exposure to China.
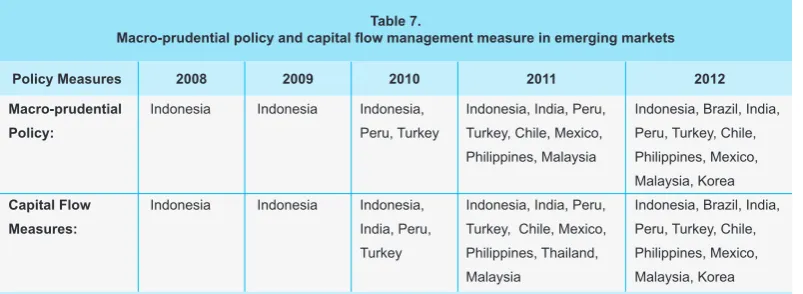
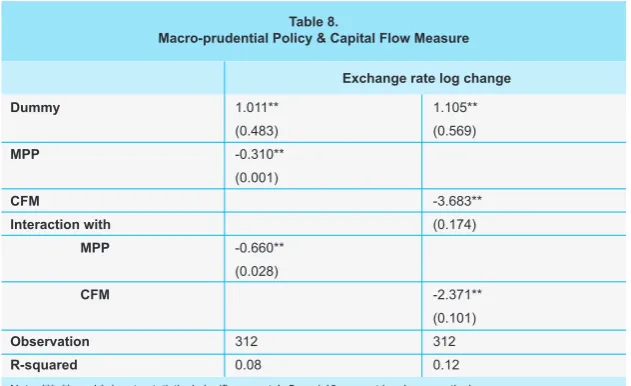
Macro Prudential Policy & Capital Flow Measures
reserve requirements, limits on assets acquisition and limits on bank lending in foreign exchange. While, the capital flow measures includes limits on borrowing abroad, restrictions on purchase of foreign assets, taxes on capital inflows and minimum stay requirements for new capital inflows.
Table 7.
Macro-prudential policy and capital flow management measure in emerging markets
Policy Measures 2008 2009 2010 2011 2012
Macro-prudential Policy:
Capital Flow Measures:
Indonesia
Indonesia
Indonesia
Indonesia
Indonesia, Peru, Turkey
Indonesia, India, Peru, Turkey
Indonesia, India, Peru, Turkey, Chile, Mexico, Philippines, Malaysia
Indonesia, India, Peru, Turkey, Chile, Mexico, Philippines, Thailand, Malaysia
Indonesia, Brazil, India, Peru, Turkey, Chile, Philippines, Mexico, Malaysia, Korea Indonesia, Brazil, India, Peru, Turkey, Chile, Philippines, Mexico, Malaysia, Korea
Source: Zhang & Zoli (2014), The interaction of monetary and Macroprudential policies (IMF 2012) and Annual Report on Exchange Arrangements and Exchange Restrictions (IMF 2013c).
Table 8 shows that emerging market countries with tighter macro-prudential policies and capital flow measures prior to the event experienced less exchange rate depreciation. The coefficient in the estimation results shows that capital flow measures are far more effective to maintain exchange rate stability.
These results support Mishra et al. (2014) and contradict Fratzscher et al. (2013) about the importance of macro-prudential policy and capital control measures to mitigate sudden capital reversals. This may imply that such measures tend to change the composition of investment in emerging countries towards less volatile and risky items.
460 Buletin Ekonomi Moneter dan Perbankan, Volume 19, Nomor 4, April 2017
Table 8.
Macro-prudential Policy & Capital Flow Measure
Exchange rate log change Dummy
MPP
CFM
Interaction with MPP
CFM
Observation R-squared
1.011** (0.483) -0.310** (0.001)
-0.660** (0.028)
312 0.08
1.105** (0.569)
-3.683** (0.174)
-2.371** (0.101) 312 0.12
Note: ***, **, and * denote statistical significance at 1, 5, and 10 percent levels respectively
At the same time, the results may imply that capital flow liberalization carries risks, which are magnified when countries do not have sufficient levels of financial and institutional development. The risks include heightened macroeconomic volatility and vulnerability to crises or external spillover. In the absence of adequate financial regulation and supervision, financial openness can create incentives for financial institutions to take excessive risks, leading to more volatile flows that are prone to sudden reversal (IMF 2013b).
V. CONCLUSION
This study examined the impact of unconventional monetary policy measures adopted in developed countries (the US, UK, Euro Area and Japan) on 15 emerging market countries from 2008 to 2012. The method was decomposed into two steps. First, event study techniques were used to study the impact of 24 QE announcements on the exchange rate change of emerging market countries. Then, panel fixed effect model was used to analyze the characteristics of the country that suffer the spillover effect before the announcements.
The event study results shows five announcements events that contributes significantly to exchanges rate changes in 15 emerging markets. Three announcements contribute to exchange rate depreciation while two announcements contribute to exchange rate appreciation. The significant exchange rate changes indicate sudden capital flows between developed countries and the emerging market countries.
This result consistent with other studies and indicate that the more liquid the countries financial market the better the country in adjusting to global monetary change (Eichengreen & Gupta 2014; Mishra et al. 2014). The trade linkage with China is beneficiary for emerging markets, the higher the net export volume to china, the less vulnerable they are to currency depreciation. On the other hand, higher imports from the US and the UK contribute to higher exchange rate depreciation. Macro-prudential policy and capital flow measure contributes significantly to the country resilience to the spillovers.
This study is consistent with Mishra et al. (2014) and contradicts Fratzscher et al. (2013) about the importance of macro-prudential policy and capital flow management measures. This paper also highlights the IMF (2013) notes about the efficacy of macro-prudential policy and capital flow management regulation to mitigate global risk on the emerging markets.
One policy implication for emerging market country policy makers is the need to employ macro-prudential policy and capital flow management measure to face possible sudden capital reversal when developed countries central banks conduct large scale asset purchases. Furthermore, policymakers in emerging markets need to emphasize to developed countries policymakers the importance of conducting unconventional monetary policy in an orderly manner to avoid turbulence in the global markets (IMF 2013b).
462 Buletin Ekonomi Moneter dan Perbankan, Volume 19, Nomor 4, April 2017
Aizenman, J, Binici, M, & Hutchinson, M . (2014). Transmission of Federal Reserve tapering to emerging financial markets. NBER Working Paper. No. 19980, National Bureau of Economic Research, Cambridge.
Bean, C. (2012). Panel remarks: Global Aspects Of Unconventional Monetary Policies, Conference On Quantitative Easing And Other Unconventional Monetary Policies. Bank of England. Viewed on 20 October 2014.
<http://www.bankofengland.co.uk/publications/Documents/speeches/2013/speech674.pdf>
Bowdler, C, & Radia, A. (2012). Unconventional Monetary Policy: The Assessment. Oxford
Review of Economic Policy. Vol. 28 (4), 603-621. Oxford.
Bowman, D, Londono, JM, & Sapriza, H. (2014). US Unconventional Monetary Policy And Transmission To Emerging Market Economies. International Finance Discussion Papers. No. 1109. Board of Governors of the Federal Reserve System.
Chen, Q, Filardo, A, He, D, & Zhu, F. (2012). International Spillovers Of Central Bank Balance Sheet Policies. BIS Working Paper. 66. Bank International Settlements.
Directorate General for Internal Policies, European Parliament (2012). Unconventional monetary
policy measures: a comparison of the ECB, FED and BOE. Directorate General for Internal
Policies. European Parliament.
Fic, T. (2013). The Spillover Effects Of Unconventional Monetary Policies In Major Developed Countries On Developing Countries. DESA Working Paper. 131. Department of Economic and Social Affairs, United Nations.
Fawley, BW & Neely, CJ. (2013). Four Stories of Quantitative Easing. Federal Reserve Bank of
St. Louis Review. 95 (51-88).
Fratzscher, M, Lo Duca, M, & Straub, R. (2013). On The International Spillovers of US Quantitative Easing. ECB Working Paper. 1557. European Central Bank.
Hosono, K and Isobe, S. (2014). The Financial Market Impact of Unconventional Monetary Policies in the U.S., the U.K., the Eurozone, and Japan. PRI Discussion Paper Series. (14A-05). Policy Research Institute. MOF. Japan.
International Monetary Fund (IMF). (2012). The Interaction of Monetary And Macro-Prudential Policies. IMF Policy Paper. Washington DC.
International Monetary Fund. (2013a). Global Impact And Challenges Of Unconventional Monetary Policy. IMF Policy Paper. Washington DC.
International Monetary Fund. (2013b). Unconventional Monetary Policies-Recent Experience and Prospects. International Monetary Fund. Washington DC.
International Monetary Fund. (2013c). The Annual Report on Exchange Arrangements and Exchange Restrictions 2013. International Monetary Fund. Washington DC.
Mishra, P, Moriyama, K, N’Diaye, P, and Nguyen, L. (2014). Impact of Fed Tapering Announcements on Emerging Markets. IMF Working Paper. WP/14/109. International Monetary Fund.
Moore, J, Nam, S, Suh, M, and Tepper, A. (2013). Estimating The Impacts of US Large Security Asset Purchases on Emerging Market Economies Local Currency Bond Markets. Federal
Reserve Bank of New York Staff Reports. No. 595.
Taylor, JB. (2013). International Monetary Policy Coordination: Past, Present, and Future. BIS
Working Papers. No. 437. Bank for International Settlements.
Zhang, L and Zoli, E. (2014). Leaning Against The Wind: Macroprudential Policy in Asia. IMF
464 Buletin Ekonomi Moneter dan Perbankan, Volume 19, Nomor 4, April 2017
APPENDIX
Table 9.
Variables description and data source
No Factors Variables Description Data Source
GROWTH CPI CA CAP M2 M3 ME MUK MUS MJPN XE XUK XUS XJPN XC MPP CFM
Economic Growth Inflation
Current Account % of GDP Stock Market Capitalization M2 % of GDP
M3 % of GDP Import from Europe Import from England Import from US Import from Japan Export to Europe Export to England Export to US Export to JPN Export China
Macro Prudential Policy Capital Flow Measures
CEIC CEIC CEIC CEIC
CEIC/Trading Economics/OECD CEIC/Trading Economics/OECD CEIC
CEIC CEIC CEIC CEIC CEIC CEIC CEIC CEIC Zhang & Zoli (),
Annual Report on Exchange Arrangements and Exchange Restrictions (),
The interaction of monetary and Macroprudential policies—IMF (). Macro Fundamentals
Financial Depth
Trade Link with Developed Country
Trade Link China Macro Prudential Policy 1
2
3
Figure 2.
Mean deviation of emerging market countries log exchange rate (announcement (1) to (8))
-7 -6 -5 -4 -3 -2 -1 0 1 2 3 4 5 6 7 3/28/08 Brazil Indonesia Mexico Philippines Singapore Chile India Malaysia Russia Thailand Colombia Korea Peru South Africa Turkey
-7 -6 -5 -4 -3 -2 -1 0 1 2 3 4 5 6 7 10/15/08 Brazil Indonesia Mexico Philippines Singapore Chile India Malaysia Russia Thailand Colombia Korea Peru South Africa Turkey
-7 -6 -5 -4 -3 -2 -1 0 1 2 3 4 5 6 7 11/28/08 Brazil Indonesia Mexico Philippines Singapore Chile India Malaysia Russia Thailand Colombia Korea Peru South Africa Turkey
-7 -6 -5 -4 -3 -2 -1 0 1 2 3 4 5 6 7 1/19/09 Brazil Indonesia Mexico Philippines Singapore Chile India Malaysia Russia Thailand Colombia Korea Peru South Africa Turkey
-7 -6 -5 -4 -3 -2 -1 0 1 2 3 4 5 6 7 3/5/09 Brazil Indonesia Mexico Philippines Singapore Chile India Malaysia Russia Thailand Colombia Korea Peru South Africa Turkey
-7 -6 -5 -4 -3 -2 -1 0 1 2 3 4 5 6 7 3/18/09 Brazil Indonesia Mexico Philippines Singapore Chile India Malaysia Russia Thailand Colombia Korea Peru South Africa Turkey
-7 -6 -5 -4 -3 -2 -1 0 1 2 3 4 5 6 7 5/7/09 Brazil Indonesia Mexico Philippines Singapore Chile India Malaysia Russia Thailand Colombia Korea Peru South Africa Turkey
-7 -6 -5 -4 -3 -2 -1 0 1 2 3 4 5 6 7 8/6/09 Brazil Indonesia Mexico Philippines Singapore Chile India Malaysia Russia Thailand Colombia Korea Peru South Africa Turkey
466 Buletin Ekonomi Moneter dan Perbankan, Volume 19, Nomor 4, April 2017
Figure 3.
Mean deviation of emerging market countries log exchange rate (announcement (9) to (16))
-7 -6 -5 -4 -3 -2 -1 0 1 2 3 4 5 6 7 11/5/09 Brazil Indonesia Mexico Philippines Singapore Chile India Malaysia Russia Thailand Colombia Korea Peru South Africa Turkey
-7 -6 -5 -4 -3 -2 -1 0 1 2 3 4 5 6 7 12/1/09 Brazil Indonesia Mexico Philippines Singapore Chile India Malaysia Russia Thailand Colombia Korea Peru South Africa Turkey
-7 -6 -5 -4 -3 -2 -1 0 1 2 3 4 5 6 7 3/11/10 Brazil Indonesia Mexico Philippines Singapore Chile India Malaysia Russia Thailand Colombia Korea Peru South Africa Turkey
-7 -6 -5 -4 -3 -2 -1 0 1 2 3 4 5 6 7 3/17/10 Brazil Indonesia Mexico Philippines Singapore Chile India Malaysia Russia Thailand Colombia Korea Peru South Africa Turkey
-7 -6 -5 -4 -3 -2 -1 0 1 2 3 4 5 6 7 5/10/10 Brazil Indonesia Mexico Philippines Singapore Chile India Malaysia Russia Thailand Colombia Korea Peru South Africa Turkey
-7 -6 -5 -4 -3 -2 -1 0 1 2 3 4 5 6 7 5/21/10 Brazil Indonesia Mexico Philippines Singapore Chile India Malaysia Russia Thailand Colombia Korea Peru South Africa Turkey
-7 -6 -5 -4 -3 -2 -1 0 1 2 3 4 5 6 7 8/30/10 Brazil Indonesia Mexico Philippines Singapore Chile India Malaysia Russia Thailand Colombia Korea Peru South Africa Turkey
*above zero (the mean) shows exchange rate depreciation, while below zero shows exchange rate appreciation
Figure 4.
Mean deviation of emerging market countries log exchange rate (announcement (10) to (24))
-7 -6 -5 -4 -3 -2 -1 0 1 2 3 4 5 6 7 10/6/11 Brazil Indonesia Mexico Philippines Singapore Chile India Malaysia Russia Thailand Colombia Korea Peru South Africa Turkey
-7 -6 -5 -4 -3 -2 -1 0 1 2 3 4 5 6 7 12/8/11 Brazil Indonesia Mexico Philippines Singapore Chile India Malaysia Russia Thailand Colombia Korea Peru South Africa Turkey
-7 -6 -5 -4 -3 -2 -1 0 1 2 3 4 5 6 7 2/9/12 Brazil Indonesia Mexico Philippines Singapore Chile India Malaysia Russia Thailand Colombia Korea Peru South Africa Turkey
-7 -6 -5 -4 -3 -2 -1 0 1 2 3 4 5 6 7 2/20/12 Brazil Indonesia Mexico Philippines Singapore Chile India Malaysia Russia Thailand Colombia Korea Peru South Africa Turkey
-7 -6 -5 -4 -3 -2 -1 0 1 2 3 4 5 6 7 7/5/12 Brazil Indonesia Mexico Philippines Singapore Chile India Malaysia Russia Thailand Colombia Korea Peru South Africa Turkey
-7 -6 -5 -4 -3 -2 -1 0 1 2 3 4 5 6 7 9/6/12 Brazil Indonesia Mexico Philippines Singapore Chile India Malaysia Russia Thailand Colombia Korea Peru South Africa Turkey
-7 -6 -5 -4 -3 -2 -1 0 1 2 3 4 5 6 7 9/13/12 Brazil Indonesia Mexico Philippines Singapore Chile India Malaysia Russia Thailand Colombia Korea Peru South Africa Turkey
*above zero (the mean) shows exchange rate depreciation, while below zero shows exchange rate appreciation
468 Buletin Ekonomi Moneter dan Perbankan, Volume 19, Nomor 4, April 2017