Relating to Roadway Transportation Lifelines after Natural
Disasters
Milad Zamanifar1, Maghsood Pooryari 2, Mohammad Reza Ahadi 3
Received: 12.06.2013 Accepted: 23.09.2014
Corresponding Author. E-mail: [email protected]
1. MSc. Grad., Department of Civil Engineering, Islamic Azad University South Branch, Tehran, Iran. 2. MSc. Transportation Research Institute, Ministry of Roads and Urban Development, Tehran, Iran.
3. .Assistant Professor, Transportation Research Institute, Ministry of Roads and Urban Development, Tehran, Iran.
Abstract
Earthquakes are among those natural hazards which may lead to disruption in the function of arte
-rial traffic routes. Road networks are particularly vulnerable, due to their geographical dispersion, extensive functions and structural reliance on favourable geophysical conditions. Traffic function
-ality after a natural disaster and the repair/rehabilitation cost of roads are crucial considerations in planning the best priority recovery scenario. In the current paper, the primary focus is placed on the method for evaluating the costs of damage to the roadway network following an earthquake. Bridges, pavements, tunnels and base layers are assumed to be the main elements of a roadway structure. Through this approach, the level of damage can be specified for each component of the roadway. The repair/rehabilitation cost pattern can then be generated according to the level of damage, and the entire reconstruction costs can be calculated according to the total damaged surface area of each route. Finally, the total damage cost of roadways can be provided by consider
-ing the likely duration of the rehabilitation period, and determin-ing the performance reduction in traffic flow caused by the damaged components. Secondly this paper demonstrates a method of measuring roadways’ functional performance. This method, based on path dividing and consid
-eration of the attachment of sections leads to more precise feedback on roadways’ functionality. This is calculated by computing the width of sections in a route that remain undamaged and which retain the ability to sustain traffic flow. In this way, traffic flow and the linkage of sections can be determined as functions of road capacity.
1. Introduction
Transportation networks constitute one class of major civil infrastructure system that is a critical backbone of modern societies. To date, the true prevention of a natural disaster has only rarely been achieved; such events contin
-ue to pose a threat to life and property. Espe
-cially following earthquakes - events typically unheralded and associated with widespread destruction and high mortality - there is a need for rapid, accurate and reliable damage infor
-mation to guide response activities during the critical first few hours. Transportation and utility networks (e.g., water delivery, power, and oil systems) are essential in the support of all economic and social activities in an indus
-trialized region. The functional loss of this ur
-ban infrastructure component - due to internal or external perturbations, such as earthquakes - can severely impact commercial and indus -trial activities on regional, national, and
in-ternational scales. It is crucial that authorities meet such disasters with rapid, effective emer
-gency responses and with appropriate repair operations following the event. Therefore, an understanding of the influence of hazards to these infrastructure systems and a careful al
-location of limited resources for the seismic retrofitting of infrastructure systems compo -nents are critical to mitigating damage and to effective response and recovery efforts.
On one hand, estimating the likely cost of damage to a transportation network after a
disaster is an important process in enhancing
the effectiveness of decision making. Natural
-ly, greater knowledge surrounding the repair/ rehabilitation of transportation components
helps transportation agencies and planners
as-sign budgets and resources optimally. Accu
-rate cost estimates for reconstruction depend on damage state evaluation procedures, which may be assess in the pre-planning stage, or survey phase after the event. A reliable meth
-od is required to survey damaged components
after a disaster.
On the other hand, physical damage and func
-tional loss to transportation infrastructure
systems not only hinder everyday societal
and commercial activities; they also impair
post disaster responses and recovery
proce-dures, leading to substantial socio-economic consequences. Therefore, it is vital that emer -gency managers and government agencies
understand and model the possible impact of a disaster on the various components of the transportation infrastructure. These agencies should implement changes to travel patterns under extreme events, so as to mitigate, pre -pare for, respond to, and recover from the
po-tential impacts [Chang et al. 2010].This paper therefore sets out not only to present a cost pattern for repair to road components, but also to present an accurate model for formulating the effect on traffic of the total demolition of a
road in the ‘post-disaster’ phase.
2. Literature Review
employed throughout this research because it is easy to implement and captures the neces
-sarily subjective nature of bridge functional
-ity as assessed in closure and repair decisions. This approach was used in the ATC-13 [ATC-13, 1985] to evaluate the loss of functionality
and to estimate the restoration time for
life-line facilities including the transportation in
-frastructure [Hwang et al. 2000]. Conducted a survey to collect expert opinions on stepwise restoration curves, in which only nine re
-sponses were recorded. More recently, Padg
-ett [Padg-ett and DesRoches 2007] performed a web-based survey to collect expert opinions from experienced staff members in the depart
-ments of the Central and South eastern United States relating to bridge engineering mainte
-nance and operations (CSUS) [Chang et al. 2010]. The findings from the experience of Loma Prieta, Northridge, Hyogoken-Nabnbu and the Chi-Chi earthquakes show that the seismic damage to highway systems caused heavy damage to transportation networks including highways and bridges [Feng and Wang, 2009]. Despite exist of many studies into road damage resulting from seismic activ
-ity, limited research measures the conditions and performance of roads in a post-earthquake scenario. Furthermore, the existing research fails to present an exact method for collect
-ing data and analyz-ing the real situation of roads. By contrast, the rail system and bridges
are the elements receiving researchers’
great-est focus, resulting in the neglect of the road
system and pavements. The research of Chang and Nojima should not be overlooked; as part of their methodological approach, they sug
-gest several measures to evaluate system de -terioration and performance restoration in the
immediate aftermath of an earthquake and over the course of the reconstruction period [Chang and Nojima, 2000]. It should be noted that Nojima also proposed road traffic capac
-ity as a basic post-earthquake performance measure for highway systems, where ‘capac
-ity’ consists of the aggregate flow capacity of links connecting a specific ‘origin-destination’ pair of nodes [Nojima, 1998].
3. Cost Estimation
3.1 Definition of Patterns and Related Pa -rameters
The patterns introduced in this research are based on characteristics of contractor systems and their usual expenses in the areas under study. It is therefore necessary to develop expense-reconstruction procedures for each country, based on the repair and maintenance
systems of that area.
This paper presents a model for the estimation
of cost pertaining to post-disaster reconstruc
-tion, building upon modifications to the meth
-ods employed in the previously mentioned studies. In this way, reconstruction periods are defined, along with the repair costs rel
-sideration the criticality of the conditions for
reconstruction and the availability of repair machinery and equipment.
It should be acknowledged that the time pe
-riods mentioned here have been estimated by neglecting the time required for cleans
-ing debris from the roads. In other words, the reconstruction phase is considered to begin just after the initiation of emergency relief and road cleaning. The percentile of distur
-bance has been estimated based on the area of destruction and on surveys from experts in transportation crisis management. 94 percent of the questionnaires were returned. It should be noted that the experts had already been fa
-miliarized with elements and the aims of the questionnaires before filling them.
In order to record the impact of destruction on traffic structures most accurately, this research
presents three factors, pertaining to: the
re-construction duration; the costs of the recon
-struction of each road element and, finally; the rate of disturbance to traffic function in the destruction areas. Each of these factors is addressed in the following tables.
3.2 Pattern Generation
Since the complete reconstruction of any sys
-tem is considered as a costly and rarely a jus
-tifiable option, arrangements should be made to fully exploit the remaining elements. That is to say, the reconstruction of the network - even in the event of mass destruction - is not a reasonable aspiration. It is provided that,
only in case of the full failure of the structure should renewal of the structure being conduct
-ed. In other cases, repair / reconstruction is the favored option. Accordingly, reconstruction costs are estimated individually for each road
element. This method is also applied to the
degree of deterioration for each element; the final cost will be estimated according to the degree of deterioration and the vulnerability levels expressed across a range of 5 integers, according to the HAZUS scale [Hazus, 2011]. The range is expressed by scores of 1 to 5 in proportion with the extent of the damage. The integers are defined thus: PGD DS =1: not considerable; PGD DS = 2: medium; PGD DS = 3: High; PGD DS = 4; PGD DS = 5: fully
destroyed.
Although the classification system used here has been presented for discussion of traffic bridges, the intervals between deterioration levels are considered as consistent qualitative measures for estimating the extent of vulner
-ability.
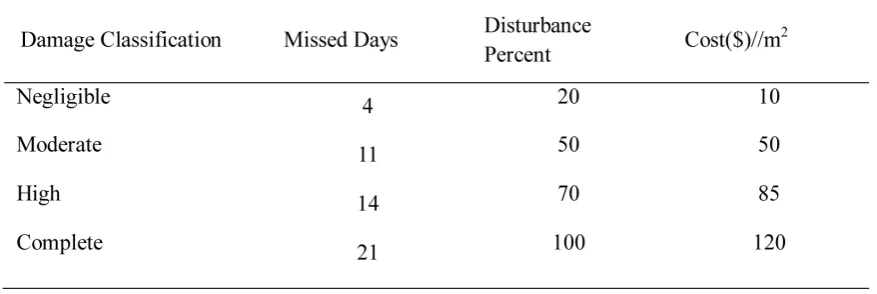
In order to make precise qualitative values, it is necessary to define individually the types of damage affecting the traffic structures. In this way, the damage survey team can easily define the vulnerability level of traffic coordi
-nates based on the observations made. Table 2, based on 4 levels of damage classification, shows the damage to urban tunnels. The re
Table 1. Quantitative and qualitative classification of bridge damage classification
data for urban bridges. For the bridge, the re
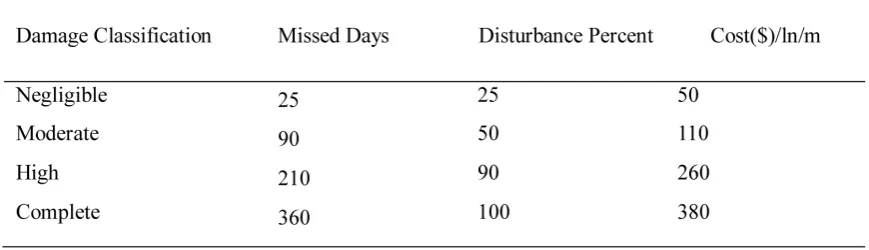
-construction cost is represented by values per meter and per lane of road. Table 4 also in
-cludes data for the base and the sub-base. Re
-construction costs have been estimated for a unit area with a thickness of 1 meter.
Furthermore, the duration of the reconstruc
-tion of road sub layers has been estimated regardless of the time required for pavement construction. Hence, the final duration used for the whole track is equal to the time re
-quired for the construction of the sub-layers plus that of the superior layer .Table 5 shows the reconstruction cost per square meter of as -phalt pavement layers.
Table 2. Tunnel damage classification, as defined by cost, reconstruction duration and disturbance percentile
Retrofitting the existing bridges of the trans
-portation infrastructure systems has proven a very effective and relatively economical way
to enhance the performance of transporta-tion systems and to mitigate potentially
cata-strophic losses [Chang et al. 2000; Shinozuka et al. 2003; Zhou et al. 2004; Kim et al. 2008]. However, it is neither practical nor economi
-cal to invest very substantial resources into retrofitting all existing bridges. Hence, it is vi
-tal to make priorities among candidate bridges for seismic retrofitting, with a strategy that is mindful of funding and aging challenges [ASCE, 2009; Basőz and Kiremidjian, 1996].
Table 3. Bridge damage classification, as defined by cost, reconstruction duration, and disturbance percentile
Table 4. Base Layer damage classification, as defined by cost, reconstruction duration, and disturbance percentile
4. Traffic Functionality 4.1 Overview
Based on the limited existing studies made into the subject of road functionality after a natu
-ral disaster like earthquake, seve-ral uncertain correlations have been identified. These stud
-ies are usually founded on the physical dete
-rioration of a road, following the assumption of an indirect relationship between the extent of deterioration and traffic functionality. But, experience shows that, under real conditions, this presumption is incorrect; serviceability and full disruption of traffic flow depends on the shape of the road in the region of destruc
-tion. For example, even in the case of medi
-um-scale physical deterioration, provided that
the deterioration of transversal road elements
has occurred, it can be assumed that path will become fully blocked. Therefore, considera -tion of the mere deteriora-tion of an area
re-sults in a false interpretation of the functional performance of the area’s roads. The current approach - as well as defining the connectivity conditions for each section - involves calcu
-lating the width of those sections of the route that remain undamaged and which are still able to sustain traffic flow.
4.2 Concept
Several approaches have been developed to examine the reliability and serviceability of systems subjected to an earthquake, but most of them deals only with the probability of physical or functional failure, and do not
provide any information on the post-disaster
role of each structure to the system as a whole. This kind of information is important in de -termining not only the seismic design of each
structure in the system but also the most ap
-propriate network configuration [Kawakami, 2000].
The method described is to be implemented at the ‘post-disaster’ phase -when information concerning the type and extent of damage to roads is gathered for the consultation of de
-cision makers. It is assumed that evacuation, debris removal/clean-up has already been ac -complished- as part of the ‘response phase’.
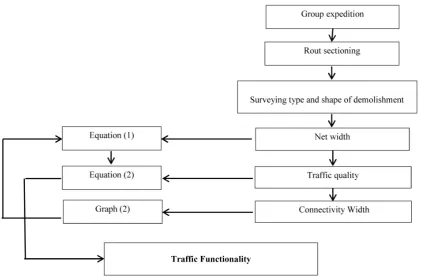
Figure 1 is a flowchart describing the method
-ology for calculating the traffic functionality of roads after an earthquake:
4.2.1 Segment and Net width
The method commences with dividing the road into segments of between 50 and 200 meters. The undamaged width of any seg
-ments that still capable of sustaining traffic flow is then measured. This width is called the ‘net width’. The net width should not be less than 2.2 meters in order to have passing abil
-ity of at least one vehicle at a time through the segment. However, in ideal situations, the net width will be equal to standard road lane width [Zamanifar, 2012].
4.2.2 Connectivity of Segments
-Figure 1. Flowchart of the methodology for computing traffic functionality
nectivity is one of the most frequently used measures. Connectivity between segments makes the passage ‘stable’. The transmission ability of roads depends on the existence of proper connections between any given seg
-ment and those seg-ments which come before and after it. The next section of this research is therefore concerned with the ‘continuity’ of sections - an indicator of the ability of traffic to travel by road between two sections. This parameter is indicated by the term Wji, and calculated by Eq. 2.
4.2.3 Quality of Traffic Flow
The functional performance of a road after damage caused by natural disasters can ac
-tually be considered as the capacity of that
road in a ‘critical condition’. So, in order to
evaluate the performance of any such road, it is necessary to consider the pattern of traffic flow after an earthquake. While there are no generally accepted measures of turbulence in the traffic stream, the basic distinguish
-ing characteristic of weav-ing, merg-ing and diverging segments is the additional lane– changing these manoeuvres cause [McShane and Roger, 1990]. Road demolition is another aspect of this disruption – one which calls for
greater vigilance on the part of drivers and
which poses an on-going risk as part of the generally-uncertain post-earthquake condi
-cessitated by the destruction of part of a road may lead to considerable frequent changes in
speed, rendering the average speed of vehicles
somewhat lower than in pre earthquake condi
-tions. Consequently, it is necessary for those assessing the performance of the road network to record the number of lane changes required of a driver as a result of the physical destruc
-tion of the road. Therefore, in the calcula-tion of a traffic closure equation, this parameter has been emphasized by number of damaged locations in the section of the road causing de
-viation from the straight line – all of which is cumulatively considered. Although, ideally, the precise assessment of weaving required by traffic should take into account the length of the weaving area, as well as its width, owing to the urgent requirements of such analysis, a width-based approach – such as is provided in this article - is fast and easy to calculate. The amount of this reduction can be found accord
-ing graph 1. This amount varies from 2 - for the segment with the minimal lane-changing area to 5 - for the segment with the maximum compulsory deviation for drivers (regarding the length of each segment). The maximum acceptable deviation in each segment is equal to 1 compulsory lane-change in every 50 me
-ters of road. This amount reduces the capacity of a road to its lower value. For instance, not more than 4 dictated deviations are acceptable
for a segment of road 200 meters in length.
The following equations are used to evaluate the percentage of roads closure:
*( 0) if a bridg collaps and blocked the route)
F(log(7-nx))=(1) If there is no deviation or
less than 2
(1)
(2)
Where:
TDi: the percentage of segments closed to
traffic
Wefi: the measured net width of each segment
in the road
WTotal : the total width of the road section N: the number of segments
Nx: The number of lane changes made by a driver as a result of damage to parts of the
road
TDT: the total percentage of roads closed to
traffic
Wji : the width of the connection to the previ
-ous and next segments
By this equation, both the closure of, and the connectivity between, segments are evalu
Figure 2. Computation of log(7-nx) for various values of nx [Zamanifar,2012]
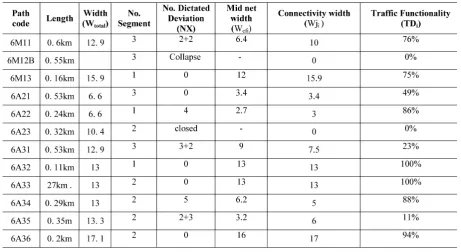
To demonstrate the use of the model it was ap
-plied to a roadway as an example, which paths shown by codes. The suffix letter B indicates bridge in the path. Figure 2 represents the map shows coded paths of studied zone.
The demonstration follows the planning phase illustrated in Figure 1 along with hypothetical damage accrued by earthquake. A summary of the data used and results are given in the table
6
5. Conclusion
Presented methods are of remarkable benefit to authorities and decision makers; it repre
-sents a quantitative approach for estimating
the direct cost of repairs to road elements.The
estimated reconstruction cost of any route after an earthquake is considered one of the
Table 6. Computed data and result regard to traffic functionality of paths
key decision making criteria. It is used for
prioritizing all activities pertaining to road
re-construction. Although estimates of cost are
important for rapid analysis in post-disaster
situations, should not leave behind the fact that accuracy and efficaciousness are two vi
-tal parameters when considering the quality of road performance evaluation. Accuracy in estimations is strongly associated with effec
-tive reconstruction planning .Surveying the post-earthquake function of road network is a recommended approach for quick and effi -cient reactions. Therefore rapid recovering of
the systems such that they can provide servic
-es with acceptable safety through optimal re
-gether with prioritization models for decision making, three factors emerge: the direct cost of reconstruction, the duration of repairs and finally the percentage of disruption to such el
-ements’ function. Each of these factors can be considered crucial components in assessing the condition of each traffic structure at times of vulnerability. Moreover, studying the meth
-od that combines these 3 factors will require a methodology that encompasses specific deci
-sion making models and the subjective nature of decision making which is encouraged to be studied in future research. Finally, It should also be stated that the data in the tables pro
-vided here have been estimated according to surveys made by experts that have focused on
the local characteristics of repair and
main-tenance systems, which is related to existed experience of crisis situation and costs in Iran.
6. References
- Applied Technology Council (ATC) (1985) “Earthquake damage evaluation data for Cali
-fornia (ATC-13)”, ATC, Redwood City, CA. pp 85-86, 235-245
- American Society of Civil Engineers (2009) “Report card for America’s infrastructure”, <http://www.infrastructurereportcard.org/ fact-sheet/bridges> (June 5, 2009).
- Basőz, N. and Kiremidjian, A. S. (1996) “Risk assessment for highway systems”, Re
-port No. 118, John A. Blume Earthquake En
-gineering Center, Department of Civil Engi
-neering, Stanford University, CA.
- Chang, Stephanie. E; Nojima, Nobouto; (2000) “Measuring post-disaster transporta
-tion system performance”:The 1995 Kobe Earthquake in Comparative Perspective, Transportation Research Part A 35: pp. 475-494.
- Feng, Cheng-Min and Wang, Tsai-Chu (2009) “Highway emergency rehabilitation scheduling in post-earthquake 72 hours”, Journal of the Eastern Asia Society for Trans
-portation Studies, Vol.5, No 3281, pp. 20-28.
- Hazus®–MH MR5, (2011) “Technical man
-ual, Department of Homeland Security”, Fed
-eral Emergency Management Agency Mitiga
-tion Division, Washington, D. C.
- Ui, Hideji (2000) “Earthquake performance of highways in Tokyo”, Proceedings of the 12th World Conference on Earthquake Engi
-neering, New Zealand Earthquake Commis
-sion, New Zealand, pp. 8-26
- Kim, Y., Spencer, B. F., and Elnashai, A. S. (2008) “Seismic loss assessment and mitiga
- Liang Chang Amr, S., Elnashai, Billie F. Spencer, Jun, Ho, Song and Yanfeng, Ouyang (2010) Ttransportations Systems Modeling and Applications, In Earthquake Engineer
-ing”, Report No. 10-03, Mid-America earth
-quake center
-McShane, William R; Roess Roger P; (2004) “Traffic engineering,. Chapter 13th, Prentice-Hall, Inc. Englewood Cliff, New Jersey. pp. 485-486
-Nojima, Nobouto (1998) “Prioritization in upgrading seismic performance of road net
-work based on system reliability analysis”, The 3rd China-Japan-US Trilateral Symposi
-um on Lifeline Earthquake Engineering, Kun
-ming, China.
-Padgett, J. E. and DesRoches, R. (2007) “Retrofitted bridge fragility analysis for typi
-cal classes of multi-span bridges.” Earthquake Spectra, 23 (1), pp.115-130.
-Shinozuka, M., Murachi, Y., Dong, X., Zhou, Y. and Orlikowski, M. J. (2003) “Effect of seismic retrofit of bridges on transportation networks.” Research Progress and Accom
-plishments (2001-2003), Report No. MCEER-03-SP-01, Multidisciplinary Center for Earth
-quake Engineering Research (MCEER),
University of Buffalo, Buffalo, NY
- Wakabayashi, Hiroshi and Kameda, Hiroyuk (1992) “Network performance of highway systems under earthquake effects: A case study of the 1989 Loma Prieta earthquake”. The 5th US-Japan Workshop in Earthquake Disaster Prevention for Lifeline Systems, Tsukuba Sci
-ence City, Japan, 12.
-Werner, S. D., Lavoie, J. P., Eitzel, C., Cho, S., Huyck, C., Ghosh, S., Eguchi, R.T., Taylor, C.E. and Moore, J (2004) “New development in seismic risk analysis of highway systems, 13th World Conference on Earthquake Engi
-neering”, B.C., Canada, Paper No. 2189 pp 96-104
-Zamanifar, Milad (2012)”prioritization plan of urban roadways for recovery after earth
-quake”, Master Thesis in transportation plan
-ning, Islamic Azad University, South Tehran Branch, Tehran, Iran.
-Zhou Y., Murachi, Y., Kim, S., and Shino
-zuka, M. (2004) “Seismic risk assessment of retrofitted transportation systems”, Proceed
-ings of the 13th World Conference on Earth
-quake Engineering, Canadian Association for Earthquake Engineering, Ottawa, Canada, pp.
![Figure 2. Computation of log(7-nx) for various values of nx [Zamanifar,2012]](https://thumb-us.123doks.com/thumbv2/123dok_us/14233.2001355/10.595.121.465.427.704/figure-computation-log-nx-various-values-nx-zamanifar.webp)