VOLUME 41, ARTICLE 22, PAGES 617
-
648
PUBLISHED 3 SEPTEMBER 2019
https://www.demographic-research.org/Volumes/Vol41/22/ DOI: 10.4054/DemRes.2019.41.22
Research Article
An exploration of differences in ideal family size
between Muslim and non-Muslim women in
France
Julia A. Behrman
Jeylan Erman
© 2019 Julia A. Behrman & Jeylan Erman.
This open-access work is published under the terms of the Creative Commons Attribution 3.0 Germany (CC BY 3.0 DE), which permits use, reproduction, and distribution in any medium, provided the original author(s) and source are given credit.
1 Introduction 618
2 Religion and fertility in contemporary France 619
3 What accounts for higher Muslim fertility in France? 620
4 Data 622
5 Measures 624
6 Analysis 627
7 Results 628
7.1 Descriptive overview of how Muslim women in the sample differ in ideal family size and background characteristics
628
7.2 Exploration of why Muslim women have higher ideal family sizes using nested mediation analysis and decomposition of the gap in ideal family size
630
8 Supplementary analyses 632
9 Discussion 633
10 Acknowledgements 634
References 636
An exploration of differences in ideal family size between
Muslim and non-Muslim women in France
Julia A. Behrman1
Jeylan Erman2
Abstract
BACKGROUND
The paper explores why Muslim women in France have, on average, higher ideal family sizes than non-Muslim women to better understand the socioeconomic and sociocultural factors that underlie Muslim women’s higher desired and realized fertility. METHODS
This paper uses a sample of 9,456 female respondents from the 2008/2009 French Trajectories and Origins (TeO) survey. Two-tailed independent sample t-tests are used to estimate differences in fertility ideals, contraceptive behaviors, and background characteristics between Muslim and non-Muslim respondents. Nested mediation and decomposition analyses are used to explore the factors that explain the gap in the ideal family size between Muslims and non-Muslims.
RESULTS
Muslim women have, on average, higher ideal family sizes than non-Muslim women, which can largely be explained by higher religiosity and higher numbers of siblings (the latter proxies for norms favoring large families). On the other hand, differences in socioeconomic status and migration status are less important in explaining Muslim women’s higher ideal family sizes.
CONTRIBUTIONS
French Muslim women’s higher ideal family sizes are not anomalies but can be contextualized within a larger set of patterns common to more religious women from diverse religious backgrounds, such as high religiosity and family norms prioritizing large family sizes.
1 Department of Sociology and Institute for Policy Research, Northwestern University, Evanston, USA.
Email:[email protected].
1. Introduction
Although Muslim women have higher birth rates than women of other backgrounds in contemporary France (Toulemon 2004; Westoff and Frejka 2007), there are widespread misconceptions about Muslim fertility and corresponding population growth. For example, the average French person estimates that about one-third of the population is Muslim, when the reality is closer to 7.5% (IPSOS 2016; Kent 2008). These misconceptions may be related to the fact that Muslims have the largest projected absolute population growth of any religious group in contemporary France due to high birth rates among Muslim women and migration from Muslim-majority countries (Hackett et al. 2015). Nonetheless, by 2050 Muslims will only make up just over 10% of the French population, which is a dramatically lower percentage than popular estimates would suggest. Despite the immense interest in the fertility of Muslim women and its implications for population change, there has been limited exploration of why Muslim women have, on average, more children than women of other backgrounds in contemporary France.
Lack of contextualization about why Muslim women in France (or other contexts) have high fertility contributes to misconceptions about the exceptionalism of Muslim fertility, including an oversimplified and empirically incorrect assumption that there is something inherent in Islam that leads to high fertility (Johnson-Hanks 2006). Related research on Christian populations in the United States and Europe has shown that religiosity and associated gender and family norms – rather than religion itself – are associated with higher fertility (Adsera 2007; Baudin 2015; Brañas-Garza and Neuman 2007; Hayford and Morgan 2008; Kaufmann, Goujon, and Skirbekk 2012; Peri-Rotem 2018). Evidence from the Middle East, Africa, and Asia suggests religiosity is strongly associated with fertility among Muslim populations in the global south (Kaufmann 2008; Okun 2013).3 Nonetheless, this literature has rarely been extended to Muslim populations in France or other high-income contexts, even though Muslim populations in France differ in important dimensions on observable characteristics – such as religiosity and socioeconomic status – from the general population. This deficit of analysis likely is related to the fact that many European countries with large Muslim populations (including France) do not collect information on religion in population censuses, thus making it difficult to empirically investigate these issues.
In this paper, we explore why Muslim women in France have higher ideal family sizes than their non-Muslim counterparts with the aim of better understanding the
3 To the best of our knowledge, much of the literature exploring fertility differences by religion in the global
socioeconomic and sociocultural factors that underlie their higher desired and realized fertility. We focus on ideal family size because fertility ideals play an important role in shaping subsequent fertility behaviors (Coale 1973; Easterlin 1975; van de Walle 1992) and are part of a greater set of schema that help people make sense of the world (Johnson-Hanks et al. 2011). We situate our findings within a literature on the interplay between religiosity and women’s fertility ideals and behaviors, which has largely been used to explore the fertility patterns of Christian women in high-income contexts (Goldscheider 2006; McQuillan 2004; Zhang 2008).
We use unique nationally representative microdata from the French Trajectories
and Origins (TeO) survey. First, we conduct two-tailed independent sample t-tests to understand differences in fertility ideals and socioeconomic and sociocultural background characteristics between Muslims and non-Muslims in France. In our main analyses, we conduct a nested mediation analysis and decomposition analysis to assess the role of socioeconomic and sociocultural background characteristics in explaining Muslim women’s higher ideal family sizes. Our findings contribute to a more complete and nuanced understanding of the factors that underlie Muslim women’s fertility patterns in contemporary France.
2. Religion and fertility in contemporary France
France was historically a predominantly Catholic country; however, the religious landscape has changed in recent history due to two important trends: (1) an influx of migrants from non-Catholic backgrounds and (2) increasing secularization. With respect to the first trend, Muslims have been the largest migrant group of any religious background. Although there has been some Muslim presence in France for centuries, the largest wave of Muslim migration occurred in the mid-20th century when foreign laborers were recruited to assist in post–World War II reconstruction from former colonies in North Africa (Alba and Foner 2015). While the earliest migrants were often single men, family reunification policies allowed women and extended family members to join in the 1970s and 1980s (Laurence and Vaisse 2006). As migrant-sending countries have diversified over time, Muslims in France have come to be a highly heterogeneous group, including people with origins in North Africa, Turkey, sub-Saharan Africa, South Asia, and the Middle East. Because conversion rates to Islam are low in France, the majority of French Muslims are of migrant origin.
another religion (e.g., Jewish or Buddhist). The high rates of secularism in France have been reinforced by the French state’s Laïcité policy, which enforces separation of church and state, including forbidding religious expression in the public sphere
(Halman and Draulans 2006; Lesthaeghe and Wilson 1986).By 2050 it is expected that 44% of the population will identify as Christian, 44% of the population will identify as no religious affiliation, 11% of the population will identify as Muslim, and 1% of the population will identify as another religion (Hackett et al. 2015).
French fertility remains relatively high by Western European standards, which is attributed to a history of pronatalist family policies (Pailhé 2008). Despite an increasing tendency to delay parenthood in France, the total fertility rate (TFR) among nonmigrants has remained relatively stable at 1.8 over the last few decades (Toulemon, Pailhé, and Rossier 2008). Although overall TFR is comparatively high in France, more religious Christian women have on average significantly higher birth rates than less religious women (Baudin 2015; Kaufmann et al. 2012; Peri-Rotem 2018). The higher fertility of more religious Christian women in France has been attributed to adherence to norms that prioritize large families, less contraceptive use, and differences in partnership formation (e.g., higher prevalence of marriage and/or less divorce). Nonetheless, the aforementioned studies of religiosity and fertility focus primarily on fertility differences between practicing and nonpracticing Christians. Studies that examine Muslim fertility have shown that the total fertility rate of women from Muslim-majority countries in France is higher than that of nonmigrant-origin French women (Stonawski, Potančoková, and Skirbekk 2015; Toulemon 2004; Westoff and Frejka 2007), but limited research explores why Muslim women have higher fertility than other groups.
3. What accounts for higher Muslim fertility in France?
In what follows, we highlight important socioeconomic and sociocultural differences between Muslim and non-Muslim women in France that might influence both their ideal and realized fertility. Although our analysis focuses on fertility preferences as an important explanation for realized fertility, we recognize that other factors may also influence fertility, such as access to and usage of contraception and partnership formation patterns. This range of factors is discussed in this section, and we recognize that it is possible that multiple factors simultaneously might influence fertility processes.
attainment than nonmigrant French populations and thus face obstacles accessing employment and education necessary for social mobility (Alba and Foner 2015; Stonawski, Potančoková, and Skirbekk 2015). Furthermore, second-generation migrants have on average lower education and higher unemployment than the native French population due primarily to the low socioeconomic status (SES) of their parents (Ichou and Hamilton 2013; Ichou et al. 2017; Meurs, Pailhé, and Simon 2006). This matters because women’s education and labor force participation – key measures of SES – are negatively correlated with women’s fertility due to knowledge transmission, socioeconomic mobility, rising material aspirations, ideational changes, and the perception of children as costs (Becker and Lewis 1974; Caldwell 1980; Lesthaeghe and Surkyn 1988). Social class is also correlated with fertility: With lower SES, women often desire and have more children (Bollen, Glanville, and Stecklov 2001). In part this could be because children provide a source of comfort and stability even in difficult economic circumstances (Edin and Kefalas 2011).
In addition, Muslim fertility could be higher in France due to differences in sociocultural factors such as higher religiosity and corresponding attitudes, norms, and aspirations that prioritize large family sizes. First- and second-generation Muslim immigrants in France (and elsewhere in Europe) have on average higher religiosity than that of native populations (Connor 2009; van Tubergen 2006; Westoff and Frejka 2007). More religious people often espouse family norms and schema that prioritize large family sizes and ‘traditional’ gender roles where childbearing is central to women’s self-concepts (Goldscheider 2006). Research from the United States indicates that differences in fertility between more and less religious women can be explained largely by higher intended fertility, differences in family ideologies (e.g., sociocultural schemas prioritizing marriage and family), and gender identities where childbearing is central to women’s identities (Hayford and Morgan 2008). Likewise, a cross-national comparative study pooling data from 13 European countries finds that Muslim women’s higher religiosity and higher adherence to ‘traditional’ values (e.g., values that prioritize the family as an institution and the role of women as maternal caregivers) play an important role in explaining their higher fertility (Westoff and Frejka 2007).
both Catholics and Muslims (Moreau, Trussell, and Bajos 2013). However, the study finds no significant association between identifying as Muslim and reports of currently using an effective method of contraception.
Finally, many French Muslims are of migrant origin, which may influence both socioeconomic background and sociocultural norms in important dimensions (Stonawski, Potančoková, and Skirbekk 2015). First-generation migrants from high-fertility countries often have higher high-fertility than nonmigrant populations in France and other European countries (Afulani and Asunka 2017; Andersson 2004; Coleman and Dubuc 2010; Héran and Pison 2007; Milewski 2007, 2010; Toulemon 2004). In general, the fertility of second-generation migrants often decreases due to the influence of the host society and processes of adaptation and assimilation to the fertility norms of the host country (Kulu et al. 2017; Milewski 2010; Pailhé 2017), although there are exceptions to this trend – for example, descendants from Turkey have higher first- and second-birth transition rates than nonmigrant French women (Pailhé 2017).
Migrant fertility could additionally be higher than nonmigrant fertility because of adherence to norms that prioritize large family sizes that are developed in adolescence and early adulthood prior to migration (Barber 2001). For first-generation migrants in particular, adaptation to destination contexts may be difficult due to barriers to education and employment among migrants. At the same time, high fertility could reflect migrants’ difficulty accessing reproductive health services due to a lack of resources and tenuous legal status and/or social norms that discourage contraceptive use. A study using the TeO data suggests that migrants in France have significantly lower modern contraceptive use than natives (Poncet et al. 2013), although this study does not explore whether this is due to differences in contraceptive access or differences in norms about desired family size and contraceptive use.
4. Data
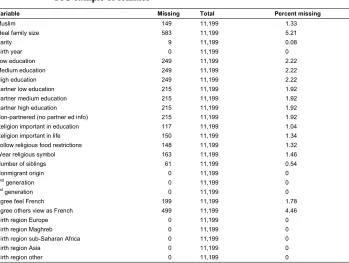
respondents (Table 1). Appendix Table A-1 presents the number of missing values for the variables used in the analysis for the full sample of women in the TeO. As a supplement, we rerun the main analysis using multiple imputations for missing values (Appendix Table A-2).
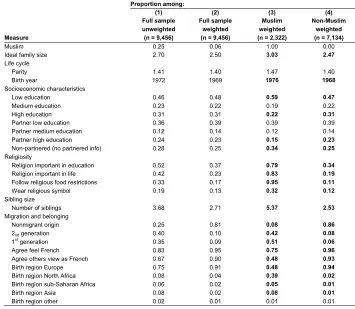
Table 1: Descriptive statistics for women from the TeO sample used in this analysis, France 2008/2009. Columns 2–4 are weighted to be nationally representative using survey weights provided by TeO (n = 9,456)
Proportion among:
(1) (2) (3) (4)
Full sample Full sample Muslim Non-Muslim
unweighted weighted weighted weighted
Measure (n = 9,456) (n = 9,456) (n = 2,322) (n = 7,134)
Muslim 0.25 0.06 1.00 0.00
Ideal family size 2.70 2.50 3.03 2.47
Life cycle
Parity 1.41 1.40 1.47 1.40
Birth year 1972 1969 1976 1968
Socioeconomic characteristics
Low education 0.46 0.48 0.59 0.47
Medium education 0.23 0.22 0.19 0.22
High education 0.31 0.31 0.22 0.31
Partner low education 0.36 0.39 0.39 0.39
Partner medium education 0.12 0.14 0.12 0.14 Partner high education 0.24 0.23 0.15 0.23
Non-partnered (no partnered info) 0.28 0.25 0.34 0.25
Religiosity
Religion important in education 0.52 0.37 0.79 0.34
Religion important in life 0.42 0.23 0.83 0.19
Follow religious food restrictions 0.33 0.17 0.95 0.11
Wear religious symbol 0.19 0.13 0.32 0.12
Sibling size
Number of siblings 3.68 2.71 5.37 2.53
Migration and belonging
Nonmigrant origin 0.25 0.81 0.08 0.86
2nd generation 0.40 0.10 0.42 0.08
1st generation 0.35 0.09 0.51 0.06
Agree feel French 0.83 0.95 0.75 0.96
Agree others view as French 0.67 0.90 0.48 0.93
Birth region Europe 0.75 0.91 0.48 0.94
Birth region North Africa 0.08 0.04 0.39 0.02
Birth region sub-Saharan Africa 0.06 0.02 0.05 0.01
Birth region Asia 0.08 0.02 0.08 0.01
Birth region other 0.02 0.01 0.01 0.01
This data set is particularly well suited for this analysis because it is rare to find micro-level religion data on France since the French state does not collect religious information in the census or other state-led surveys, and before 2008, French law made it difficult to collect information on religion (although there are exceptions with religion data, such as the 1992 Geographic Mobility and Social Integration survey). Furthermore, it is rare to have an adequately large sample of Muslim respondents to conduct this type of analysis since Muslims still represent a comparatively small proportion of the population and most surveys do not oversample Muslim populations. Many other European countries also do not collect information on religion in censuses, and this paucity of data may account for why the topic has remained relatively unexplored, particularly compared to a larger literature on religiosity and fertility among Christians. One exception is an aforementioned study by Westoff and Frejka (2007) using the European Values Survey, though the very low number of Muslims in the sample means the authors must pool across three survey waves (over ten years) and pool across multiple countries.
5. Measures
Columns 1 and 2 of Table 1 provide the proportions (and means for the continuous measures) for all independent variables in the analysis. Column 1 is unweighted and Column 2 is weighted; we use sampling weights throughout the analyses, thus most of the descriptive statistics in the paper reference Column 2 unless otherwise specified.
Muslim:We create a dichotomous indicator of whether the respondent identifies as
Muslim using a question about self-reported religious affiliation. We use self-reported religious identification to be consistent with the conventions of the literature (Berghammer 2012; Hayford and Morgan 2008; Philipov and Berghammer 2007). In total 25% of the unweighted sample self-identifies as Muslim (n = 2,322). Upon using sampling weights to make the sample nationally representative, 6% of the sample is Muslim, which is consistent with national statistics of the time.
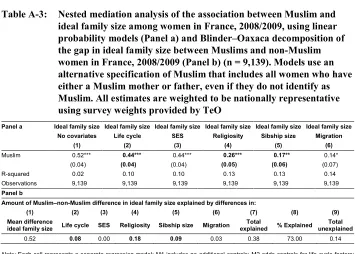
rerun all analyses with an alternative measure of Muslim adherence based on parental religion (Appendix Table A-3).4
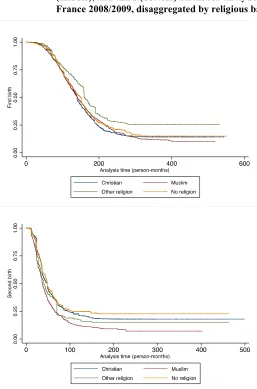
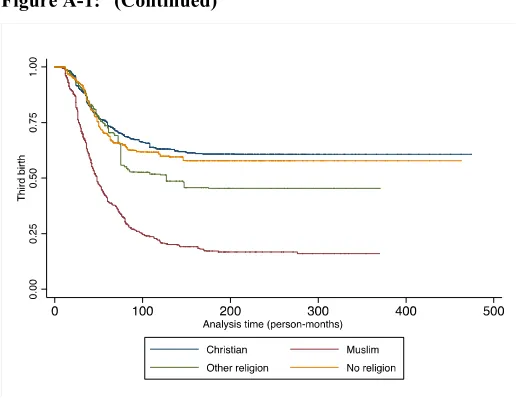
Our focus on a binary Muslim–non-Muslim distinction in the study is necessary for the Blinder–Oaxaca decomposition exercise described below. The vast majority of non-Muslim women in our sample either identify as Christian (54%) or no religious identification (38%) (Table 2). We focus on the comparison between Muslim women and all other groups because of the high levels of non-religiously identifying women in France and the high rates of secularism even among women who identify as Christian.5 Supplementary analyses suggest that the fertility trajectories of Christian and non-religiously identifying women are relatively comparable, thereby at least partially justifying our comparison of Muslim women with the pooled group of women of varying religious backgrounds (Appendix Figure A-1). As a further supplement, we re-run the main analyses with just Muslim and Christian women (Appendix Table A-4).
Table 2: Proportions of different religions in the analytical sample of women in France 2008/2009, weighted to be nationally representative using survey weights provided by TeO (n = 9,456)
(1)
Christian 0.54 Muslim 0.06
Other 0.02
None 0.38
Life cycle factors: We control for life cycle characteristics that might influence
fertility ideals and contraceptive use, including birth year, birth year squared, and current parity.
Socioeconomic characteristics:Our main measure of SES is the educational status
of both women and their partners because education is a key measure of SES, with important implications for earnings potential and asset accumulation. We include dichotomous indicators for low education (less than high school education), medium education (completed high school), and high education (some tertiary and above). Women who are not partnered are coded as ‘no partner’ for the partner education variable.
4 In this alternative measure, women are coded as Muslim if they have either a Muslim mother or father, even
if they do not report that they are Muslim. Of the 361 women with a Muslim parent who do not consider themselves Muslim, only about half (n = 172) have both a Muslim mother and father, and the other 189 have one Muslim parent and one parent of another religious background. In this alternative measure of Muslim, 46 women who do not have Muslim parents but report being Muslim are coded as non-Muslims because they did not have Muslim parentage.
5 Only about 30% of women who identify as Christian in our sample report that religion is important to their
Religiosity:We include several measures of religiosity that capture diverse aspects of this multifaceted concept. To control for religiosity in early childhood we include an indicator variable for whether the respondent reports that religion was somewhat or very important in her education (compared to not at all or a little important). To control for current religiosity, we include a control for whether the respondent reports that religion is important in her current life (compared to not at all or a little). We also include an indicator for whether the respondent sometimes or always respects religious food recommendations (compared to not at all) and whether the respondent sometimes or always wears a religious symbol (compared to not at all). We do not include a measure about regular religious attendance because many Muslim women do not regularly attend mosques for prayer, thus this is a poor measure of their religiosity.
Siblings: We include a continuous measure of the number of respondents’ siblings.
This may proxy for norms valuing large family sizes learned in childhood since research suggests that norms about childbearing and desired family size are shaped by experiences and socialization in childhood (Barber 2001).
Migration status: Migration status may influence women’s fertility preferences
and behaviors through processes of socialization and adaptation, thus we include indicators for first-generation migrant origin, second-generation migrant origin, and nonmigrant origin. Residents of French overseas territories (e.g., DOM-TOM) are coded as nonmigrant origin French because they have full citizenship rights, which may influence both fertility norms and reproductive health access. We also include two measures designed to capture feelings of integration and belonging into French society: (1) an indicator for whether the respondent reports feeling French and (2) an indicator for whether the respondent reports that others view her as French. Finally, we include indicator controls for the region of respondents’ birth, including Europe, North Africa, sub-Saharan Africa, Asia, and other regions.6
Ideal family size:To measure ideal family size, we look at a continuous measure
of stated ideal number of children in a family, constructed from the following question: “According to you what is the ideal number of children in a family?” Respondents who give an answer higher than 15 (n = 8) are coded as 15. Ideal family size provides an important and widely used measure of the values and norms associated with having a low versus high number of children (Bulatao 1981; Hayford 2009; Heiland, Prskawetz, and Sanderson 2008; Lee 1980; Liefbroer 2008; Udry 1983; Yeatman, Sennott, and Culpepper 2013).
Nonetheless, there are several limitations of this measure. First, ideal family size may change over the life course in conjunction with women’s experiences and life
6 Other scholars have raised concern about whether region of birth is colinear with religion in France (Pailhé
cycle events (Hayford 2009). Related to this, women may not want to report current children as unwanted, thus they may adjust their ideal family size based on their current children (Pritchett 1994). To partially address these concerns, we control for both birth year, birth year squared, and parity in models predicting ideal family size.7 A final concern is that ideal family size is not the same as intended or expected family size, though these concepts are closely related (Ryder and Westoff 1967). Although we do not have measures of fertility intentions or expectations in the data, changes in preferences (such as ideal family size) are widely viewed as a prerequisite for changes in intentions (Easterlin 1975).
6. Analysis
First, we conduct two-tailed independent sample t-tests on ideal family size and respondent background characteristics. This provides insights into how Muslim and non-Muslim respondents differ in our main outcome and in the background characteristics that may help explain why Muslim women’s fertility ideals differ from their non-Muslim counterparts. Upon showing how Muslim and non-Muslim French women differ in ideal family sizes and key background characteristics, we focus on better understanding differences in ideal family size between Muslim and non-Muslim respondents. To this end, we conduct a multivariate nested mediation analysis where we sequentially introduce blocks of controls to observe how the Muslim coefficient changes in magnitude and significance across models.8 This type of analysis provides important insights into which types of background characteristics suggest mediation (Mustillo, Lizardo, and McVeigh 2018).
Next, we conduct a nested two-part Blinder–Oaxaca decomposition analysis. The Blinder–Oaxaca decomposition is an adaptation of a standard linear regression that has been widely used to study mean differences between two groups (Blinder 1973; Oaxaca 1973). The Blinder–Oaxaca can be understood as follows: We start by estimating separate linear regressions for individualsi among Muslims (group a) and non-Muslims (group b), where X is a vector of explanatory variables, and are vectors of coefficients, and is the error term, seen in the following equations (Equations 1 and 2):
= + (1)
and
7 As a supplement we run models with birth year fixed effects; results are the same and are available upon
request.
8 To be in line with the Blinder–Oaxaca decomposition, we use linear probability models for this analysis
= + . (2)
Given that and are the regression estimates of and , it follows that
−
=( ) − ( )
=( − ) +( )( − ). (3)
The first part of the last line of Equation (3) is the part of the mean difference in ideal family size between Muslim and non-Muslims that is due to between-group differences in the explanatory variablesX (e.g., religiosity or education), and the second part is the part that remains unexplained by differences in observed characteristics. 9 We follow the same model-building approach as in the nested analysis where we sequentially introduce blocks of controls to observe how much of the Muslim–non-Muslim difference in ideal family size is explained by subsequent controls. The decomposition is implemented in Stata 15 using the Oaxaca command. As is the case with standard linear regression, the Blinder–Oaxaca approach explores associations only and not causality.
7. Results
7.1 Descriptive overview of how Muslim women in the sample differ in ideal family size and background characteristics
Table 1 shows that Muslim women have significantly higher average ideal family sizes than their non-Muslim counterparts. On average, Muslim women’s ideal family size is about 3 children, whereas non-Muslim women’s average ideal family size is about 2.5 children. This suggests that Muslim women have an ideal family size that is about 20% higher than non-Muslim women.10
9 A three-part decomposition would decompose the gap in ideal family size into three parts: (1) the part due to
‘endowments,’ which was the part attributable to differences in the distribution of background characteristics such as religiosity, education, and employment; (2) the part due to ‘coefficients,’ which was the part attributable to differences in the ‘effects’ of these characteristics on ideal family size; and (3) the interaction between the endowments and coefficients. Our analysis is principally interested in understanding the endowment effect, thus we utilize a two-fold approach. Furthermore, subsequent analysis (available upon request) indicates that only the endowment effect is a significant predictor of the total gap in ideal family size.
10 There is no statistical difference between the parity of Muslim and non-Muslim women in Table 1, which is
Muslim women also differ on key socioeconomic and sociocultural background variables that might be correlated with ideal family size. Muslim women are significantly more likely to be low educated and significantly less likely to be highly educated. For example, 59% of Muslim women in the sample were in the low-education category compared to 47% of non-Muslim women. At the other end of the spectrum, 22% of Muslim women in the sample were in the high-education category compared to 31% of non-Muslim women.
In addition to socioeconomic differences, Muslim women’s religiosity is significantly higher than that of non-Muslim women. For example, 79% of Muslim women report that religion was important to their education compared to 34% of non-Muslim women. Likewise, 83% of non-Muslim women report that religion is important in their life, compared to 19% of non-Muslim women. The higher religiosity of Muslim women might correspond with higher desired fertility given that more religious women often prioritize having larger families (Goldscheider 2006). Differences in ideal family size between Muslims and non-Muslims could also reflect differences in family background and norms about family size, since Muslim women in the sample were significantly more likely to come from families with more siblings than non-Muslim women. On average Muslim respondents had 5.37 siblings compared to only 2.53 for non-Muslim respondents.
There are also important differences in migration status between Muslim and non-Muslim women. Only 8% of non-Muslim women in the sample are of nonmigrant origin, compared to 86% of non-Muslim women in the sample. Likewise, 48% of Muslim women were born in Europe compared to 94% of non-Muslim women. Among Muslim women not born in Europe, most come from North Africa (39%), followed by Asia (8%), and sub-Saharan Africa (5%). Muslim women in the sample are also significantly less likely to feel integrated into mainstream French society, which could extend to feeling less integrated into French fertility and family norms as well. For example, Muslim women were significantly less likely to report “feeling French” or that others view them as French than women of other religious backgrounds. Indeed, although 75% of Muslim women report feeling French, only 48% report that others in France view them as French.
7.2 Exploration of why Muslim women have higher ideal family sizes using nested mediation analysis and decomposition of the gap in ideal family size
The preceding descriptive analysis indicated that Muslim women had higher ideal family sizes and differed from their non-Muslim counterparts in important dimensions – including lower socioeconomic status and higher religiosity – that may be important for explaining their higher ideal family sizes. Our subsequent analyses unpack observed differences in ideal family sizes between Muslim and non-Muslim women. Table 3 provides results of a multivariate nested mediation analysis where we sequentially introduce blocks of controls to observe how the Muslim coefficient changes in magnitude and significance across models. Table 4 presents results of a nested decomposition analysis where we follow the same strategy of sequentially introducing controls to observe how much of the Muslim–non-Muslim difference in ideal family size is explained by subsequent blocks of controls.
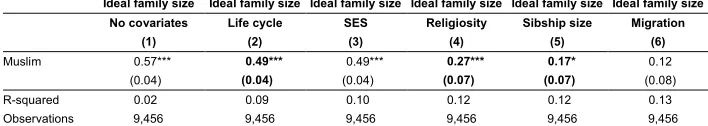
Table 3: Nested mediation analysis of the association between Muslim and ideal family size among women in France, 2008/2009, using linear probability models. All estimates are weighted to be nationally representative using survey weights provided by TeO (n = 9,456)
Ideal family size Ideal family size Ideal family size Ideal family size Ideal family size Ideal family size No covariates Life cycle SES Religiosity Sibship size Migration
(1) (2) (3) (4) (5) (6)
Muslim 0.57*** 0.49*** 0.49*** 0.27*** 0.17* 0.12 (0.04) (0.04) (0.04) (0.07) (0.07) (0.08)
R-squared 0.02 0.09 0.10 0.12 0.12 0.13
Observations 9,456 9,456 9,456 9,456 9,456 9,456
Note: Each cell represents a separate regression model: M1 includes no additional controls; M2 adds controls for life cycle factors; M3 adds controls for socioeconomic factors; M4 adds controls for religiosity; M5 adds controls for sibling size; and M6 adds controls for migration background. Bold numbers indicate statistically significant (p < 0.05) differences between the Muslim coefficient in the indicated model from a preceding model. Robust standard errors in parentheses. *** p<0.001, ** p<0.01, * p<0.05.
include a control for sibling size – which may proxy for norms valuing large family size learned in childhood – the Muslim coefficient falls even further to 0.17 (a difference that is statistically significant). Finally, upon including controls for migration status, the Muslim coefficient falls again to 0.12, although this is not statically different from the magnitude of the Muslim coefficient in the preceding model. Nonetheless, it is worth noting that upon including all the control variables, the Muslim variable is no longer a significant predictor of ideal family size.
Table 4 presents results of the Blinder–Oaxaca decomposition, which decomposes the 0.57 gap in ideal family size into the parts attributable to differences in the distribution of background characteristics such as religiosity, education, and migration status. Columns 2–6 each represent a separate decomposition where a new block of covariates has been introduced, which tells the amount of the 0.57 difference in ideal family size between Muslim and non-Muslim women that is explained by the given set of covariates. Columns 7 and 8 show that 77% ((0.44/0.57)*100) of the difference in mean ideal family size between Muslim and non-Muslim women is explained by differences in background characteristics controlled for in the model. Column 9 presents the unexplained portion of the mean difference in ideal family size from the model when all covariates are included and is the same as the coefficient for Muslim in the final ordinary least squares (OLS) model in Table 3 Column 6.
Table 4: Blinder–Oaxaca decomposition of the gap in ideal family size between Muslims and non-Muslim women in France, 2008/2009. All estimates are weighted to be nationally representative using survey weights provided by TeO (n = 9,456)
Amount of Muslim–non-Muslim differences in ideal family size explained by differences in:
(1) (2) (3) (4) (5) (6) (7) (8) (9)
Mean difference in
ideal family size Life cycle SES Religiosity Sibshipsize Migration explainedTotal % Explained unexplainedTotal
0.57 0.08 0.00 0.23 0.10 0.05 0.44 77 0.12
Note: Each cell represents a separate decomposition: M1 includes no additional controls; M2 adds controls for life cycle factors; M3 adds controls for socioeconomic factors; M4 adds controls for religiosity; M5 adds controls for sibling size; and M6 adds controls for migration background. Bold numbers indicate statistically significant (p < 0.05) differences between the Muslim coefficient in the indicated model from a preceding model. Due to rounding, the values in Columns 2–6 might not add up to Column 7 and the values in Columns 7 and 9 might not add up to Column 1. *** p<0.001, ** p<0.01, * p<0.05.
Table 4 shows that about half ((0.23/0.44)*100) of the average difference in ideal family size between Muslim and non-Muslim women that is explained in the model can be attributed to differences in religiosity.11 Likewise, almost a quarter ((0.10/0.44)*100)
11 We divide by 0.44 rather than 0.57 because we are interested in understanding what percentage of the
of the average difference in ideal family size between Muslim and non-Muslim women explained in the model can be attributed to differences in sibling size. Life cycle factors play some role in accounting for the gap in ideal family size, explaining about 18% ((0.08/0.44)*100) of the average difference in ideal family size explained by the model. On the other hand, socioeconomic status and migration status play a lesser role, explaining less than 0% and 11% of the average difference in ideal family size explained in the model, respectively.
Taken together, the results from the nested mediation and Blinder–Oaxaca decomposition suggest that differences in religiosity and sibling size between Muslim and non-Muslim women play an important role in explaining the gap in ideal family size between French Muslim and non-Muslim women, whereas socioeconomic background and migration status play a comparatively lesser role. While our data does not include questions about women’s values and family norms that would allow us to confirm a link between religiosity and norms/values, our findings correspond with what has been found in a broader literature on religiosity and fertility among Christian populations.
8. Supplementary analyses
While the focus of our paper is on better understanding the linkages between religion and fertility ideals, we recognize that other factors could also be influencing women’s fertility, including partnership formation and contraceptive access and use. To better understand these factors, we also present supplementary descriptive statistics on how partnership status, health insurance, and contraceptive use differ by religious background (Appendix Table A-5).12 Muslim women were significantly less likely to be partnered at the time of the TeO survey, which likely reflects that Muslim women in our sample were significantly younger than non-Muslims (Table 1). Perhaps related to their different partnership statuses, Appendix Table A-5 shows that Muslim women also had significantly lower current usage of modern methods of contraception than non-Muslim women and lower usage of highly effective, long-acting, reversible contraceptive methods. While lower modern contraceptive use could have reflected higher fertility ideals and/or differential partnership statuses, Muslim women were also significantly more likely to report having more children than they wanted, which suggested some degree of an unmet need for family planning stratified by religion. Overall 99% of the sample of both Muslim and non-Muslim respondents had health insurance, which suggests that differential access to medical care did not explain differences in contraceptive use. Taken together, these descriptive findings point to a need for further research on the contraceptive use and reproductive health care needs of socioeconomically disadvantaged religious minorities, particularly those of migrant origin.
9. Discussion
Although Muslim women’s high fertility has led to extensive discussion about the changing sociodemographic characteristics of the French population, there has been limited exploration of why Muslim women have, on average, more children than other populations. Our analysis explored this topic, with particular attention to better understanding differences in fertility ideals as an important explanation for higher desired and realized fertility.
We started by showing descriptively that Muslim women in France had, on
average, higher ideal family sizes than non-Muslim women, and these differences were maintained across age groups. Nonetheless, we found Muslim women’s higher ideal family sizes could largely be explained by higher religiosity and higher numbers of siblings (we argue the latter proxies for norms prioritizing large family sizes). On the
12 We conceptualize contraception use as a proximate determinant of fertility that is likely decided by ideal
other hand, differences in socioeconomic status and migration status were comparatively less important in explaining Muslim women’s higher ideal family sizes. These findings corresponded with research suggesting that religiosity – rather than religion or socioeconomic factors – was associated with higher fertility among Christian women in Europe and the United States (Hayford and Morgan 2008;
Berghammer 2012; Philipov and Berghammer 2007). Nonetheless, we extend this
literature in important dimensions by focusing on the case of Muslims in France and showing that Muslim women’s higher desired fertility was not an anomaly or exceptional but part of a larger set of patterns common to more religious women from diverse religious backgrounds.
Although our study provided valuable insights into better understanding Muslim women’s fertility in contemporary France, it had limitations. First, we used cross-sectional data, which limited our abilities to directly link fertility preferences to past fertility behaviors. Second, we did not have information about gender attitudes and ideologies that might influence ideal/realized fertility and which were likely important for understanding the linkages between religion and fertility.
Nonetheless, the study represented an important step in understanding higher Muslim fertility in France and made a contribution to existing work on fertility, migration, and religion. In contemporary France – as in much of Europe – challenges to the future of a French identity have been linked with a growing Muslim population.
High religiosity among Muslim migrant populations, coupled with a state policy of
Laïcité –or secularism in public affairs –has made religion a source of social division
in contemporary France (Alba 2005; Alba and Foner 2015) and contributed to an
ongoing debate about how future generations might be different with respect to religion
and other markers of social and cultural identity (Coleman 2006; Goldstone 2010;
Kaufmann, Goujon, and Skirbekk 2012). We demonstrated the importance of contextualizing French Muslim women’s higher ideal family sizes within a larger set of consistent and socially constructed patterns common to more religious women in general rather than the specific case of Islam. Our analysis demonstrated the relevance of dissecting religious differences in fertility ideals (particularly among migrant populations) with more nuance and discernment as part of a broader exploration of the social factors that influence fertility.
10. Acknowledgements
References
Adsera, A. (2007). Reply to the note by Neuman ‘Is fertility indeed related to religiosity?’. Population Studies 61(2): 225–230. doi:10.1080/00324720701 300339.
Afulani, P.A. and Asunka, J. (2017). Socialization, adaptation, transnationalism, and the reproductive behavior of sub-Saharan African migrants in France.
Population Research and Policy Review 34(4): 561–592.
doi:10.1007/s11113-015-9360-2.
Alba, R. (2005). Bright vs. blurred boundaries: Second-generation assimilation and exclusion in France, Germany, and the United States.Ethnic and Racial Studies
28(1): 20–49.doi:10.1080/0141987042000280003.
Alba, R. and Foner, N. (2015).Strangers no more: Immigration and the challenges of
integration in North America and Western Europe. Princeton: Princeton
University Press.doi:10.23943/princeton/9780691161075.001.0001.
Andersson, G. (2004). Childbearing after migration: Fertility patterns of foreign-born women in Sweden. International Migration Review 38(2): 747–774.
doi:10.1111/j.1747-7379.2004.tb00216.x.
Barber, J.S. (2001). The intergenerational transmission of age at first birth among married and unmarried men and women. Social Science Research 30(2): 219– 247.doi:10.1006/ssre.2000.0697.
Baudin, T. (2015). Religion and fertility: The French connection. Demographic
Research 32(13): 397–420.doi:10.4054/demres.2015.32.13.
Baykara-Krumme, H. and Milewski, N. (2017). Fertility patterns among Turkish women in Turkey and abroad: The effects of international mobility, migrant generation, and family background. European Journal of Population 33(3): 409–436.doi:10.1007/s10680-017-9413-9.
Becker, G.S. and Lewis, H.G. (1974). On the interaction between quantity and quality of children. Journal of Political Economy 81(2): S279–S288. doi:10.1086/ 260166.
Blinder, A.S. (1973). Wage discrimination: Reduced form and structural estimates.The
Journal of Human Resources 8(4): 436–455.doi:10.2307/144855.
Bollen, K.A., Glanville, J.L., and Stecklov, G. (2001). Socioeconomic status and class in studies of fertility and health in developing countries. Annual Review of
Sociology 27: 153–185.doi:10.1146/annurev.soc.27.1.153.
Brañas-Garza, P. and Neuman, S. (2007). Parental religiosity and daughters’ fertility: The case of Catholics in southern Europe. Review of Economics of the
Household 5: 305–327.doi:10.1007/s11150-007-9011-4.
Bulatao, R.A. (1981). Values and disvalues of children in successive childbearing decisions.Demography 18(1): 1–25.doi:10.2307/2061046.
Caldwell, J. (1980). Mass education as a determinant of the timing of fertility decline.
Population and Development Review 6(2): 225–255.doi:10.2307/1972729.
Coale, A.J. (1973). The demographic transition reconsidered. In: Proceedings of the
International Population Conference, Liege, 1973. Liege: International Union
for the Scientific Study of Population: 53–72.
Coleman, D. (2006). Immigration and ethnic change in low-fertility countries: A third demographic transition. Population and Development Review 32(3): 401–446.
doi:10.1111/j.1728-4457.2006.00131.x.
Coleman, D.A. and Dubuc, S. (2010). The fertility of ethnic minorities in the UK, 1960s–2006. Population Studies 64(1): 19–41. doi:10.1080/0032472090339 1201.
Connor, P. (2009). Contexts of immigrant receptivity and immigrant religious outcomes: The case of Muslims in Western Europe. Ethnic and Racial Studies
33(3): 376–403.doi:10.1080/01419870902935963.
Dharmalingam, A. and Morgan, P. (2004). Pervasive Muslim–Hindu fertility differences in India.Demography 41(3): 529–545.doi:10.1353/dem.2004.0020. Easterlin, R.A. (1975). An economic framework for fertility analysis.Studies in Family
Planning 6(3): 54–63.doi:10.2307/1964934.
Edin, K. and Kefalas, M. (2011). Promises I can keep. Berkeley: University of California Press.
Goldscheider, C. (2006). Religion, family, and fertility: What do we know historically and comparatively? In: Derosas, R. and van Poppel, F. (eds.). Religion and the
decline of fertility in the western world. Dordrecht: Springer: 41–57.
doi:10.1007/1-4020-5190-5_3.
Goldstone, J. (2010). The new population bomb: The four megatrends that will change the world.Foreign Affairs89(1):31‒43.
Hackett, C., Connor, P., Stonawski, M., and Washington, V.S. (2015). The future of world religions: Population growth projections, 2010–2050. Washington, D.C.: Pew Research Center. https://assets.pewresearch.org/wp-content/uploads/sites/ 11/2015/03/PF_15.04.02_ProjectionsFullReport.pdf.
Halman, L. and Draulans, V. (2006). How secular is Europe? The British Journal of
Sociology 57(2): 263–288.doi:10.1111/j.1468-4446.2006.00109.x.
Hayford, S. (2009). The evolution of fertility expectations over the life course.
Demography 46(4): 765–783.doi:10.1353/dem.0.0073.
Hayford, S.R. and Morgan, S.P. (2008). Religiosity and fertility in the United States: The role of fertility intentions. Social Forces 86(3): 1163–1188. doi:10.1353/ sof.0.0000.
Heaton, T.B. (2010). Does religion influence fertility in developing countries?
Population Research and Policy Review 30(3): 449–465.
doi:10.1007/s11113-010-9196-8.
Heiland, F., Prskawetz, A., and Sanderson, W.C. (2008). Are individuals’ desired family sizes stable? Evidence from West German panel data.European Journal
of Population 24(2): 129–156.doi:10.1007/s10680-008-9162-x.
Héran, F. and Pison, G. (2007). Deux enfants par femme dans la France de 2006: La faute aux immigrées?Population and Societies 432: 1–4.
Ichou, M. and Hamilton, P. (2013). Different origins and the origin of differences: The academic achievement of children of emigrants/immigrants in France from the start of primary school to the end of compulsary education.Revue Française De
Sociologie 54(1): 5–52.doi:10.3917/rfs.541.0005.
Ichou, M., Goujon, A., and the DiPAS team (2017). Immigrants’ educational attainment: A mixed picture, but often higher than the average in their country of origin.Population Societies 541: 1–4.
Johnson-Hanks, J. (2006). On the politics and practice of Muslim fertility. Medical
Anthropology Quarterly 20(1): 12–30.doi:10.1525/maq.2006.20.1.12.
Johnson-Hanks, J.A., Bachrach, C.A., Morgan, S.P., and Kohler, H.P. (2011).
Understanding family change and variation: Toward a theory of conjunctural
action. Dordrecht: Springer.doi:10.1007/978-94-007-1945-3.
Karim, M.S. (1997). Reproductive behavior in Muslim countries. Calverton: Macro International (DHS Working Papers 23). https://www.dhsprogram.com/pubs/ pdf/WP23/WP23.pdf.
Kaufmann, E. (2008). Islamism, religiosity and fertility in the Muslim world. Paper presented at the European Population Conference, Barcelona, Spain, July 9–12, 2008.
Kaufmann, E., Goujon, A., and Skirbekk, V. (2012). The end of secularization in Europe? A socio-demographic perspective.Sociology of Religion 73(1): 69–91.
doi:10.1093/socrel/srr033.
Kent, M. (2008). Do Muslims have more children than other women in Western Europe? [electronic resource]. Washington, D.C.: Population Reference Bureau.
https://www.prb.org/muslimsineurope/.
Knodel, J., Gray, R.S., Sriwatcharin, P., and Peracca, S. (1999). Religion and reproduction: Muslims in Buddhist Thailand. Population Studies 53(2): 149– 164.doi:10.1080/00324720308083.
Kulu, H., Hannemann, T., Pailhé, A., Neels, K., Krapf, S., González-Ferrer, A., and Andersson, G. (2017). Fertility by birth order among the descendants of immigrants in selected European countries.Population and Development Review
43(1): 31–60.doi:10.1111/padr.12037.
Laurence, J. and Vaisse, J. (2006).Integrating Islam: Political and religious challenges
in contemporary France. Washington, D.C.: Brookings Institution Press.
Lee, R.D. (1980). Aiming at a moving target: Period fertility and changing reproductive goals. Population Studies 34(2): 205–226. doi:10.1080/00324728.1980.10410 385.
Lesthaeghe, R. and Wilson, C. (1986). Modes of production secularization and the pace of the fertility decline in Western Europe 1870–1930. In: Coale, A.J. and Watkins, S. (eds.). The decline of fertility in Europe. Princeton: Princeton University Press.
Liefbroer, A.C. (2008). Evolution des intentions en matière de taille de famille en début d’âge adulte: Une approche biographique. European Journal of Population
25(4): 363–386.doi:10.1007/s10680-008-9173-7.
McQuillan, K. (2004). When does religion influence fertility? Population and
Development Review 30(1): 25–26.doi:10.1111/j.1728-4457.2004.00002.x.
Meurs, D., Pailhé, A., and Simon, P. (2006). The persistence of intergenerational inequalities linked to immigration: Labour market outcomes for immigrants and their descendants in France. Population 61(5): 645–682. doi:10.3917/pope. 605.0645.
Milewski, N. (2007). First child of immigrant workers and their descendants in West Germany. Demographic Research 17(29): 859–896.doi:10.4054/DemRes.2007. 17.29.
Milewski, N. (2010). Immigrant fertility in West Germany: Is there a socialization effect in transitions to second and third births?European Journal of Population
26(3): 297–323.doi:10.1007/s10680-010-9211-0.
Moreau, C., Trussell, J., and Bajos, N. (2013). Religiosity, religious affiliation, and patterns of sexual activity and contraceptive use in France. The European
Journal of Contraception and Reproductive Health Care 18(3): 168–180.
doi:10.3109/13625187.2013.777829.
Morgan, P., Stash, S., Smith, H.L., and Oppenheim-Mason, K. (2002). Muslim and non-Muslim differences in female autonomy and fertility: Evidence from four Asian countries. Population and Development Review 28(3): 515–537.
doi:10.1111/j.1728-4457.2002.00515.x.
Mustillo, S.A., Lizardo, O.A., and McVeigh, R.M. (2018). Editors’ comment: A few guidelines for quantitative submissions. American Sociological Review 83(6): 1281–1283.doi:10.1177/0003122418806282.
Oaxaca, R. (1973). Male–female wage differentials in urban labor markets.
International Economic Review 14(3): 693–709.doi:10.2307/2525981.
Okun, B.S. (2013). Fertility and marriage behavior in Israel. Demographic Research
Pailhé, A. (2008). French family policy: Long tradition and diversified measures.
Vienna Yearbook of Population Research 2008: 149–164. doi:10.1553/
populationyearbook2008s149.
Pailhé, A. (2017). The convergence of second-generation immigrants’ fertility patterns in France: The role of sociocultural distance between parents’ and host country.
Demographic Research 36(45): 1361–1398.doi:10.4054/demres.2017.36.45.
Peri-Rotem, N. (2018). Religion and fertility in Western Europe: Trends across cohorts in Britain, France and the Netherlands.European Journal of Population 32(2): 231–265.doi:10.1007/s10680-015-9371-z.
Philipov, D. and Berghammer, C. (2007). Religion and fertility ideals, intentions and behaviour: A comparative study of European countries. Vienna Yearbook of
Population Research 2007: 271–305.doi:10.1553/populationyearbook2007s271.
Poncet, L.C., Huang, N., Rei, W., Lin, Y.-C., and Chen, C.-Y. (2013). Contraceptive use and method among immigrant women in France: Relationship with socioeconomic status. The European Journal of Contraception and
Reproductive Health Care 18(6): 468–479.doi:10.3109/13625187.2013.835394.
Pritchett, L.H. (1994). Desired fertility and the impact of population policies.
Population and Development Review 20(1): 1–55.doi:10.2307/2137629.
Ryder, N.B. and Westoff, C.F. (1967). The trend of expected parity in the United States: 1955, 1960, 1965. Population Index 33(2): 153–168. doi:10.2307/ 2733064.
Simon, P. and Tiberj, V. (2013). Sécularisation ou regain religieux: la religiosité des immigrés et de leurs descendants [Secularization or religious revival: The religiosity of immigrants and their descendants]. Paris: INED (Documents du Travail 196). https://www.researchgate.net/profile/Patrick_Simon8/publication/ 301603553_Secularisation_ou_regain_religieux_la_religiosite_des_immigres_et _de_leurs_descendants/links/586d051a08ae329d62136ee7.pdf.
Stonawski, M., Potančoková, M., and Skirbekk, V. (2015). Fertility patterns of native and migrant Muslims in Europe.Population, Space and Place 22(6): 552–567.
doi:10.1002/psp.1941.
Toulemon, L. (2004). Fertility among immigrant women: new data a new approach.
Population and Societies 400: 1–4.
Toulemon, L., Pailhé, A., and Rossier, C. (2008). France: High and stable fertility.
Udry, J.R. (1983). Do couples make fertility plans one birth at a time? Demography
20(2): 117–128.doi:10.2307/2061230.
van de Walle, E. (1992). Fertility transition, conscious choice, and numeracy.
Demography 29(4): 487–502.doi:10.2307/2061848.
van Tubergen, F. (2006). Religious affiliation and attendance among immigrants in eight western countries: Individual and contextual effects. Journal for the
Scientific Study of Religion 45(1): 1–22.doi:10.1111/j.1468-5906.2006.00002.x.
Westoff, C.F. and Frejka, T. (2007). Religiousness and fertility among European Muslims. Population and Development Review 33(4): 785–809. doi:10.1111/j. 1728-4457.2007.00197.x.
Yeatman, S., Sennott, C., and Culpepper, S. (2013). Young women’s dynamic family size preferences in the context of transitioning fertility. Demography 50(5): 1715–1737.doi:10.1007/s13524-013-0214-4.
Zhang, L. (2008). Religious affiliation, religiosity, and male and female fertility.
Appendix
Figure A-1: (Continued)
Table A-1: Overview of missing values for the variables in our analysis in full TeO sample of females
Variable Missing Total Percent missing
Muslim 149 11,199 1.33
Ideal family size 583 11,199 5.21
Parity 9 11,199 0.08
Birth year 0 11,199 0
Low education 249 11,199 2.22
Medium education 249 11,199 2.22
High education 249 11,199 2.22
Partner low education 215 11,199 1.92
Partner medium education 215 11,199 1.92
Partner high education 215 11,199 1.92
Non-partnered (no partner ed info) 215 11,199 1.92 Religion important in education 117 11,199 1.04 Religion important in life 150 11,199 1.34 Follow religious food restrictions 148 11,199 1.32
Wear religious symbol 163 11,199 1.46
Number of siblings 61 11,199 0.54
Nonmigrant origin 0 11,199 0
2nd generation 0 11,199 0
1st generation 0 11,199 0
Agree feel French 199 11,199 1.78
Agree others view as French 499 11,199 4.46
Birth region Europe 0 11,199 0
Birth region Maghreb 0 11,199 0
Birth region sub-Saharan Africa 0 11,199 0
Birth region Asia 0 11,199 0
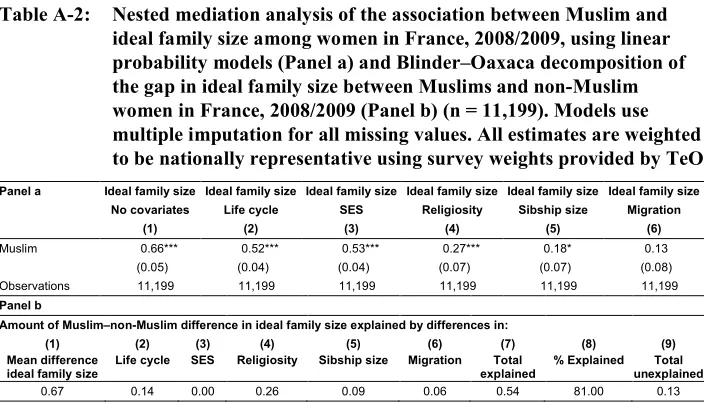
Table A-2: Nested mediation analysis of the association between Muslim and ideal family size among women in France, 2008/2009, using linear probability models (Panel a) and Blinder–Oaxaca decomposition of the gap in ideal family size between Muslims and non-Muslim women in France, 2008/2009 (Panel b) (n = 11,199). Models use multiple imputation for all missing values. All estimates are weighted to be nationally representative using survey weights provided by TeO
Panel a Ideal family size Ideal family size Ideal family size Ideal family size Ideal family size Ideal family size No covariates Life cycle SES Religiosity Sibship size Migration
(1) (2) (3) (4) (5) (6)
Muslim 0.66*** 0.52*** 0.53*** 0.27*** 0.18* 0.13 (0.05) (0.04) (0.04) (0.07) (0.07) (0.08) Observations 11,199 11,199 11,199 11,199 11,199 11,199
Panel b
Amount of Muslim–non-Muslim difference in ideal family size explained by differences in:
(1) (2) (3) (4) (5) (6) (7) (8) (9)
Mean difference
ideal family size Life cycle SES Religiosity Sibship size Migration explainedTotal % Explained unexplainedTotal
0.67 0.14 0.00 0.26 0.09 0.06 0.54 81.00 0.13
Table A-3: Nested mediation analysis of the association between Muslim and ideal family size among women in France, 2008/2009, using linear probability models (Panel a) and Blinder–Oaxaca decomposition of the gap in ideal family size between Muslims and non-Muslim women in France, 2008/2009 (Panel b) (n = 9,139). Models use an alternative specification of Muslim that includes all women who have either a Muslim mother or father, even if they do not identify as Muslim. All estimates are weighted to be nationally representative using survey weights provided by TeO
Panel a Ideal family size Ideal family size Ideal family size Ideal family size Ideal family size Ideal family size No covariates Life cycle SES Religiosity Sibship size Migration
(1) (2) (3) (4) (5) (6)
Muslim 0.52*** 0.44*** 0.44*** 0.26*** 0.17** 0.14* (0.04) (0.04) (0.04) (0.05) (0.06) (0.07)
R-squared 0.02 0.10 0.10 0.13 0.13 0.14
Observations 9,139 9,139 9,139 9,139 9,139 9,139
Panel b
Amount of Muslim–non-Muslim difference in ideal family size explained by differences in:
(1) (2) (3) (4) (5) (6) (7) (8) (9)
Mean difference
ideal family size Life cycle SES Religiosity Sibship size Migration Total
explained % Explained Total unexplained
0.52 0.08 0.00 0.18 0.09 0.03 0.38 73.00 0.14
Table A-4: Nested mediation analysis of the association between Muslim and ideal family size among Muslim and Christian women in France, 2008/2009, using linear probability models (Panel a) and Blinder– Oaxaca decomposition of the gap in ideal family size between Muslims and Christian women in France, 2008/2009 (Panel b) (n = 6,416). All estimates are weighted to be nationally representative using survey weights provided by TeO
Panel a Ideal family size Ideal family size Ideal family size Ideal family size Ideal family size Ideal family size No covariates Life cycle SES Religiosity Sibship size Migration
(1) (2) (3) (4) (5) (6)
Muslim 0.53*** 0.45*** 0.47*** 0.33*** 0.25*** 0.23** (0.04) (0.05) (0.05) (0.06) (0.07) (0.08)
R-squared 0.03 0.10 0.11 0.13 0.14 0.14
Observations 6,416 6,416 6,416 6,416 6,416 6,416
Panel b
Amount of Muslim–Christian difference in ideal family size explained by differences in
(1) (2) (3) (4) (5) (6) (7) (8) (9)
Mean difference
ideal family size Life cycle SES Religiosity Sibship size Migration Total
explained % Explained Total unexplained
0.53 0.08 –0.02 0.14 0.08 0.02 0.30 57 0.23
Note: Each cell represents a separate regression model: M1 includes no additional controls; M2 adds controls for life cycle factors; M3 adds controls for socioeconomic factors; M4 adds controls for religiosity; M5 adds controls for sibling size; and M6 adds controls for migration background. Bold numbers indicate statistically significant (p < 0.05) differences between the Muslim coefficient in the indicated model from a preceding model. In Panel b, due to rounding, the values in Columns 2–6 might not add up to Column 7 and the values in Columns 7 and 9 might not add up to Column 1. Robust standard errors in parentheses. *** p<0.001, ** p<0.01, * p<0.05.
Table A-5: Descriptive summary of how Muslim and non-Muslim respondents differ on partnership, health insurance, and contraceptive use outcomes
(1) (2)
Muslim Non-Muslim
weighted weighted
(n = 2,322)a (n = 7,134)b
Currently unpartnered 0.34 0.25
Has health insurance 0.99 0.99
Doctor’s visit last 12 months 0.92 0.96 Current modern contraceptive use 0.44 0.51 Current long-acting, reversible method 0.09 0.13 Ideal children < actual children 0.09 0.06
Note: Health insurance includes la CMU (Couverture maladie universelle); l’aide médicale d’état (AME ou AMER, aide médicale