Prioritization of Management Indexes of Municipal Solid
Waste in Line with Sustainable Development (Case Study:
City of Bokan)
Mohammad Hossein Saraei
Associate Professor, Department of Geography and Urban Planning, University of Yazd, Yazd, Iran
Zahra Jamshidi
Ph.D. student of Geography and Urban Planning, University of Yazd, Yazd, Iran Navid Ahangari*
Ph.D. student of Geography and Urban Planning, Kharazmi University, Tehran, Iran
Received:2013/12/029 Accepted:2015/06/07
Abstract: Non-systematic management of municipal solid waste prepares the ground for the creation of human and environmental problems in long run. Therefore, sustainable and effective municipal waste management strategy is needed to balance the development, quality of life and the environment.This paper has been developed to evaluate the management indicators of municipal solid waste in accordance with sustainable development in Bukan by using TOPIS technique.Research methodology is descriptive, analytical and surveys (questionnaires and field observations). The statistical population was the city’s population of 171,773 people with the sample of 384 people. It was reduced to 330 due to the limitations of the study.Findings show that 150 tons of waste are produced daily on average in the city of Bukan and the waste per capita is 0.740 kg per day. The most amount of produced solid waste is related to organic materials with 75.82 and the least amount is related to wood with 0.65 percent. The final obtained ranking of satisfaction rate of sustainable development indexes of solid waste management (that is between zero and one) has indicated that the factor of tip request was in the first rank and the factor of advertisement attractiveness was in the 20th rank that is the least important one. Thus, data analysis using TOPSIS model, is an effective tool for analyzing problems and it will provide new insights (environmental, economic, social and practical) for sustainable planning of municipal solid waste management system.
Keywords: Municipal solid waste management, sustainable development, TOPSIS technique, city of Bukan
JEL Classification: N95, C63, Q01, M10
*Corresponding Author: [email protected]
The Scientific-Research Quarterly Journalof Urban Economics and Management
ISSN: 2345-2870 Indexed in: ISC, Econbiz,
SID, Noormags, Magiran, Ensani, Civilica, RICeST
www.Iueam.ir Vol. 4, No.14 Spring 2016 Pages: 1-17
1- Introduction
Historically, concern about public health, security, lack of resources and aesthetics, as the main directors of management systems of municipal solid waste (Louis, 2004) to settled communities dates back to 10000 B.C. (Worrell & Vesilind, 2012). Small settled societies of that time buried solid wastes out of their residential environment or in the rivers (Seadon, 2006). This method of disposal did not have many negative impacts on the environment because of low population (Azimi Jibril et al., 2011). However, population increase, advanced economy, rapid urbanization, and increase in life standards accelerated the amount of municipal solid waste in the world (Minghua et al., 2009) causing the solid waste production have more complex entity since industrial wastes added to other ones (Wani & Ahmad, 2013). The rapid and unplanned increase occurred simultaneously with industrial revolution, rapid development of urbanization in the Europe and Northern America (Wilson, 2007) resulted in intense use of urban land, and the emergence of management challenges (Cohen, 2004). Therefore, in past twenty years, policies on municipal solid waste have been changed in response to social and environmental changes (Su et al., 2007); so that UN’s report about solid waste management indicates that currently, more than 1.3 billion tons of solid waste are produced in the world annually. It is anticipated that it will be reached to 2.2 billion tons annually by 2020 (Elwan et al., 2013). Considering these factors, health and environmental sanitation principles require
that waste to be disposed in a manner from human life in the shortest possible time since distribution and disposal of waste are followed by the contamination of water, soil, air and harm to public health (Herva et al., 2014); therefore, solid wastes that are one of the outputs of pollutant the environment in societies, are counted as the third pollutants along with water pollution (first pollution) and air pollution (second pollution( (Ichinose et al., 2013). Thus, urban solid waste management is one of the basic dilemmas facing with environmental protection organization (Ramesh et al., 2013).
Environmentally, primary purposes of solid waste management strategy is caring to health, the environment, land uses, resources, and economic concerns in relation with inappropriate disposal of solid waste (Henry et al., 2006). These issues have created many concerns for municipalities, companies, and responsible organizations across the world (Nemerow, 2009). Therefore, it is necessary to use standards in accordance with modern instructions in municipal solid waste management in order to avoid pollution (Raghimi, 2001). It seems that currently the only solution for developmental problems is to create coordination among legal sectors, particularly in environmental issue. Close cooperation of the government and private sector eases implementation of environmental rules (Loloei, 2001). Regulated different steps of municipal solid waste system management can lead to set the system to achieve a better health, economic and environmental conditions, particularly the issue of
environment that will lead to sustainable development (Poorahmad, 2009).
Municipalities are responsible for waste management in many cities of the world; therefore, necessary measures can be taken in order to increase public satisfaction and saving in municipal costs through organizing the way of collecting waste, educating workers, buying equipment, and determining accurate way of collection (Shanbezadeh and Majlesi, 2012). As a result, collecting, recycling, removing and preventing increase of municipal solid waste are some of the main issues for municipalities in the 21st century (Cherubini et al., 2009). Generally, municipalities, as responsible body for solid waste management in cities, are confronted with a necessity of presenting efficient and useful system for residents’ welfare. Yet, most municipalities are not able to deal with this issue (Sujauddin et al., 2008). Mainly, the basic reason of these problems is lack of particular organization, limited financial resources, complexity, and absence of integrated management system (Burnley, 2007). Regarding these factors and emerged complexity in the manner of unprincipled management of municipal solid waste in municipality of Bukan, many problems have been raised for municipality and made any change in this system impossible. On the other hand, lack of clear definition of each domain’s function and duty and unclear legal positions (governmental and private) leaded to some damages to municipal solid waste management system. Thus, this paper tries to study influential factors on
municipal solid waste management in line with sustainable development by using TOPSIS technique in order to help to decrease environmental and human problems in line with solid waste management in this city to minimize the problems to an acceptable level and prepare the ground for sustainable management of municipal wastes. According to the field studies and statistical calculations based on the distributed questionnaires in three areas of Bukan, it has been tried to answer the following questions:
1. What are the effective factors on solid waste management of Bukan in line with sustainable development?
2. Which factors have the most impact on solid waste management of Bukan in line with sustainable development? 3. At what level are the results of prioritization of influential factors on solid waste management of Bukan by using TOPSIS technique?
4. What are the influential strategies on solid waste management of Bukan in line with sustainable development considering all effective factors?
2- Literature Review
a) Foreign Researches
Pandyaswargo et.al. (2012), in a research entitled “energy recovery potential and life cycle impact assessment of municipal solid waste management technologies in Asian countries using ELP model” -by using the features of municipal wastes of India, Indonesia, and china as case study- indicated that composting of organic waste and sanitary land filling to gain gas and energy
recovery are the best and the most p r a c t i c a l m e a s u r e s t h a t r e d u c e environmentally negative impacts on the environment.
Vego et.al. (2011) in an article entitled “the use of MCDM in municipal solid waste management in city of Dalmatia in Croatia indicated that such approach is an efficient tool for the analysis of problems and provide new insights including environmental, economic, social, and practical ones for planning of municipal solid management system at strategic level.
Ezeah and Roberts (2012) in an a r t i c l e u s i n g M C D M a n d 1 5 5 7 questionnaires in the city of Abuja indicated that it should be taken a constant program of public education for preventing to create waste and recycle it. The best method and strategy for municipal solid waste management is to use successful waste management globally considering local conditions.
Victor and Agamuthu (2013), in their research by using strategic environmental assessment (SEA) for municipal solid waste management in Malaysia indicated that municipal solid wastes in Malaysia will be reached to 1.5 million tons in 2020 from 9 million tons in 2000 and the main problem of this increase is lack of integration of environmental impacts in the process of solid waste management.
B) Iranian Researches
Majlesi et.al. (2010) in an article entitled “the study of solid waste management in hotels in Tehran-district 6 by using sampling, physical analysis and questionnaires indicated that wastes are not separated in 36.3 percent of the hotels
and it is separated in 63.6 percent of them. Only dried bread is separated in most of them. Garbage is collected in a non-mechanized manner in 27.3 percent of hotels. 36.4 percent of them are satisfied with mechanized collection and 34.4 percent of them are highly satisfied.
Shanbezadeh and Majlesi (2012) in an article about environmental health based on standard method and the study of chemical municipal waste leachate indicated that it was 14407663 and 162 kilograms according to the average of total waste and its per capita in that year. There were also different problems in the current management system resulting in accumulation of garbage in the city, leachate leakage and accumulation of stray animals and vermin, increase in related illnesses, and unhealthy space of the city.
Rafiei et.al. (2009) in an article, entitled “environmental assessment of life cycle of waste management system of Holy Mashhad” indicated that composting as one of the management options, also using waste transfer stations has key role in reducing pollutants and energy consumption caused by the waste management system in cases that landfills and other facilities system, including recycling and composting plant, are distant from center points of production.
3- Theoretical Principles
Municipal solid waste refers to wastes from homes, streets, shops, hospitals, institutions and public parks (Fodor & Klemes, 2012) including daily items such as package of products, grass clippings, furniture, clothing, bottles,
food scraps, newspapers, appliances, paint and bottles (Farrell & Jones, 2009), and generally municipalities are responsible for collecting them. Most solid wastes in developing countries include paper waste, kitchen waste, plastics, metals, clothes, and glass (Getahun et al., 2012).
Municipal solid waste management includes many technologies related to control of waste production, loading and storage, transportation, processing and disposal (Tan et al., 2014). Haghi defines municipal solid waste management as many factors that are used for reducing the volume of solid wastes in the space surrounding including reusing and recycling, composting, and reducing the source of wastes at homes and offices (Haghi, 2010). Municipal solid waste management hierarchy has been founded since 1970. In this regard, there are different versions of municipal solid waste management hierarchy, but the most important of them that is economical is related to Feymen et.al. (2002). It is acceptable in line with reducing the amount of waste, reusing, recycling, composting through burning, and finally landfilling in order to achieve sustainable management of wastes that is compatible with the environment , economical, reasonable, and socially acceptable (Tchobanoglous & Kreith, 2002). However, solid waste management in the Europe has been regulated based on EC98/2008 instruction in order to increase recycling, composting, and reusing from the source of waste so that 50 percent of home wastes should be decreased by 2020 (Ragazzi et al., 2012). In this case, Switzerland is a good
instance. In such a way that, it has had very appropriate performance with municipal solid waste management policies, 80 percent of polyethylene terephthalate bottles, 90 percent of aluminum packaging, and 94 percent of bottle glasses were recycled in 2010, and only small amount of non-recyclable materials were buried (Meylan et al., 2013).
One of the most important indexes of municipal solid waste management is integrated management of municipal solid wastes; a technique that allows complex systems and multi-dimensional studies to be in coordination integrally. This model was expanded and developed by advisor engineers of solid wastes in urban environments in the middle of 1980s (Guerrero et al., 2013). According to the definition of international research group in Japan, the purpose of integrated municipal solid waste management is to optimize a system for disposal waste policy by means of integrating social, economic, energy, and environmental policies to maintain full health and protection of the environment (Omrani and Nakhjavani, 2009). In this regard, Santibañez-Aguilar et.al stated that using integrated municipal solid waste management may prepare economic, environmental, and social advantages for urban societies (Santibañez-Aguilar et al., 2013). However, Raad et.al. (2014) stated that using integrated municipal solid waste management leads the entire waste management cycle to be managed and technical solutions for the stream of recycling and composting to be presented environmentally and economic ally
sustainable (Rada et al., 2014). Menikpura et.al (2013) believed that moving toward integrated municipal solid waste management presents a solution for reducing greenhouse gasses and achievement of social, economic, and environmental benefits (Menikpura et al., 2013).
4. Research Method
This research was done in 2013 and the method was survey and data analysis method was descriptive-analytical. All data were collected by field study (physical analysis of waste, interview, and questionnaire). To collect data, researcher-made questionnaire was used i n t h r e e p a r t s o f m e a s u r i n g demographic variables, solid waste management variable, and waste collection management. The questions were designed based on multiple-choice Likert scale. Used variables and indexes in this study were extracted from available sources including Omrani et.al (2009), Abdi (2008), and Saeidniya (2004).
The survey conducted by dividing the city into three areas, and filling 330 questionnaires by number of resident families in Bukan by interviewing in each of cities’ area. 384 people were selected as statistical sample by Cochran method; it was reduced to 330 ones considering limitations in the studied area. To determine reliability, Cronbach’s alpha was used. In this study, Cronbach’s alpha is 0.88. This value indicates the high reliability of questions that measure a person’s satisfaction. Survey data obtained via field observations and questionnaires to conduct TOPSIS model.
TOPSIS is technique sorting the priority of options based on the similarity to ideal solution presented by Chen and Hoang for the first time (Olson, 2004). This functional and useful method is used for ranking and selecting numbers of determined external options through measuring the distance and it helps the decision-maker to organize, analyze, and compare problems, and rank alternative options (Shih et al., 2007). The basic principle of TOPSIS is that the selected option should have the least distance to positive ideal solution and the most distance from negative ideal solution (Jahanshahloo et al., 2009). Methods In this model, is comprised of the following steps:
Step 1; construction of multi-criteria decision matrix: it is based on “n” as alternative, “m” as an index, “aij” represents as an raw score of i-th alternative in j-th criteria as aij (i=1,…,m; j=1,…,n). Then, the decision matrix looks like this:
11 12 1
21 22 2
1 2
( )
n n ij m n
mn m m
a
a
a
a a
a a
A a
a a
Step 2; calculating normalized decision matrix: In order to create different comparable criterions, A decision matrix is needed to be normalized. As a result, normalized decision matrix will be “B=(bij)m×n”. To reduce the computational complexity of TOPSIS, limiting method has been used as follows:
bij (i=1,…,m; j=1,…,n). Then, we will have the following formula:
“i” As a positive criteria “j” as a negative criteria
Step 3; calculating the weight of normalized decision matrix: Determining the weight of each indexes of wj is based on . In this regard, important
indexes have higher weight; therefore, the following matrix is formed:
w b
cij ij j i =1, 2,..., m and j = 1, 2, ..., n.
mn n 2 m 2 1 m 1 n 2 n 22 2 21 1 n 1 n 12 2 11 1 ij b w ... b w b w . ... .. . b w ... b w b w b w ... b w b w C
C=(cij) m×n
Step 4; Determining Positive and Negative Ideal Solutions: Positive and negative Ideal solutions are formed by obtained data of
max1
j ij
i m
c c
,
1 min j ij i mc c
, j=1,…,n,
as follows:
1, 2, , n
0, 0, , 0
V c c c
(V+) is the best amount of i-th criteria among all options and (V-) is the worst one. Options that are placed in (V+) and
(V-), represent quite clearly better and worse options respectively.
Step 5; calculating the size of separation: the distance between ideal points and each alternative is calculated by using a separation size. A separation can be calculated by using Euclidean distance metric. In this step, the distance from positive ideal solution (di) from
negative ideal solution (di) is calculated for each alternative respectively by following equations. Positive ideal solution is one that is the best in every respect, and generally, it does not exist in practice. It has been tried to approach it. The general formula is as follows:
2 2
1 1
( ) ( ) ( 1, , ; 1, , )
n n
i ij j ij j
j j
d c c c w i m j n
2 2
1 1
( ) ( 1, , ; 1, , )
n n
i ij j ij
j j
d c c c i m j n
Step 6; Calculating Relative Proximity to Ideal Point of (Ci
+
): In this step, the similarity index of determining coefficient that is equal with the distance of minimum alternative (di-) is divided into the total minimum alternative distance (di-), and the distance of ideal alternative (di+) represented by (Ci+), the following equation is used:
Alternative ranking is based on the amount of Ci+. This amount is between zero and one 0≤ Ci+≤1. In this regard, Ci+=1 represents the highest rank and Ci+=0 is the lowest one.
Step 7: Ranking Descending Order fromCi
+
: In this step, it is specified that to some extent each area receives score than
1 1 n j j w
1, 2, , n
1, 2, , n
V c c c w w w
max( )
max( ) min( )
min( )
max( ) min( ) ij
ij i
ij i ij i ij i ij ij i i ij ij a a a a a a a a b mn m m n n ij b b b b b b b b b b ... . ... . . ... ... 2 1 2 22 21 1 12 11
( 1,..., )
i i i i i m d C d d
ideal point that is a number between zero and one 0≤ Ci+≤1.
The geographical location of the city of Bukan
The city of Bukan is located linearly along the north-south parallel with Miyandoab-Saghez road with the area of 1846.35 hectares. Based on satellite images of Cosmos, this city is located on the coordinates of 46 11 to 46 13 and 36 31 to 33 36 latitude and the average height of 1340 meters above sea level. This city is neighbor with city of Saghez
(Kurdistan Province) from south and southeast, with the city of Sardasht from the West, with the city of Mahabad from north and North West, and with the city of Miyandoab from northeast, and with the city of Shahindej from east. Being in the main roads of the north and North West of the country and its location among the surroundings cities leaded the city to have a special position and it has been changed into one of the main urban centers of the region (Farajkordeh, 2007).
Map1. (Geographical location of Bukan) Reference: (www.met-ag.ir)
5- Research Findings
The Features of the Studied Sample
In this research, 60 percent of sample was men and 40 percent was women. 80.3 percent of them answered in residential
units, and 19.7 percent of them were apart from residential houses (commercial, industrial centers). The features of respondents are in accordance with table 1.
Table1. The features of studied sample (percent)
Gender Men 60
Women 40
Job
Student 20
Housekeeper 25.5
Employee 8.2
Worker 2.4
Farmer 1.2
Self-employed 38.2
Retired 1.2
Jobless 2.1
Place Residential houses 80.3
Non-residential 19.7
Education
Illiterate 3
Elementary 22.4
Diploma 47.9
A.A. and B.A. 23 M.Sc. and higher 3.6 Reference: (Researcher-made questionnaires)
Findings of Municipal Solid Waste Management
The results of weighing and measuring the density of municipal soliنd waste of Bukan in the summer of 2013 have been studied. On average, 163 tons rubbish is produced daily. The per capita of rubbish to the population (171101 people) was
0.740 kilogram daily (table 2). This figure is higher than the country’s average (800 belongs to chemicals with 75.82 percent and the lowest amount belongs to wood with 0.65 per cent (table 3). The amount of solid waste in Bukan is 22.1 per cent and 12.5 percent of them are recyclable.
Table2. The average of solid waste in the city of Bukan
Summer
The Amount of Production in Day (Tons) The per Capita
of Waste to Kilogram Residential Service Office Educational Health Workshops Commercial
Centers Tons
Winter 852521 82522 8022 8252 128 5122 1200 822 0.63
Spring 852221 1062 8022 8631 128 6522 1200 821 0.67
Summer 823821 8222 8022 152 128 6522 1200 802 0.75
Fall 822851 62222 8022 8122 128 6522 1200 832 0.86
Average 862251 85221 8022 8223 128 6822 1200 806 0.74
Reference: (comprehensive plan of waste management of Bukan, 2013)
Table3. Physical composition of solid waste of Bukan in different seasons
Sampling Season
The Average
of Density Chemicals Paper Plastic Textiles Glass Metal Wood Other
Winter 385.23 73.75 7.58 9.56 3.61 1.40 0.81 0.48 2.82
Spring 364.27 74.90 7.90 9.50 1.68 1.67 1.01 0.87 2.22
Summer 371.95 80.00 0.73 13.20 1.43 1.23 1.30 0.72 2.69
Fall 379.05 74.64 6.30 10.67 3.15 0.48 1.20 0.54 3.02
Average 375.12 75.82 5.63 10.73 2.47 1.20 1.01 0.65 2.69
Reference: (comprehensive plan of waste management of Bukan, 2013)
The results of table 4 show that the amount of wet waste during two days is 40.3 percent less than 2 kilograms, 38.5 percent between 2 to 4 kilograms, 17.7 percent 4 to 6 kilograms, 3 percent between 6 to 8 kilograms, and 0.6 percent more than 8 kilograms. However, the amount
of dry waste during two days is 69.4 percent less than 2 kilograms, 24.2 percent between 2 to 4 kilograms, 4.8 percent between 4 to 6 kilograms, 0.3 percent between 6 to 8 kilograms, and 1.2 percent more than 8 kilograms.
Table4. The amount of wet and dry wastes (kilograms) during two days based on percent
Area Types of Waste Less than 2 2 to 4 4 to 6 6 to 8 More than 8
Area 1 Wet 96.5 2.7 0.9 - -
Dry 75.5 19.1 3.6 0.9 1.8
Area 2 Wet - 33.7 51.8 9.1 1.8
Dry 67.3 62 1.8 - 0.9
Area 3 Wet 24.5 75.5 - - -
Dry 66.4 23.6 9.1 - 0.9
Average of the City Wet 43.3 38.5 17.6 6 0.6
Dry 69.4 42.2 8.4 0.3 1.2
Reference: (Researcher-made questionnaires)
The findings in table 5 indicate that requesting tip from rubbish collectors has the highest average (3.33) and holding educational workshops in the city (2.12) has the least average. However, the
highest standard deviation is related to providing plastic rubbish bag (1.31) and the lowest one is related to proposed timetable for collecting municipal waste (0.984).
Table5. The average of satisfaction from the indexes of sustainable development of municipal solid waste management of Bukan
Standard Deviation Average
Indexes Standard
Deviation Average
Indexes
1.166
2.58 Volume and size of training
0.948 3.32
Systematic collection
1.036
2.12 Holding workshops
0.940 3.33
Proposed timetable
1.057
2.40 Making culture and
improvement 0.970
3.23 Quick passing from homes
1.057
2.36 Quality and attractiveness of
advertising 1.110
3.33 Requesting tip
1.031
2.58 Creating education and
treatment 1.212
2.94 Presence of certain place
1.162
2.36 Legal approach
1.117 3.26
Collection and transfer
1.041
2.37 Using method technique
1.315 2.33
Providing rubbish bag
1.100
2.48 The role of national media
1.044 3.03
Regular performance
1.040
2.50 The role of schools
1.096 2.71
Avoiding tearing plastics
1.040
2.50 Presenting appropriate
solutions 1.138
2.50 Preventing loss of leachate
Reference: (Researchers’ calculations)
Analysis Using TOPSIS Technique
The first step of analyzing TOPSIS technique is constructing MCDM. Data
forming the MCDM were obtained from researcher-made questionnaires presented in table 6.
Table6. Construction of criterions for MCDM
Index Very
Good Good Average Weak Very
Weak Indexes
Very
Good Good Average Weak Very Weak Volume and
Amount of Training
53 61 32 882 23 Systematic
Collection 62 822 861 25 85
Holding
Workshops 0 62 08 855 821
Proposed
Schedule 62 82 865 22 86
Creating Culture
and Improvement 86 62 32 881 12 Quick Passing 86 36 860 20 85
Quality and Attractiveness of Advertisements
88 60 38 51 11 Requesting Tip 22 821 30 20 52
Education and
Dealing with 88 21 881 822 22
Presence of
Certain Place 62 15 32 18 23
Legal Deal 52 61 12 888 11 Collection and
Transfer 22 825 826 20 52
Using
Technique-Method 3 60 828 821 11
Providing
Rubbish Bags 68 63 22 32 880
The Role of
National Media 82 22 32 821 03
Regular
Performance 81 32 860 22 61
The role of
Schools 58 05 881 32 63
Avoiding
Tearing Plastics 83 20 881 11 28
Presenting Appropriate
Solutions
85 61 883 31 22 Preventing Loss
of Leachate 86 22 32 13 11
Reference: (Researchers’ questionnaires)
The second step is analyzing normalized MCDM TOPSIS. In this step, all indexes
are presented along with different levels un-scaled (table 7).
Table7. Calculating normalized MCDM matrix
Index Very good Good Average Weak Very weak Volume and Amount of Training 0.2614 0.1325 0.1903 0.2956 0.2102
Holding Workshops 0.0541 0.1158 0.1290 0.3164 0.3813
Creating Culture and Improvement 0.1172 0.120 0.2099 0.3034 0.2494
Quality and Attractiveness of Advertisement 0.0991 0.1255 0.1924 0.0700 0.2744
Educating and Dealing with 0.0991 0.1673 0.2474 0.2593 0.1924
Legal Deal 0.1803 0.1290 0.1586 0.2879 0.3100
Using Method-Technique 0.0811 0.1255 0.2136 0.2775 0.2744
The Role of National Media 0.1352 0.1534 0.2009 0.2775 0.2459
The Role of Schools 0.1893 0.2161 0.2495 0.2334 0.1390
Presenting Appropriate Solutions 0.1082 0.1290 0.2517 0.2541 0.1924
Systematic Collection 0.3065 0.3626 0.2919 0.1089 0.0427
Proposed Schedule 0.2705 0.0523 0.2792 0.1037 0.0463
Quick Passing 0.1172 0.3242 0.2876 0.1452 0.0427
Requesting Tip 0.4508 0.3766 0.2030 0.1452 0.0712
Certain Place 0.3065 0.2859 0.1988 0.1841 0.1746
Collection and Transfer 0.4057 0.3556 0.2178 0.1452 0.0855
Providing Rubbish Bag 0.2795 0.1359 0.1142 0.2334 0.4134
Regular Performance 0.1623 0.3277 0.2876 0.1167 0.1318
Avoiding Tearing Plastics 0.1713 0.1952 0.2474 0.2256 0.1817
Preventing Loss Of Leachate 0.1172 0.1917 0.2009 0.2308 0.2780 Reference: (Researchers’ calculations)
The third step calculates the weight of normalized MCDM. In this step, the highest score belongs to the index of very
good with 0.3 of total scores and the least score belongs to the very weak index with 0.1 score (table 8).
Table 8. Calculating the weight of normalized MCDM
Weights of (Wj)
Weight
Very good Good Average Weak Very weak
0.3 0.25 0.2 0.15 0.1
Reference: (Researchers’ calculations)
The fourth step of analyzing TOPSIS determines positive and negative ideal solutions. Table 9 shows the best and
worst alternatives of determining the indexes of sustainable development of municipal solid management of Bukan.
Table9. Determining positive and negative ideal solutions
max
Very Good Good Average Weak Very Weak
0.1352 0.0941 0.0583 0.0474 0.0413
min
Very good Good Average Weak Very weak
0.0162 0.0130 0.0228 0.0105 0.0042
Reference: (Researchers’ calculations)
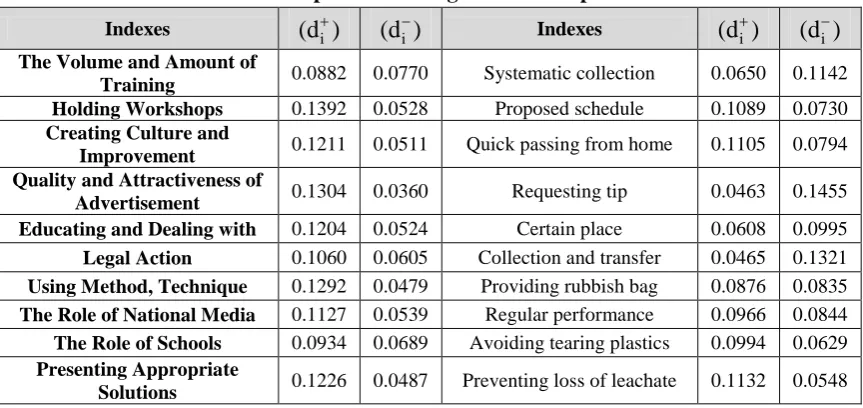
In the fifth step, the distance of each criterion from positive ideal was calculated. As it can be seen in table10, requesting tip and reward has the least distance from positive ideal, and holding educational workshops has the most distance from it.
However, the criterion of requesting tip has the most distance from negative ideal, and the quality and attractiveness of advertisement has the least distance from negative ideal (table10).
Table10. Step5: Calculating the size of separation
Indexes (di) (di) Indexes (di) (di) The Volume and Amount of
Training 0.0882 0.0770 Systematic collection 0.0650 0.1142 Holding Workshops 0.1392 0.0528 Proposed schedule 0.1089 0.0730
Creating Culture and
Improvement 0.1211 0.0511 Quick passing from home 0.1105 0.0794 Quality and Attractiveness of
Advertisement 0.1304 0.0360 Requesting tip 0.0463 0.1455 Educating and Dealing with 0.1204 0.0524 Certain place 0.0608 0.0995
Legal Action 0.1060 0.0605 Collection and transfer 0.0465 0.1321
Using Method, Technique 0.1292 0.0479 Providing rubbish bag 0.0876 0.0835
The Role of National Media 0.1127 0.0539 Regular performance 0.0966 0.0844
The Role of Schools 0.0934 0.0689 Avoiding tearing plastics 0.0994 0.0629
Presenting Appropriate
Solutions 0.1226 0.0487 Preventing loss of leachate 0.1132 0.0548
Reference: (Researchers’ calculations)
Obtained results of calculating the sixth step (relative proximity to ideal point of (Ci+), and finally, the seventh step (ranking in descending order) show assessment of satisfaction rate of sustainable development indexes of municipal solid waste management of Bukan. Requesting tip and reward, and
collection and transfer of all wastes were placed in the first and second ranks respectively. However, the indxes of using method and technique in collecting, and quality and attractiveness of advertisement were ranked 19th and 20th as the least important elements among other indexes (table11).
Table11. Calculating relative proximity to ideal point of and ranking in descending order of
Indexes Ranking Indexes Ranking
Requesting reward 0.7585 8 Avoiding tearing plastics 0.3876 88
Collection and
transfer 0.7395 5 Legal deal 0.3633 85 Systematic collection 0.6372 6 Preventing loss of leachate 0.3263 86
Certain place 0.6207 2 The role of national media 0.3236 82
Providing rubbish bag 0.4881 2 Educating and dealing with 0.3033 82
Regular performance 0.4663 0 Creating culture and
improvement 0.2969 80
The volume and
amount of training 0.4660 1
Presenting appropriate
solutions 0.2843 81
The role of schools 0.4248 1 Holding workshops 0.2751 81
Quick passing from
homes 0.4181 3 Using method, technique 0.2706 83 Proposed schedule 0.4011 82 Quality and attractiveness of
advertisement 0.2164 52 Reference: (Researchers’ calculations)
6- Conclusion and Suggestion The results of data analysis by using TOPSIS model indicate that in calculating the weight of normalized matrix, the most score is belonged to the index of very good with 0.3 and the least one belonged to the index of very weak with 0.1 score (total score is one). Calculating the distance from positive ideal and distance from negative ideal solution, it was specified that requesting tip and reward has the least distance from positive ideal and holding educational workshops has the most distance from positive ideal. However, considering distance from negative ideal, the criterion of requesting tip has the most distance, and quality and
attractiveness of advertisement has the least distance from negative ideal. Final ranking of satisfaction rate evaluation of sustainable development of municipal solid waste management of Bunak is between zero and one indicating that the element of requesting tip and reward placed in the first rank, collecting, and transferring all wastes were in the second rank. However, indexes of using method and technique in collecting, and quality and attractiveness of advertisement were in the 19th and 20th ranks respectively as the least important elements among others. These results are in coordinated with the results of Antonopoulos et.al. (2014). Using fuzzy decision-making technique,
i
C Ci
i
C Ci
they indicated that burning wastes has been specified as the worst ideal solution in the last rank, and recycling was the best ideal solution in the first rank among components of municipal solid waste management. At the end, considering the results of this research and the studies of Vigo et.al (2008), it can be said that data analysis by using fuzzy decision-making technique model has been an efficient tool to analyze problems and it provides new insights, including environmental, economic, social, and practical ones, for planning of municipal solid waste management at the strategic level. These results are coordinated with Cheng et.al. (2014) indicated that using multi-criteria method for optimized selection of landfill site can reduce the cost of waste management system so that it allows decision-makers to select their priorities in the process of decision-making in order to overcome weaknesses systematically; therefore, following issues are suggested:
-Cooperation and coordination among municipalities of provinces, especially surrounding cities, for construction and operation of recycling industries jointly
- Encouraging citizens to separate from destination of recyclable material through implementing encouraging programs of NGO and increasing awareness and attracting environmental cooperation for promoting goals and programs of solid waste management
-Current places of municipal solid waste disposal are in very inappropriate places; therefore, doing environmental studies is necessary for finding new
places for landfilling municipal solid waste
-In the current system of municipal solid waste management, there is a shortage of machinery and equipment; therefore new technology is required, and new design in this system is necessary as well.
-Authorities’ awareness and information of Bukan should be improved through holding technically educational curses of collecting and transferring wastes for municipalities’ personnel.
7- References
Abdoli, M.A. (2008). Recycling municipal solid waste management (reduction, reuse, and recycle), 3rd edition, Tehran: University of Tehran Publications, 364. Antonopoulos, I. S., Perkoulidis, G., Logothetis,
D., K arkanias, C. (2014). Ranki n g municipal solid waste treatment alternatives considering sustainability criteria using the analytical hierarchical process tool.
Resources, Conservation and Recycling,
86, 149-159.
azimi Jibril, J. D., Sipan, I. B., Sapri, M., Shika, S. A., Isa, M., Abdullah, S. (2012). 3R s Critical Success Factor in Solid Waste Management System for Higher Educational Institutions. Procedia-Social and Behavioral Sciences, 65, 626-631.
Burnley, S. J. (2007). A review of municipal solid waste composition in the United Kingdom. Waste Management, 27(10), 1274-1285.
Cheng, S., Chan, C. W., Huang, G. H. (2003). An integrated multi-criteria decision analysis and inexact mixed integer linear programming approach for solid waste management. Engineering Applications of Artificial Intelligence, 16(5), 543-554. Cherubini, F., Bargigli, S., Ulgiati, S. (2009). Life cycle assessment (LCA) of waste
management strategies: Landfilling, sorting plant and incineration. Energy, 34(12), 2116-2123.
Cohen, B. (2004). Urban growth in developing countries: a review of current trends and a caution regarding existing forecasts.
World development, 32(1), 23-51. Comprehensive plan of waste management of
Bukan. (2013). Advisor engineers of Pangan Avaran, Municipality of Bukan. Elwan, A., Arief, Y. Z., Adzis, Z., Saad, M.
H. I. (2013). The viability of generating electricity by harnessing household garbage solid waste using life cycle assessment. Procedia Technology, 11, 134-140.
Ezeah, C., Roberts, C. L. (2012). Analysis of barriers and success factors affecting the adoption of sustainable management of municipal solid waste in Nigeria. Journal of environmental management, 103, 9-14. Farajkordeh, Kh. (2007). Effective factors
and variables on determining central parts of middle cities (case study: City of Bukan), M.Sc. thesis of geography and urban planning, University of Tarbiyat Modarres, Tehran.
Farrell, M., Jones, D.L. (2009). Critical evaluation of municipal solid waste composting and potential compost markets. Bioresource technology, 100(19), 4301-4310.
Fodor, Z., Klemeš, J. J. (2012). Waste as alternative fuel–Minimising emissions and effluents by advanced design.
Process safety and environmental protection, 90(3), 263-284.
Getahun, T., Mengistie, E., Haddis, A., Wasie, F., Alemayehu, E., Dadi, D., ... & Van der Bruggen, B. (2012). Municipal solid waste generation in growing urban areas in Africa: current practices and relation to socioeconomic factors in Jimma, Ethiopia. Environmental monitoring and assessment, 184(10), 6337-6345.
Guerrero, L. A., Maas, G., Hogland, W. (2013). Solid waste management challenges for cities in developing countries. Waste management, 33(1), 220-232.
Haghi, A. K. (2010). Waste Management: Research Advances to Convert Waste to Wealth. Nova Science Publishers, Inc. Henry, R. K., Yongsheng, Z., Jun, D. (2006).
Municipal solid waste management challenges in developing countries–Kenyan case study. Waste management, 26(1), 92-100.
Herva, M., Net o, B., Roca, E. ( 2014). Environmental assessment of the integrated municipal solid waste management system in Porto (Portugal).
Journal of Cleaner Production, 70, 183-193.
Ichinose, D., Yamamoto, M., Yoshida, Y. (2013). Productive efficiency of public and private solid waste logistics and its implications for waste management policy. IATSS Research, 36(2), 98-105. Jahanshahloo, G. R., Lotfi, F. H., Davoodi,
A. R. (2009). Extension of TOPSIS for decision-making problems with interval data: Interval efficiency. Mathematical and Computer Modelling, 49(5), 1137-1142.
Loloei, K. (2001). The study of environment factor in development, articles of the first conference on development and promotion of standard, industrial training and research center of Iran publications, Tehran, 386.
Louis, G. E. (2004). A historical context of municipal solid waste management in the United States. Waste management & research, 22(4), 306-322.
Majlesi, M; Omrani, Gh, Elahi, P. (2010). The study of solid waste management of hotels in municipality district 6 of Tehran, The Quarterly Journal of Sciences and Environment Technology, 12 (1), 89-96.
Menikpura, S. N. M., Sang-Arun, J., Bengtsson, M. (2013). Integrated sol i d wast e management : an approach for enhancing climate co-benefits through resource recovery. Journal of Cleaner Production, 58, 34-42.
Meylan, G., Seidl, R., Spoerri, A. (2013). Transitions of municipal solid waste management. Part I: Scenarios of Swiss waste glass-packaging disposal. Resources, Conservation and Recycling, 74, 8-19. Minghua, Z., Xiumin, F., Rovetta, A.,
Qichang, H., Vicentini, F., Bingkai, L., ... & Yi, L. (2009). Municipal solid waste management in Pudong New Area, China. Waste management, 29(3), 1227-1233.
Nemerow, N. L. (2009). Environmental engineering: environmental health and safety for municipal infrastructure, land use and planning, and industry (Vol. 3). John Wiley & Sons.
Olson, D. L. (2004). Comparison of weights in TOPSIS models. Mathematical and Computer Modelling, 40(7), 721-727. Omrani, Gh; Alavi Nakhjavani, N. (2009).
Solid Wastes (recycling), Vol.2, 1st edi t i on, T ehran: Andi she Raf i Publications.
Pandyaswargo, A. H., Onoda, H., Nagata, K. (2012). Energy recovery potential and life cycle impact assessment of municipal solid waste management technologies in Asian countries using ELP model. International Journal of Energy and Environmental Engineering,
3(1), 1-11.
Poorahmad, A. (2009). Territory and phi l osophy of geography, T ehr an: University of Tehran publications. Rada, E. C., Ragazzi, M., Ionescu, G.,
Merler, G., Moedinger, F., Raboni, M., Torretta, V. (2014). Municipal Solid Waste treatment by integrated solutions: Energy and environmental balances.
Energy Procedia, 50, 1037-1044.
Rafiei, R; Salman Mahini, A; Khorasani, N. (2009). Environmental assessment of life cycle of municipal solid w aste management (case study: Mashhad),
Quart erl y Journal of agri cul t ural sciences and natural resources, Vol.16, special issue 2, 208-220.
Ragazzi, M., Girelli, E., Rada, E. C. (2012). MSW selective collection in a tourist area: an Italian case-study. Proceedings SIDISA2012, Milan, June, 26-29.
Raghi mi , M. (2001) . T he need f or standardization of municipal solid waste management system, articles of the first confer ence on devel opment and promot i on of st andard, T ehran: industrial training and research center of Iran publications.
Saeidniya, A. (2004). Municipal solid waste, Green book of municipalities, Vol.7, 1st edition, Tehran: Organization of Municipalities and RMs of Iran publications.
Sahoo, R. C., Sahoo, D., Sahoo, J., Pradhan, S. C. (2013). Trends And Problems Of Municipal Solid Waste Management In The District Of Balasore, Odisha And Prospects For A Sustainable Development.
International Journal of Innovative Research and Development, 2(5). Santibañez-Aguilar, J. E., Ponce-Ortega, J. M.,
González-Campos, J. B., Serna-González, M., El-Halwagi, M. M. (2013). Optimal planning for the sustainable utilization of municipal solid waste. Waste management,
33(12), 2607-2622.
Seadon, J. K. (2006). Integrated waste management–Looking beyond the solid waste horizon. Waste management,
26(12), 1327-1336.
Shanbehzadeh, S; Majlesi, M. (2012). The st udy of muni ci pal sol i d wast e management condi t i on i n Masj i d Soleyman considering the health of the
environment, Journal of Health System Research, 8 (3), 397-406.
Shih, H. S., Shyur, H. J., Lee, E. S. (2007). An extension of TOPSIS for group decision making. Mathematical and Computer Modelling, 45(7), 801-813. Su, J. P., Chiueh, P. T., Hung, M. L., & Ma,
H. W. (2007). Analyzing policy impact potential for municipal solid waste management decision-making: A case study of Taiwan. Resources, Conservation and Recycling, 51(2), 418-434.
Sujauddin, M., Huda, S. M. S., Hoque, A. R. (2008). Household solid waste characteristics and management in Chittagong, Bangladesh. Waste Management, 28(9), 1688-1695.
Tan, S. T., Lee, C. T., Hashim, H., Ho, W. S., Lim, J. S. (2014). Optimal process network for municipal solid waste management in Iskandar Malaysia.
Journal of Cleaner Production, 71, 48-58.
Tchobanoglous, G., Kreith, F., (2002).
Handbook of Solid Waste Management, second ed. McGraw-Hill, New York, USA.
Vego, G., Kučar-Dragičević, S., Koprivanac, N. (2008). Application of multi-criteria decision-making on strategic municipal solid waste management in Dalmatia, Croatia. Waste management, 28(11), 2192-2201.
Victor, D., Agamuthu, P. (2013). Strategic envi r on ment al assessment pol i cy integration model for solid waste management in Malaysia. Environmental Science & Policy, 33, 233-245.
Wani, M., Ahmad, S. (2013). Challenges, issues of solid waste management in Himalayas: a case study of Srinagar City. Afr J Basic Appl Sci, 5(1), 25-29. Wilson, D. C. (2007). Development drivers
for wast e mana ge m ent . Wast e
Management & Research, 25(3), 198-207.
Worrell, W., Vesilind, P. (2011). Solid Waste Engineering, SI Version. Cengage Learning.