ISSN: 2334-2986 (Print), 2334-2994 (Online) Copyright © The Author(s). All Rights Reserved. Published by American Research Institute for Policy Development DOI: 10.15640/jea.v5n1a1 URL: https://doi.org/10.15640/jea.v5n1a1
Investigation of Thermal Environments in Humid Tropical Classroom in Indonesia
Jefrey I. Kindangen1
Abstract
Thermal comfort is one of the influencing factors in increasing concentration in teaching and learning process. This study has assessed the comfort level and differences in thermal sensations and preferences between male and female college students in a classroom in the humid tropical climate of Indonesia. The classroom was designed to operate to the extent possible using natural ventilation and daylight as passive techniques. The study was conducted by distributing questionnaires for 182 students to ascertain the thermal perceptions and preferences at different times and under varying conditions (including whether a ceiling fan was used) and by measuring air temperature, relative humidity and wind velocity in the classroom. The results suggest that noon and afternoon are both critical times that tend to have lower thermal comfort levels. At these times when a fan was not used, there were over 70% of students expressed discomfort; more males reported feeling uncomfortable than females. However, at noon with quite a high temperature, the effects of using ceiling fan are not able to increase significantly level of thermal comfort, but in the afternoon the use of the fan was instrumental in increasing the percentage of people feel comfortable. The PMV and PPD indices have been compared to the results of students’ thermal perception analysis and noted that these indices are very sensitive to airflow parameter.
Keywords: thermal comfort; classroom; airflow velocity; ceiling fan; humid tropical climate; gender
1.Introduction
The productivity is commonly defined as the resultant of the individual intrinsic abilities and the external conditions. It is known that the productivity can achieve the expected level if the living conditions meet the minimum standards such as for continuing the work efficiently and comfortably, as reported in the European Project ThermCo (2009). External conditions, including thermal comfort conditions, which correspond to air temperature, air movement, humidity and body heat radiation (affected by metabolic rate and clothing), combine with contributing factors such as acclimatization, food and drink, body shape, subcutaneous fat, age and gender, and the state of one’s health (Auliciems et. al., 2007). The classroom is an important facility in the learning process. Thermal comfort in the classroom should improve the learning process and student performance. An uncomfortable classroom, especially a hot one, can cause students to swelter, resulting in reduced concentration and disruptions in learning.
1Architectural Engineering Department, Sam Ratulangi University, Jl. Kampus Unsrat Manado 95115 Indonesia,
Humid tropical climates with high average annual temperatures and relative humidity can induce sweltering and sweating. Givoni (1978) stated that there is a very close relationship between humans and climate and vice versa; even Olgyay (1976) stated that the typical climate determine largely the existing architecture in the area of climate. This adaptation process is essential to achieve a balance and to mankind itself with its environment to achieve comfort or neutral conditions. According to ISO 7730 (1985) that thermal comfort is a condition of mind which expresses satisfaction with the thermal environment. Thermal comfort is maintained only when the heat produced by the body’s metabolism is equal to the heat lost from the body and signals from the body’s heat and cold sensors are neutral. Furthermore, in order to simplify the definition, it is stated that thermal environment not only temperature as the only main parameters, but the role of other parameters is crucial. The human body has an automatic mechanism when confronted with the environment. In a cold environment will occur heating mechanisms: reduction of blood flow and shivering. While, in a hot environment will occur cooling mechanism by increasing blood flow and sweating (evaporation).
A classroom in the Faculty of Engineering at the University of Sam Ratulangi (USR) was originally designed to use natural ventilation and natural lighting, but whether this classroom meets standard thermal comfort levels has never been examined. The room was designed to provide comfort to its students with cross ventilation, intended to provide airflow with adequate distribution, evacuating the old, dirty air with new, fresh air. Nevertheless, it is necessary to ascertain whether the level of intended thermal comfort has been achieved.
Fanger (1970) observed that some experiments showed no substantial difference in comfort conditions between males and females, either among college-age persons or among elderly persons. In those instances, if any differences do exist, they are small and of no engineering significance. However, this research has been limited by age group and nationality (Danish and American). Nicol et al. (2012) stated that Andamon et al. found that in the warm climates of Southeast Asia, the preferred conditions correspond to 'cool', rather than ‘neutral', on the ASHRAE scale. Therefore, we must be careful with the meaning of thermal preferences of respondents.
Other studies have been conducted on thermal comfort by Mochida et. al. (2005), who found that comfortable conditions can be obtained by increasing the flow of air in the chamber. Additionally, the work led to the use of air flow and distribution, which can increase thermal comfort (Kindangen, 1997, 2006). Mochida et. al. (1994) examined characteristics of humidity and comfort for the average dressed person with a constant skin temperature. They found that there was a substantial relationship between skin temperature and discomfort. Clement-Croome (1997) carried on research on the indoor environment to define design criteria. The guarantee of thermal comfort in office buildings that are climate-controlled (air-conditioned) has been investigated by Kajtar et. al. (2000), who found that thermal comfort can only be achieved for expected conditions if in accordance with design criteria. While reports about thermal comfort in academic buildings have been written by various researchers (Auliciems (1972), Wong et. al. (2003), Zang et al. (2007)) found that in general, appropriate treatments will define comfort conditions for occupants in the classroom.
2. Methods
1. Figure 1. Map of Indonesia, where the research was conducted.
Figure 2. Climatic data for Manado
We have compared the results of respondents’ thermal perception with the calculation of the PMV and PPD indices. The comparison is used to draw conclusions the sensitivity of climatic parameter for the calculation of thermal comfort.The research was conducted from the end of April to early July in a classroom at the University of Sam Ratulangi in Manado, located in the North block and on the second floor. The classroom was originally designed to use natural ventilation and lighting. In general, students respond that the classrooms on the second floor are hotter than those on the first floor or basement, due to contact with the ceiling and the roof. This condition is understandable because the heat emitted from the roof flows in the space between the ceiling and roof covering the classroom. This type of the roof is called a hot-roof, and its construction consists of corrugated zinc-aluminium sheets, ceiling hanger frames that are close to each other (approximately 50 cm distance) and ceiling triplex sheets. The ceiling is made of unpainted wood triplex, and geometrically follows the roof slope from left to right. On the right and the left sides are windows that can be opened to accommodate cross-ventilation and to obtain natural light, as in Figure 3.
Figure 3. Classroom building (a), the atmosphere of classrooms in which research was conducted (b).
(a)
(b)
3. Results and Discussion
3.1. The Preferable time and usage of ceiling fan
Indoor wind speeds (v) measured at 0.04 m/s; students felt comfortable and not too hot, even without the ceiling fan. Of all respondents, 56% felt comfortable with the existing conditions, 24% felt slightly warm, 16% felt slightly cool and 4% felt cold. The preferences of total respondents in the initial climatic conditions are measured at 76% who would prefer to be a little cooler, 20% who were satisfied with the initial conditions and 4% who preferred to be a little warmer. To gain more information on the quality of the indoor thermal environment, we asked respondents whether they were sweating. The results showed that only 12% respondents were sweating, indicating that the room was not too hot. At the end of the questionnaire, we asked the respondents to indicate whether they felt comfortable. As predicted, the responses indicated that 60% of the respondents felt comfortable and 40% of the respondents did not feel comfortable.If compared to the PMV and PPD indices that incorporated in ISO 7730, we noted that the PMV is equal to 0.7 indicated a state of neutral to slightly warm. PPD value that describes the percentage of people who do not satisfy with their thermal environment showed just 12%. The PPD index is much lower than the results of the field measurement, where the measurements noted that on average, respondents felt uncomfortable was 40%, as described in Table 1.
Table 1. Thermal environment in the morning no fan.
Time: 07:00 – 12:00
Climatic’s condition:
T int 26.3° C
RH 84.6 %
v 0.04 m/s
Thermal sensation (%):
Cold 4
Slightly cool 16 Comfortable/neutral 56 Slightly warm 24
Warm 0
Thermal preference (%):
More hotter 0
More slightly warmer 4
No change 20
More slightly cooler 60
More cooler 16
Sweating or not (%):
Sweating 12
Not sweating 88
Comfortable or no (%):
Comfortable 60
No comfortable 40
PMV and PPD:
PMV 0.7
PPD 12 %
Therefore, there were 73% who felt uncomfortable under these conditions, in the state of slightly warm, slightly cool and even warm. There were striking differences between the sensation of slightly warm and the sensation of warm.The desire to improve climatic conditions is evidenced by 53% who wanted to be cooler, 25% who wanted a little cooler and 20% who did not desire changing the climate conditions. The automatic response of the human body is to sweat if in a hot environment. Sweating is a physiological cooling mechanism; therefore, it can be assumed that most respondents would sweat in the existing thermal environment. During the 12 to 2 p.m. hour, the study recorded that 64% of all respondents were sweating while the remaining 36% were not sweating. To confirm or evaluate the suitability of the classroom environment, the students responded to the question of whether they were comfortable. As expected, 74% of the respondents said it was not comfortable while the remaining 26% expressed that it was comfortable.The temperature and humidity levels during the noon hour (12:00 to 2:00 p.m.) were slightly lower with the use of the ceiling fan running at a speed of 1.5 m/s. The interior temperature decreased to 27.9ºC with a relative humidity of 70.8%.With the ceiling fan running, 25% of respondents felt slightly cool, 24% felt neutral/comfortable and 34% felt slightly warm.
Table 2. Thermal environment at the midday of a room with running ceiling fan and not.
Time: 12:00 – 14:00
Withouta ceiling fan
With a ceiling fan
Climatic’s condition:
T int 28.2° C 27.9° C
RH 72.3 % 70.8 %
v 0.04 m/s 1.50 m/s
Thermal sensation (%):
Cold 0 10
Slightly cool 5 25
Comfortable/neutral 22 24
Slightly warm
38 34
Warm 35 7
Thermal preference (%):
More hotter 0 0
More slightly warmer 2 14
No change 20 31
More slightly cooler 25 31
More cooler 53 24
Sweating or not (%):
Sweating 64 24
Not sweating
36 76
Comfortable or no (%):
Comfortable 26 41
No comfortable 74 59
PMV and PPD:
PMV 2 0.6
PPD 76 % 14 %
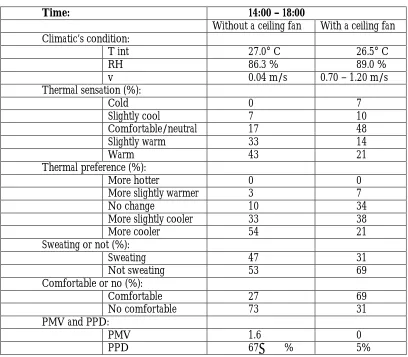
The indoor climatic condition in the afternoon with the fan running was recorded at 26.5ºC air temperature, 89% relative humidity and 0.7 to 1.2 m/s airflow velocity. These conditions caused 48% of all respondents to feel comfortable, 14% feel slightly warm and 21% feel warm, 10% feel slightly warm and 7% feel cold. If compared with the conditions without the ceiling fan it could be concluded that people who felt comfortable enhanced as much 31%, and those who felt slightly warm and warm respectively reduced approximately 19% and 22%.The percentage of all respondents who wanted to modify the conditions to be a little cooler was 38%, unchanged 34% and to be cooler 21%. It is noted that in this condition, only 31% of respondents reported sweating compared to 69% who did not sweat; 69% of respondents said they were comfortable while the remaining 31% expressed feeling uncomfortable.
The results of the PMV and PPD indices in the afternoon without running fan was obtained PMV = 1.6 indicating the condition rather warm and PPD = 67%. When compared with the measurement results it can be concluded that the calculation is lower than the measurements, which were recorded 73% of respondents in the uncomfortable condition. However, the results of the calculations for the afternoon with the running fan recorded PMV = 0 and PPD = 5%, which indicates all the occupants in comfortable circumstances. This result is very different than the measurement, we note that there are 31% of respondents feel uncomfortable. Once again, it was concluded that the PMV and PPD indices are quite sensitive to changes in airflow velocity parameters.
Table 3. Thermal environment in the afternoon for a room with running ceiling fan and not.
Time: 14:00 – 18:00
Without a ceiling fan With a ceiling fan Climatic’s condition:
T int 27.0° C 26.5° C
RH 86.3 % 89.0 %
v 0.04 m/s 0.70 – 1.20 m/s
Thermal sensation (%):
Cold 0 7
Slightly cool 7 10
Comfortable/neutral 17 48
Slightly warm 33 14
Warm 43 21
Thermal preference (%):
More hotter 0 0
More slightly warmer 3 7
No change 10 34
More slightly cooler 33 38
More cooler 54 21
Sweating or not (%):
Sweating 47 31
Not sweating 53 69
Comfortable or no (%):
Comfortable 27 69
No comfortable 73 31
PMV and PPD:
PMV 1.6 0
3.2. Role of Air Velocity to Increase Thermal Comfort
The decreasing of temperature is only able to change the impression of respondents facing a hotter temperature condition. This situation can be explained by considering the percentage of student’s preferences to the climatic conditions of the classroom. The desire not changed and to be little cooler becomes greater when running of fan than not using of fan, but the desire to be cooler will be smaller when running ceiling fan. As a function of convection, then by using ceiling fan may decrease the percentage of respondents who sweat. If we pay attention more detail, especially in the afternoon, the using of the fan will only add one respondent who felt more comfortable / neutral than when not using one. This means that the using of the ceiling fan at a relatively high temperature conditions do not significantly alter the response to the conditions of comfort of students in the classroom. The number of students who feel slightly warm only slightly reduced when using a ceiling fan, while the number who felt warm is significantly reduced when using a ceiling fan. Conversely, the number of respondents who felt slightly cool and cold, significantly increase when using a ceiling fan. Impression of slightly warm of the respondents almost does not differ much happened during the noon without the fan, and in the afternoon without it. Impression of warm does not occur in the morning, mostly in the afternoon without running ceiling fan, which was followed by the noon without fan, as in Figure 4.
Figure4.Students’ thermal sensations.
Figure 5. Respondents’ thermal preferences.
In accordance with earlier predictions and also in line with existing conditions, where in a warmer environment will trigger a growing number of people who sweat, then the percentage of sweating was dominated during the noon without running fan and the afternoon without fan, as in Figure 6. In contrast the percentage of respondents who do not sweat dominated the morning, and then consecutive at noon with the ceiling fan and the afternoon with ceiling fan.
Figure 6. Sweating and no sweating
In other words, during the noon either with a running ceiling fan or without using it and in the afternoon without the fan there are over 50% of respondents feel uncomfortable, as described in Figure 7.
Figure7.Feel comfortable or not
It can be concluded that in the classroom despite using ceiling fan still have not managed to achieve comfortable conditions at noon, and the usage of ceiling fan would be more beneficial in the afternoon. Thus, to create comfortable conditions that can benefit students for every hour is recommended to use air conditioners and used efficiently, especially at the noon that assisted with the use of a ceiling fan.
3.3. Gender Differences in Thermal Comfort
To assess the thermal comfort of gender then used the results of measurements and data collection during the day: the hours of 12:00 - 14:00. There were striking differences between the sensation of slightly warm and the sensation of warm; more females felt warm (25% compared with only 10% of males); and more males felt slightly warm (22.5% compared with only 15% of females), as depicted in Figure 8(a). There were no significant differences between females and males in comfort and slightly cool sensations.The preference to be cooler did not differ significantly between females and males. Nevertheless, there were striking differences found between male and female respondents in the preference to remain unchanged or neutral and in the desire to become a little cooler. Where 12.5% of male respondents wanted no change from the initial conditions compared to 7.5% of females, 15% of female respondents wanted a little cool compared to only 10% of males, as shown in Figure 8(b).
(a)
(b)
The respondent's perception of air movement can increase their thermal sensation. The acceptability and preferences reported indicate that females have more sensitivity to the influence of air flow than do males. In the slightly warm category of perception, the percentage of males remained close to the same (18%), compared with a greater decrease for females. The cool sensation was only experienced by female respondents (14%), as shown in Figure 9(a). There is no striking contradiction between the first results and the results of the preference. The preference for a little cool is greater for male respondents, 14% in all; in contrast, 14% of female respondents want to be a little warm, as in Figure 9 (b). It can be concluded that more female respondents feel the immediate benefit with the use of the fan than males.
Figure 9. Thermal perceptions (a) and preferences (b) between males and females at noon with running ceiling fan
(b)
Statistical analysis using a cross tabulation aims to provide a basic picture of the interrelation between gender and the thermal sensation and preference. The test results indicate that the thermal sensations and preferences for the midday in classrooms that either use a fan or do not use is not significant association. The p-value for thermal sensation on the midday without using a ceiling fan is 0.404915 and for thermal preferences amounted 0.441773; while the p-value for thermal sensation at noon using a ceiling fan is 0.174094 and for thermal preferences is 0.479552. In other words, thermal sensation and preferences is not significantly dependent with the gender: between women and men.
4. Conclusions
This paper reflects the results of a study of thermal sensation and preference in the tropical humid classroom, conducted at the University of Sam Ratulangi in Manado, Indonesia. Observing the different responses to the classroom climate with and without the use of a ceiling fan, particularly during the critical noon and afternoon time intervals have provided clarity on the role of air flow in thermal comfort. The morning condition gave the impression of comfort even without using the fan. It was found noon and the afternoon were both critical times, which tended to lower the comfort level. In such conditions, the number of males who felt uncomfortable was more than the number of females.
In contrast, when a fan was used, thermal comfort was greater for females than for males. The effect of using the fan was limited in increasing thermal comfort in the classroom during quite high temperatures at noon. However, in this condition, using the fan was instrumental in increasing the percentage of people who felt comfortable. By comparing the results of the PMV and PPD indices with the results of field measurements obtained that this calculation is quite sensitive to changes in increasing of air speed. To achieve thermal comfort in the classroom, it is still necessary to use the ceiling fan, especially in the afternoon, while at noon it is suggested that the air conditioning be used, with or without the fan. This combination would be beneficial, especially for energy savings.
References
Auliciems A. (1972). Classroom Performance as a Function of Thermal Comfort, International Journal of Biometeorology, 16(3), 233–246
Auliciems A., and Szokolay S.V. (2007). PLEA Note 3: Thermal Comfort, Brisbane: PLEA in association with Department of Architecture University of Queensland.
European Project ThermCo. (2009). Thermal Comfort in Buildings with Low-Energy Cooling, Thermal Comfort and Productivity, Technical University of Denmark.
Fanger P.O. (1970). Thermal Comfort. Analysis and Applications in Environmental Engineering, Copenhagen: Danish Technical Press,
Givoni, B. (1978) L'Homme, l'Architecture et le Climat, Paris: Editions du Moniteur. ISO. ISO 7730 (1985). Thermal Comfort, Zurich.
Kajtar L., Erdosi I. and Bako-Biro Z. (2000). Thermal and Air Quality Comfort of Office Buildings Based on New Principles of Dimensioning in Hungary, Periodica Polytechnica.
Kindangen J.I. (1997). Window and Roof Configurations for Comfort Ventilation. Building Research and Information, 25(4), 215–225
Kindangen J.I. (2006). Applicability of Design Elements and Passive Design for Comfort Ventilation. The 2nd International Networks for Tropical Architecture (iNTA) Conference, 3-5 April 2006, Yogyakarta.
Mochida A. and Yoshino H. (2005). Methods for Controlling Airflow in and Around a Building under Cross-ventilation to Improve Indoor Thermal Comfort, Journal of Wind Engineering and Industrial Aerodynamics, 93(6), 437–449
Mochida T. and Shimukura K. (1994). Values of Wettedness Observed in Clothed Subject and Theoretical Equal Line of Average Skin Temperature, The Annals of Physiological, 13(4), 197–203
Mochida, A., Yoshino, H., Takeda, T., Kakegawa, T. and Miyauchi, S. (2005). Methods for Controlling Airflow in and Around a Building under Cross-ventilation to Improve Indoor Thermal Comfort, Journal of Wind Engineering and Industrial Aerodynamics, 93(6), 437-449
Nicol F., Humphreys M. and Roaf S. (2012). Adaptive Thermal Comfort. Principles and Practice, London and New York: Routledge.
Olgyay, V. (1976). Design with Climate, New York: McGraw Hill. Thermal Comfort Presentation, (2001). Innova Airtech Instruments.
Wong N.H. and Khoo S.S. (2003). Thermal Comfort in Classrooms in the Tropics, Energy and Buildings, 35(4), 337–351