Issues
ISSN: 2146-4138
available at http: www.econjournals.com
International Journal of Economics and Financial Issues, 2018, 8(5), 332-341.
Cluster Analysis of the Eu Countries Which Turkey Has Textile
Trade
#1Fatma Feyza Gunduz
1, Selim Gunduz
2, Celile O. Dolekoglu
3*
Faculty of Business, Adana Science and Technology University, Adana, Turkey. *Email: [email protected]
Received: 12 July 2018 Accepted: 01 September 2018 DOI: https://doi.org/10.32479/ijefi.6886 ABSTRACT
Textile and clothing sectors are industries which have formed by the separation of the textile industry, the oldest industry of the industrialization period, in it’self. The branches of this industry have played an important part in the development of the developing countries accelerating the industrialization period during the period. The contribution of the textile and clothing industries which are labor-intensive industries to the economy in terms of labor force, foreign trade and new investments cannot be ignored. On the other hand, the industries in which competition capacity and branding speed are the highest are the textile and clothing industries. In this study, the export and import figures of the EU countries which make an important market in the textile industry with Turkey are analyzed by years. The foreign trade situation analysis in terms of protecting the competition capacity of Turkey is made and the differences and similarities between the member countries are tried to be determined. Hierarchical cluster analysis, which is one of the multivariate statistical methods, is applied to the import and export data of OECD between the years 2005 and 2016 and the countries within the EU market are extricated.
Keywords: Textile Sector, Foreign Trade, Industrialization, Cluster Analysis, Situation Analysis JEL Classifications: M31, F10
# This research was presented as a verbal statement at the 3rd International Social Sciences Symposium organized by Kahramanmaraş Sütçü İmam University on
26th-28th October 2017.
1. INTRODUCTION
The world economy is in a rapid transformation and development
process. Keeping pace with this rapidly progressing process and
existing within this process is not always easy. The countries have to form their own internal dynamics and keep up with the economic balance in order to reach the world’s speed. In this sense, the most important internal dynamics sustaining the countries and enabling them to keep up with the world are the industries which will develop the countries. It is possible to say that the textile and clothing industries are the leading ones among these industries. These industries which start with labor-intensive manufacturing and grow with the support of technology have been the driving powers of development for many countries including Turkey.
The textile industry has been regarded as one of the leading sectors after the Turkish War of Independence, has been very important for the Turkish economy with its contributions to the GNP, employment, and export in Turkey. It has an approximately
5% share within the GNP, 5.5-6% share in the total employment, 28-30% share in export and 21% share in import according to the
average of many years (www.tuik.gov.tr). Turkey’s hierarchically increasing competitiveness within the industry has started to decline in consequence of the change of the economic balances in the world economy with the millennium and the developments
after 2007.
Competition, which is defined as a kind of effort for outmaneuvering,
countries and the progress of the world economy. It affects the competitive capacity of a country also in foreign trade with branding, quality, product differentiation, and price. Competitive capacity means the increase in the potential and ability of the countries, in addition, it increases the life quality of the individuals
living in these countries (Aktan, 2003). The textile and clothing
sectors are among the industries which can carry this competitive capacity and achieve success in the competitions between the countries. Protecting and enhancing the competitive capacity of the sector which is placed near the top in the world gradation in export are important because of the common impact of the sector.
Turkey is the 31st in export and 21st in import in the world
according to the 2015-2016 data of the World Trade Organization (WTO). Turkey is the 5th in textile export with 11 billion $ and 9th
in textile import with 6 billion $ in the world. At the same time, it is the 7th with 15 billion $ in clothing export. The USA, China,
and the EU countries generally shape the textile and the clothing industries of the world. The EU is the most important market in
Turkey’s foreign trade in the industry. Turkey, which is the 3rd
most important supplier of the EU in terms of textile and clothing and the 2nd most important supplier in terms of textile and its raw materials, is directly affected by the changing dynamics in the EU
countries (İTKİB, 2017). Hence, the competitive advantage of
Turkey has changed on behalf of China and Bangladesh in recent years and new actors have started to enter the market. Turkey’s protecting its position in the EU market hierarchically becomes more important in this growing competitive environment. Because of this reason, clustering the countries to which Turkey has exports in this competitional area where there are common suppliers will be a source of data for both the decision makers and the enterprises.
The importance of the textile and the clothing sectors for either the country and the region and or the enterprises cause many
academic studies to be made in this field. Researches focused on competition are the leading studies (Dilber, 2004; Eraslan et al., 2008; Uzunoğlu, 2008; Yücel, 2010; Çoban and Kök, 2005; Utkulu and İmer, 2009; Altıntaş and Akpolat, 2013; Şahin, 2015; Özçalık, 2013; Özlem and Oduncu, 2016; Bashimov, 2017; Atış, 2014; Şahin and Şahbudak, 2016). Besides the researches propounding
Turkey’s competitive capacity in terms of the production factors,
foreign trade analyses (Şişman and Bağcı, 2015; Elitaş and Şeker, 2017; Aydoğuş and Diler, 2015; Özer, 2014) and the researches specific to the regions where the textile industry is important (Koçoğlu and Sarıtaş, 2016; Öndes and Tosunoğlu, 2015; Akdağ et al., 2014; Akbay and Doğaroğlu, 2017; Çütçü and Çelik, 2016; Hamşıoğlu, 2017; Hatunoğlu and Demir, 2014) are also at a quite
important level. Besides these ones, studies about the effectiveness
of the industry have also been made (Kaylıdere and Kargın, 2004; Çetin, 2015; Doğan and Ersoy, 2017; Öztürk and Girginer, 2015).
The cluster analyses which are instructive about the competitive capacity in the industry in which executive and organizational marketing problems are analyzed and which are used as effective tools in development are the studies where the variables such as distribution and infrastructure are analyzed in analyses in which rather regional condensations are discussed and cluster maps are
formed (Erenler et al., 2011; Akdağ, et al., 2014).
2. METHOD
In this study, hierarchical cluster analysis, which is one of the multivariate statistical methods, is applied to the OECD import
and export data of 2005-2016 and the countries in the EU market
are separated. Squared Euclidean distance function and Ward’s technique were used while the cluster analysis was being made. Moreover, a SWOT analysis was made in order to determine the strengths and weaknesses of Turkey and the opportunities and threats it would face. The IBM SPSS 24-Beta (Statistical Package for the Social Sciences) package software was used in the statistical analyses.
2.1. Cluster Analysis
Cluster analysis is a multivariate statistical analysis which consists of methods that gather the different units in different clusters and
the similar units in similar clusters in the Xdata matrix with n × p
dimension which forms with the measurements of the units which no prior knowledge is known about their cluster structure from
the point of Pvariable and reveal the secret clusters in the data
set and determine the characteristics of these clusters and enables predictions about the mass. Hierarchical cluster analysis, which is usually a branch of the cluster analysis is used in situations in which the number of the clusters is not certain in the data set in the beginning. The algorithms of the hierarchical cluster analysis contain a consecutive operation process and the cluster results obtained can be displayed graphically with a tree diagram known
as a dendrogram (Erişoğlu, 2011, s.23-27).
2.2. Swot Analysis
SWOT analysis is the analysis made by enterprises/industries/ countries and even people made for analyzing the situation they are in. It is a kind of situation analysis which enables to determine the strengths and weaknesses from their own point, notice the threats to be faced and take measures and present the chances
to use the opportunities. A SWOT analysis allows to define the problems about the analysis field of the related party and serves
the formation of a base for the future applications thanks to the
findings obtained (Kuşat, 2014, s.311). The analysis enables to
propound the present conditions and determine new strategies to adapt to the environmental conditions.
3. TEXTILE TRADE
3.1. World Textile Trade
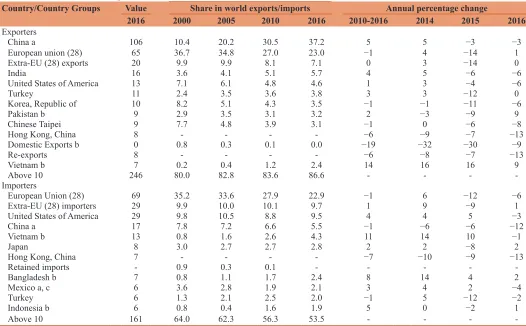
Competitive capacity hierarchically increases and changes direction in the textile trade of the world. Vietnam and Pakistan have started to play a part with an increasing share among the exporter countries including the EU countries, China, India, South
Korea and Turkey. China had the highest share in the textile exports in 2016 (37.2%) although its export decreased at a 3% rate. While the EU countries took a 23% share in the textile export with a 1% increase in 2016, the share of India was reflected as 5.7%. While
Pakistan arose to becoming the seventh from becoming the ninth,
Vietnam fell into the top 10 with a 9% increase (Table 1).
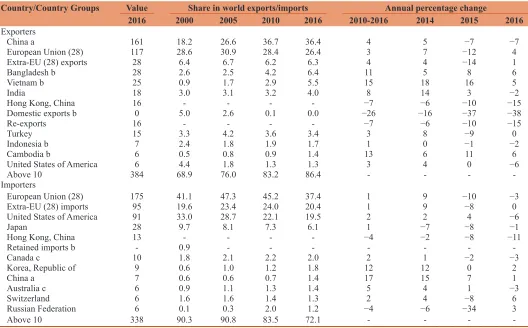
India rose to become fifth. In addition to this, while there was a decline in Hong Kong and China, however, it keeps its position of being the greatest exporter of the world representing the 36% of its export. In 2016, the EU countries increased its market share to 26.4% with a 4% increase (Table 2) (World Trade Statistical
Review, 2017).
Euler Hermes Economic Research Global Textile Report separated
the countries which dominate the textile market in the world into
two groups. The first group is the developed countries which have
a slow or negative sales development and the second group is the developing countries which have a long-term growth opportunity such as China and India. However, there is a common problem for both markets and it is about technology. Not supporting the decreasing sales of their retail stores with the online sales technology and not investing in automatization technologies to enhance the costs will continue to be a problem for especially the small and medium-sized businesses. The report predicts that the per capita expenditures will increase with the increase in the income of the middle classes although the industry has reached a maturity in these countries on the one hand. On the other hand, it predicts that many producers in the developed markets plan to go
out of business in 2018. The world textile market has a sensitive
risk in the light of these developments. According to the report,
while Russia and Brazil have a high risk, China, India, UK, Japan
and Italy have a moderate risk. The shortness of the product life curve within the fashion which causes sustainability problems, excessive satisfaction with the digitalization in retailing and the
increase in cotton prices are the factors which cause a loss in the industry.
3.2. Textile Industry and Trade of Turkey
The textile industry which was one of the development moves of
Turkey in the early years of the Republic of Turkey has protected its
importance until today. The changing world markets and balances also affect the textile industry like all industries. Participation of the new countries in the market, international treaties, wars,
conflicts and economic crises affect both the domestic markets
and foreign trade directly. For example, the expectations of a
global deflation and an increase in the FED (Federal Reserve System) interests caused 2015 to be a year when the industry
had a decrease in all of its branches in Turkey like many exporter countries (Tables 3 and 4).
It is mandatory for the Turkish textile and clothing industry which
makes most of its export to the EU countries (Table 5) with 50%
in textile and 71% in clothing according to 2017 data to be able to
protect its market obtaining for years in terms of the importance of the industry within the national economy.
Turkey’s trading volume to the EU countries has increased in the
textile industry at a significant rate like many other industries with
the country’s entrance to the customs union. The developments in the textile industry affect all of the economies strongly. Especially the continuity of the competitive capacity in the textile industry is quite important for the economy of Turkey. When the dispersion
Table 1: World textile foreign trade
Country/Country Groups Value Share in world exports/imports Annual percentage change
2016 2000 2005 2010 2016 2010-2016 2014 2015 2016
Exporters
China a 106 10.4 20.2 30.5 37.2 5 5 −3 −3
European union (28) 65 36.7 34.8 27.0 23.0 −1 4 −14 1
Extra-EU (28) exports 20 9.9 9.9 8.1 7.1 0 3 −14 0
India 16 3.6 4.1 5.1 5.7 4 5 −6 −6
United States of America 13 7.1 6.1 4.8 4.6 1 3 −4 −6
Turkey 11 2.4 3.5 3.6 3.8 3 3 −12 0
Korea, Republic of 10 8.2 5.1 4.3 3.5 −1 −1 −11 −6
Pakistan b 9 2.9 3.5 3.1 3.2 2 −3 −9 9
Chinese Taipei 9 7.7 4.8 3.9 3.1 −1 0 −6 −8
Hong Kong, China 8 - - - - −6 −9 −7 −13
Domestic Exports b 0 0.8 0.3 0.1 0.0 −19 −32 −30 −9
Re-exports 8 - - - - −6 −8 −7 −13
Vietnam b 7 0.2 0.4 1.2 2.4 14 16 16 9
Above 10 246 80.0 82.8 83.6 86.6 - - -
-Importers
European Union (28) 69 35.2 33.6 27.9 22.9 −1 6 −12 −6
Extra-EU (28) importers 29 9.9 10.0 10.1 9.7 1 9 −9 1
United States of America 29 9.8 10.5 8.8 9.5 4 4 5 −3
China a 17 7.8 7.2 6.6 5.5 −1 −6 −6 −12
Vietnam b 13 0.8 1.6 2.6 4.3 11 14 10 −1
Japan 8 3.0 2.7 2.7 2.8 2 2 −8 2
Hong Kong, China 7 - - - - −7 −10 −9 −13
Retained imports - 0.9 0.3 0.1 - - - -
-Bangladesh b 7 0.8 1.1 1.7 2.4 8 14 4 2
Mexico a, c 6 3.6 2.8 1.9 2.1 3 4 2 −4
Turkey 6 1.3 2.1 2.5 2.0 −1 5 −12 −2
Indonesia b 6 0.8 0.4 1.6 1.9 5 0 −2 1
Above 10 161 64.0 62.3 56.3 53.5 - - -
of the export of Turkey according to its geographical regions in
the period from the1970s to today is analyzed, three aspects attract
attention: (i) The EU has been the largest export destination of Turkey for years, (ii) The Middle East and North Africa region
is an alternative for Turkey to the European market.(iii) Turkey
cannot reach the Far East. Turkey has actualized almost half of
its export to the EU countries for the last 50 years. The Middle
East and North Africa are the second regions where Turkey
makes most of its export after Europe. Moreover, when Turkey concentrates on one of these two markets in years, it reduces its share in the other one. The region of Far East which demands
more than the one-third of the import in the world takes a 5%
share from the export of Turkey. Although the EU countries have kept their characteristic of being the main market in both import and export for many years, the role of the Far East increases in
the source of Turkey’s foreign trade deficit also with the influence
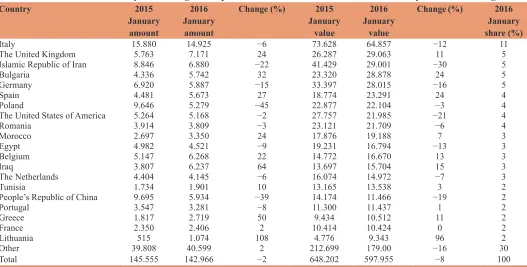
Table 3: Export on the Basis of Product Groups in the Turkish Textile and Raw Materials Industry in January 2016-1000 $ Ranking
Product group 2015 January
amount 2016 January amount Change (%) 2015 january value 2016 January value Change (%) 2016 january share
Woven fabrics 22.630 22.798 1 229.807 213.665 −7 36
Knitted fabrics 18.001 17.515 −3 116.446 103.550 −11 17
Nonwoven fabrics
and goods 32.733 32.412 −1 106.078 101.349 −4 17
Artifical synthetic
threads 24.635 26.991 10 92.199 90.180 −2 15
Cotton yarn 13.629 12.475 −8 41.434 35.999 −13 6
Artifical synthetic
fiber 14.136 15.993 13 32.158 27.152 −16 5
Raw cotton 17.119 11.331 −34 15.112 11.580 −23 2
Other threads 1.325 1.839 39 8.482 8.014 −6 1
Wool fiber 1.042 1.280 23 3.133 3.252 4 1
Wool yarn 301 309 3 3.197 3.009 −6 1
Other 8.5 3.6 −58 39 13 −67 0
Total 145.555 142.966 −2 648.202 597.955 −8 100
Source: Mediterranean Exporters’ Association (2016) Table 2: World clothing foreign trade
Country/Country Groups Value Share in world exports/imports Annual percentage change
2016 2000 2005 2010 2016 2010-2016 2014 2015 2016
Exporters
China a 161 18.2 26.6 36.7 36.4 4 5 −7 −7
European Union (28) 117 28.6 30.9 28.4 26.4 3 7 −12 4
Extra-EU (28) exports 28 6.4 6.7 6.2 6.3 4 4 −14 1
Bangladesh b 28 2.6 2.5 4.2 6.4 11 5 8 6
Vietnam b 25 0.9 1.7 2.9 5.5 15 18 16 5
India 18 3.0 3.1 3.2 4.0 8 14 3 −2
Hong Kong, China 16 - - - - −7 −6 −10 −15
Domestic exports b 0 5.0 2.6 0.1 0.0 −26 −16 −37 −38
Re-exports 16 - - - - −7 −6 −10 −15
Turkey 15 3.3 4.2 3.6 3.4 3 8 −9 0
Indonesia b 7 2.4 1.8 1.9 1.7 1 0 −1 −2
Cambodia b 6 0.5 0.8 0.9 1.4 13 6 11 6
United States of America 6 4.4 1.8 1.3 1.3 3 4 0 −6
Above 10 384 68.9 76.0 83.2 86.4 - - -
-Importers
European Union (28) 175 41.1 47.3 45.2 37.4 1 9 −10 −3
Extra-EU (28) imports 95 19.6 23.4 24.0 20.4 1 9 −8 0
United States of America 91 33.0 28.7 22.1 19.5 2 2 4 −6
Japan 28 9.7 8.1 7.3 6.1 1 −7 −8 −1
Hong Kong, China 13 - - - - −4 −2 −8 −11
Retained imports b - 0.9 - - -
-Canada c 10 1.8 2.1 2.2 2.0 2 1 −2 −3
Korea, Republic of 9 0.6 1.0 1.2 1.8 12 12 0 2
China a 7 0.6 0.6 0.7 1.4 17 15 7 1
Australia c 6 0.9 1.1 1.3 1.4 5 4 1 −3
Switzerland 6 1.6 1.6 1.4 1.3 2 4 −8 6
Russian Federation 6 0.1 0.3 2.0 1.2 −4 −6 −34 3
Above 10 338 90.3 90.8 83.5 72.1 - - -
of the global dynamics. The main reason for this increase is the
difficulty experienced by Turkey in reaching far markets, notably the Far East (Düşündere, 2017, p. 1-2).
4. FINDINGS
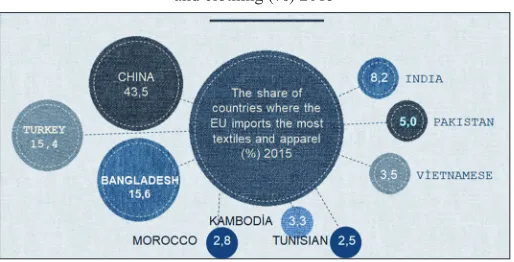
When the situation analysis of the textile and clothing industry was being made for Turkey, the most important competing countries in the foreign trade were considered. China, India, Pakistan, Bangladesh, Vietnam, Cambodia and Morocco are the most important competing rivals of Turkey especially in the EU market (www.trademap.org). Abolishment of the quotas, bilateral and multilateral agreements and the technical obstacles have changed the balances in the textile and clothing industries in the world trade. The market shares of China, Vietnam, Bangladesh, Cambodia and the other Asian countries in export have hierarchically increased beginning from the second half of
the 2000s (Figure 1).
In 2015, while Cambodia’s textile and clothing export to the EU increased 31.7%, Vietnam’s increased 23.9%, Bangladesh’s increased 23%, India’s increased 8.6% and China’s increased 6.8%, a 3.6% increase was experienced in Turkey’s export. The
mentioned countries’ share in export increased also according to
the 2016 data (İTKİB, 2017).
Turkey has the skill of gaining the advantage it has lost in terms of production costs with its closeness to the EU market, the customs
union, the sufficiency of its logistics infrastructure, high-quality production and the developments in technology and R and D.
Turkey also has the skill of gaining the advantage it has lost in terms of production with the existence of integrated production, skilled labor and the investments it has made in fashion-design and innovation. Increase in import due to the increase in population and income and lack of investments in fashion and design are the opportunities which will strengthen the competitive advantage Table 4: Countries which Turkey has the Highest Export in the Textile and Raw Materials Industry - 1000 $ Ranking
Country 2015
January amount
2016 January
amount
Change (%) 2015 January
value
2016 January
value
Change (%) 2016 January share (%)
Italy 15.880 14.925 −6 73.628 64.857 −12 11
The United Kingdom 5.763 7.171 24 26.287 29.063 11 5
Islamic Republic of Iran 8.846 6.880 −22 41.429 29.001 −30 5
Bulgaria 4.336 5.742 32 23.320 28.878 24 5
Germany 6.920 5.887 −15 33.397 28.015 −16 5
Spain 4.481 5.673 27 18.774 23.291 24 4
Poland 9.646 5.279 −45 22.877 22.104 −3 4
The United States of America 5.264 5.168 −2 27.757 21.985 −21 4
Romania 3.914 3.809 −3 23.121 21.709 −6 4
Morocco 2.697 3.350 24 17.876 19.188 7 3
Egypt 4.982 4.521 −9 19.231 16.794 −13 3
Belgium 5.147 6.268 22 14.772 16.670 13 3
Iraq 3.807 6.237 64 13.697 15.704 15 3
The Netherlands 4.404 4.145 −6 16.074 14.972 −7 3
Tunisia 1.734 1.901 10 13.165 13.538 3 2
People’s Republic of China 9.695 5.934 −39 14.174 11.466 −19 2
Portugal 3.547 3.281 −8 11.300 11.437 1 2
Greece 1.817 2.719 50 9.434 10.512 11 2
France 2.350 2.406 2 10.414 10.424 0 2
Lithuania 515 1.074 108 4.776 9.343 96 2
Other 39.808 40.599 2 212.699 179.00 −16 30
Total 145.555 142.966 −2 648.202 597.955 −8 100
Source: Mediterranean Exporters’ Association (2016)
Table 5: The share (%) and export change rate (%) of the country groups in Turkey’s textile and clothing export
Country Groups 2016 2017 Change rate
in textile Change rate in clothing Textile Clothing Textile Clothing
African Countries 10.12 3.94 10.32 3.59 5.04 −8.35
European Union (28) 51.06 70.77 50.29 71.44 1.43 1.47
Commonwealth of Independent States 8.29 5.30 8.79 5.23 9.24 −0.75
Other American Countries 1.43 0.19 1.18 0.20 −15.08 4.81
Other Asian Countries 4.07 0.52 4.17 0.60 5.35 16.19
Other European Countries 3.35 2.59 3.58 2.62 10.21 1.85
North America Free Trade Association 4.58 3.61 4.81 3.76 8.23 4.87
Oceania 0.26 0.24 0.27 0.22 4.55 −8.24
Middle East 12.56 11.78 12.10 11.25 −0.83 −3.98
Free Zone 2.17 0.43 2.56 0.42 21.31 −3.66
Far Eastern Countries 2.11 0.63 1.94 0.67 −5.09 6.62
for Turkey. The concentration of the production in certain fields
and not having a large range of products in export depending on it are also the opportunities which will strengthen the competitive advantage for Turkey.
However, the free trade agreements (FTA) the EU has with other countries, the conveniences in the entrance of cheap products, tariff and non-tariff barriers, the relations with the EU in economy and
politics, the fluctuations in foreign currency and inadequate raw
materials are the disadvantages of the sector. The FTA which is planned to be made with Pakistan has recently caused competition concerns for the Turkish producers because of the entrance of low-quality and cheap products into the country in terms of Turkish textile.
Another important topic which is important for the Turkish textile
sector is the approximately 97% of the industry’s consisting of small businesses. While this situation provides a flexibility for production on the one hand and it can create difficulties in terms of productivity and R and D, on the other hand (www.tetsiad.org).
It is seen that Turkey’s share in the textile industry is 3.98% and its share in the clothing industry is 3.41% in the world trade according
to the competing countries analysis table (Table 6). It is observed that Turkey falls behind China according to its share in the world trade. When its share in the national trade is regarded, Turkey’s
export share in the textile industry is 8% and its export share in the clothing industry is 11%. The higher an industry’s share in the
national export is, the more that country has to continuously keep and develop its markets about those products in that industry. Since Turkey’s market diversity is very rich, the share of the textile and clothing industries in the exports is not so high. According to the relative unit value, it is seen that Turkey’s export quality is not so
high in both textile and clothing fields. It is seen that Turkey has a quite rich market in textile and clothing fields in terms of market and product diversification qualities. The richness in the market
and product diversity means facing a situation with less risk in the industry and it is a quite advantageous situation for Turkey. When Turkey’s global performance change percentage and adaptation and contribution to the change in the demand in the world percentage are regarded, it is seen that it has a positive direction
in the field of textile and it has a negative direction in the field
of clothing. It is clear that it holds the whip hand in competitive capacity in the textile industry in terms of competitiveness share.
4.1. SWOT Analysis
One of the strengths of Turkey is indicated as its skill of gaining the advantage it has lost in terms of production costs with its closeness to the EU market and the customs union. It’s the
sufficiency of its logistics infrastructure, high-quality production and the developments in R and D and technology are its other
strengths. The existence of integrated production, skilled labor and its continuing understanding of investment in fashion, design, and innovation are the other advantages. Its other strengths can be sorted as its experience of long years in the industry and its ability to develop its market skills with this experience, international trust in these industries, ability to make boutique production and design and capacity of being original.
Turkey’s weaknesses are dependence on the EU in economic politics, differences in the approach to the industrial and commercial politics with the EU and its cost problem and distantness to the new and developing markets such as China and
Brazil. They are also high production costs and insufficiency in raw materials (cotton, rawhide and artificial fiber) depending on the production and decrease in the qualified employees. The other
weaknesses of Turkey are less diverse markets and countries when compared to the rivals, inadequacy in branding, approximately
97% of the industry consisting of small businesses, and inadequacy of the firms in terms of R and D.
Not being able to produce original products, not being able to develop with high added value and lack of machine production with advanced technology are the other weaknesses of Turkey.
Lack of inspection of the under the counter production,
unregistered employment, lack of interest in international and local standardization and not being well-known enough about the product quality internationally can be sorted as the other weaknesses.
Threats for Turkey are the conveniences in the entrance of cheap products, relations with the EU in the economy and social politics,
fluctuations in foreign currency and insufficient raw materials and
the buyers’ working without stock. They are also the increase in the preferential trade opportunities on behalf of some countries, efforts for developing the small businesses in the competing countries and purchase of goods without customs with the Mediterranean FTA of the EU. The threats are also the existence of countries exporting without quotas, the decisions of the countries which are important cotton producers to affect the world market and the membership of
the competing countries to the WTO. Liberalization of the foreign
trade, increase in the direct foreign investments, the FTA made with Pakistan, the entrance of the low-quality and cheap products into Turkey and them causing a competition concern for the domestic producers can be expressed as the other threats for Turkey.
Increase in the imports in countries such as India due to the increase in population and income, lack of investment in infrastructure and fashion and design are the opportunities which will strengthen the competitive advantage for Turkey. They are also the concentration
of the production in certain fields and not having a wide range of
products in exports due to it. Besides, increase in labor costs in the competing countries, high energy prices, internal disturbances Source: www.trademap.org
Table
6:
Analysis of the Competing Countries 2016
Some performance indicators
China India Pakistan Vietnam Bangladesh Mor occo Tunisia Cambodia Turkey Te xtil e Clothing Textile Clothing Textile Clothing Textile Clothing Textile Clothing Textile Clothing Textile Clothing Textile Clothing Textile Clothing
Share in world trade
(%) 36.4 34.6 5.54 3.89 2.64 1.1 1 2.08 5.52 0.54 7.32 0.16 0.66 0.13 0.66 0.06 1.44 3.98 3.41
Share in national export
(%) 5 7 6 6 37 24 2 11 4 87 2 13 2 22 1 66 8 11
Relative unit value world=1
1 1.4 0.9 1.1 0.7 1 1 1.1 0.7 0.8 1 1.2 1 1.6 1 0.8 0.9 0.8 Market diversity 26 14 14 9 13 7 7 4 14 12 2 3 3 6 6 9 30 14 Product diversity 79 54 48 36 18 19 25 41 10 14 3 33 11 14 14 14 31 24
Global performance change
(%) 2.2600 −1.7200 1.2300 3.8100 −2.1500 2.2600 11.0500 12.2700 −2.8200 12.0500 5.5100 −2.8000 −5.0800 0.0400 58.3700 10.4000 0.0700 −0.6000
Adaptation and contribution to thr change in demand in the world
(%) 0.8000 0.9600 0.0822 −0.4100 0.1300 −0.7800 2.9200 1.7700 4.6700 2.6400 8.9200 0.7100 3.3400 3.5300 −27.5800 −0.9600 0.5100 −2.2000
Competitiveness effect
(%) 1.0900 −1.6000 1.0400 2.0200 −1.9200 2.3000 7.9600 9.2200 −3.9500 10.6900 −1.9100 −4.5200 −6.3200 0.3500 86.5700 10.4600 0.1200 −1.2800
Operation cost per hour
($) 2014* 2.65 1.12 0.62 0.74 0.62 3.12 3.18 5.48
Source: Compiled from the ITC data by the authors, (https://www
.intracen.or
g/itc), *www
in the countries in the Mediterranean region, low educational
levels, insufficient entrepreneurship, and unemployment are the other opportunities. Limited markets in the Mediterranean
countries and the EU taking high shares and the transatlantic trade and investment partnership between the EU and the USA can be
sorted as the other opportunities. The influence of the financial crisis between 2007 and 2008 in countries where Turkey has
export also caused its export share to regress. Although the rival countries in the EU market have advantages in terms of especially labor and raw materials, the increase in the labor costs like the one experienced by China can restrict the sustainability of this advantage in the long run.
As it is seen in the dendrogram graphic in Figure 2 based on Turkey’s export data, according to the cluster analysis results, the EU countries Turkey has export can be assessed as 3 different clusters, considering Germany as a cluster alone and making a cluster with the Netherlands, Italy, Spain, and France and forming another cluster including the other countries. Germany plays an important part especially in the disintegration of the citizens of
Turkish descent. Germany takes a 26% share in the total export of 2016. The share of the countries of the second group is 38% and their export shares change between 7% and 14%. However, when the 6% shares of Bulgaria and Poland are considered, an option
of assessing these two countries as a subgroup can be thought.
As it is seen in the dendrogram graphic in Figure 3 based on Turkey’s import data, according to the cluster analysis results, Italy disintegrates from the other countries as the country which has the largest import volume among the EU countries where Turkey imports textile and textile products. While Germany which follows Italy is assessed as another cluster, it is possible to
assess the other remaining 25 EU countries as a separate cluster
because their trade volumes are close to each other. Spain and Italy which are important in terms of design and production ability in clothing have not disintegrated. The results of this cluster play an important part in disintegrating the other countries which are the most important textile and clothing importers of the world for Turkey which experiences a concentration in the market in the EU.
5. CONCLUSION AND
RECOMMENDATIONS
The world trade increased 2, 8 between 2010 and 2016 according to the WTO data in spite of internal conflicts, wars, economic and political crises. In 2016, the world export was 15.464 billion $ and the world import was 15.799 billion $. The EU is the greatest buyer and seller in foreign trade. 38.4% of the world export and 37.4% of the world import is actualized by the EU. This
domination of the EU shows itself in all industries. One of the most important product groups imported by the EU is textile and
clothing. The world textile and clothing export which was 747.6 billion dollars in 2016 is the 5% of the total world trade. The EU takes a 24% share from this export and takes approximately a 40% share from the clothing world import. More than the 1/3 of
the textile and clothing products produced in the world is sold in
the EU market (World Trade Statistical Review, 2017). Turkey
is one of the largest textile and clothing suppliers of the EU. It
is the 3rd among the countries the EU has import in the total of textile and clothing industry. It is the 2nd in the EU in the textile
and raw materials industry (İTKİB, 2017). From the point of
Turkey, it is important because of both the participation of new countries to the countries considered as the traditional market and the entrance of the new exporters to the market. China, India, Pakistan, Bangladesh, Vietnam, Tunisia, Cambodia, and Morocco are the most important competing countries for Turkey in the EU market. The share of these countries hierarchically increased
beginning from the second half of the 2000s. The influence of the financial crisis in the same period caused the export share to
regress in the countries where Turkey had an export. Although the competing countries have advantages in the EU market especially in terms of labor and raw materials, the increase in the labor costs like it is experienced in China restrict the sustainability of this advantage. However, it is clear that the high cost of raw materials, energy, and labor cost progressing at these levels in Turkey will
make it difficult to take advantage of this opportunity. Turkey
reduces its cost disadvantage with the advantage it has especially
in the market and product diversification when compared to
the competing countries. Turkey should keep its strategies for keeping the advantage it has in countries which purchase the
65 % of the export such as Germany, Holland, Spain, Italy, and France with quality and product diversification. Besides, it should
develop strategies which will provide a price advantage for the EU countries with lower per capita income. Growing the market of Germany which is the largest textile and clothing importer of the EU is one of the weaknesses to be developed. Considering
Figure 2: Dendrogram according to the export data
the demands which have regional disparities and the reasons for the decrease in the textile export which has had a decline in recent years should be discussed. The advantage of transportation should be supported by providing the raw materials domestically because of the closeness to the market. Cotton unseed production
which has fluctuated and inclined to decrease in many years has increased to 2450 tons in 2017 according to the Turkish Statistical
Institute data. It is a development which has emerged because the production decreased because of the international developments
in 2015 inclined to increase in 2016 and 2017 again but it should
be continued. Hence, the rate of capacity use in the industry has
increased to over 80%.
Turkish textile and clothing sectors have a value in terms of quality, diversity and design either in the EU countries or in
Turkey’s other markets such as Russia. Protection of this value
and presenting steady products to new markets and consumers within this frame will provide a sustainable advantage against the rivals. One of the most important risks in the industry is the
employment of unregistered workers by the small firms in order
to eliminate the low productivity, unregistered production, and the increasing labor costs. Especially the refugees coming from Syria working in this industry for low wages cause important problems in terms of quality and productivity. This practice is inevitable in Turkey which is more disadvantageous than its rivals in terms of the share of the labor in the costs. However, taking encouraging measures such as making insurance for the registered labor and exemption from tax etc. will provide stability in the production
with permanent and qualified labor. In addition, cost advantages
will be provided for the companies. At the same time, the economic loss caused by the unregistered economy will be prevented.
REFERENCES
Akbay, C., Doğaroğlu, S. (2017), Kahramanmaraş ilindeki tekstil firmalarının dış ticaret yapısı. Kahramanmaraş Sütçü İmam University Journal of Agriculture and Nature, 20(1), 47-60. Akdağ, R., Mehmet, M., Emhan, A. (2014), Diyarbakır tekstil ve hazır
giyim sektörünün elmas modeli ile kümelenme analizi. Süleyman Demirel University The Journal of Faculty of Economics and Administrative Sciences, 19(2), 323-342.
Aktan, C.C. (2003), Türkiye’de Üretim ve İstihdama Yönelik Ulusal Rekabet Gücü Politikası. (Rewarded Work with Honorable Mention in the Employment Competition Organized by TİSK). Anahtar: TİSK. p1-5.
Altıntaş, N., Akpolat, A. (2013), Tekstil sektöründe avrupa birliği ile Türkiye arasındaki rekabet analizi. The Journal of Kafkas University Economics and Administrative Sciences Faculty, 4(6), 33-42. Atış, A. (2014), Türkiye’nin tekstil ve konfeksiyon sektörünün
karşılaştırmalı rekabet analizi. Ege Academic Review Journal of Economics, Business Administration, International Relations and Political Science, 14(2), 315-334.
Available from: http://www.eulerhermes.com/economic-research/sector-risks/Global-Textile-Report/Pages/default.aspx?q=search_dsa&gcli d=EAIaIQobChMIw5SBl6iM2wIVAmUZCh25YQIhEAAYASAA EgKVj_D_BwE. [Last accessed on 2018 May 02].
Available from: https://www.intracen.org/itc. [Last accessed on 2017 Oct 10].
Available from: https://www.tetsiad.org/files/downloads/bilgi_bankasi/ thg%20raporu.pdf. [Last accessed on 2017 Jul 17].
Available from: https://www.tim.org.tr/ihracat-rakamları.html. [Last accessed on 2018 May 03].
Available from: https://www.trademap.org. [Last accessed on 2017 Oct 17].
Available from: https://www.tüik.gov.tr. [Last accessed on 2018 May 02]. Available from: https://www.wernerinternational.org. [Last accessed on
2017 Oct 10].
Aydoğuş, İ., Diler, H.G. (2015), Tekstil ürünleri ihracatında stratejik dış ticaret yaklaşımı: Türkiye Ve Çin üzerine bir uygulama. Afyon Kocatepe University Journal of Economics and Administrative Sciences, 11(2), 1-17.
Bashimov, G. (2017), Orta asya ekonomilerinin tekstil ve hazır giyim sektöründeki uluslararası rekabet gücü. İşletme ve İktisat Çalışmaları Dergisi, 5(2), 23-33.
Çetin, A.C. (2015), Türk tekstil sektörü ve Türk tekstil firmalarinin etkinlik düzeylerinin belirlenmesi. Afyon Kocatepe University Journal of Economics and Administrative Sciences, 8(2), 255-278.
Çoban, O., Kök, R. (2005), Türkiye tekstil endüstrisi ver rekabet gücü: AB ülkeleriyle karşılaştırmalı bir analiz örneği, 1989-2001. İktisat İşletme ve Finans, 20(228), 68-81.
Çütçü, İ., Çelik, M. (2016), İnovasyonun tekstil ihracatına etkisi: Güneydoğu anadolu bölgesi uygulaması. Gazi University Journal of Social Sciences, 3(5), 15-42.
Dilber, İ. (2004), Tekstil ve konfeksiyon sanayinin rekabet gücü. Manisa Celal Bayar University The Faculty of Economic and Administrative Science Journal, 11(2), 85-98.
Doğan, N.Ö., Ersoy, Y. (2017), Efficiency measurement: A case study of a firm in the textile sector. Hitit University Journal of Social Sciences Institute, 10, 35-44.
Düşündere, A. (2017), Türkiye’nin Uzak Pazarlara Erişimine e-Ticaret Çözüm Olabilir Mi? Available from: http://www.tepav.org.tr. [Last accessed on 2017 Aug 30].
Elitaş, B.L., Şeker, A. (2017), Uluslararası ticarette tarife dışı önlemlerin rolü: Türkiye tekstil sektörü üzerine bir arastırma. The Journal of Accounting and Finance, 2017, 51-74.
Eraslan, İ.H., Bakan, İ., Helvacıoğlu, K.A.D. (2008), Türk tekstil ve hazırgiyim sektörünün uluslararası rekabetçilik düzeyinin analizi. Istanbul Commerce University Journal of Social Sciences, 7(13), 265-300.
Erenler, G., Aluftekin, N., Yüksel, Ö., Taş, A., Bayraktar, F. (2011), Denizli tekstil hazır giyim sektörü bölgesel yoğunlaşma (Kümelenme) göstergeleri. Journal Of Industrıal Engıneerıng, 23(2), 2-27. Erişoğlu, M. (2011), Uzaklık Ölçülerinin Kümeleme Analizine Olan
Etkilerinin Incelenmesi Ve Geliştirilmesi. Adana: Çukurova University Institute of Natural and Applied Sciences, Department of Statistics, Unpublished Phd Thesis.
Hamşıoğlu, A.B. (2017), Girişimci yönlülük, stratejik yönlülük ve performans ilişkisi: İstanbul ili tekstil işletmelerinde bir uygulama. Journal of Business Research, 9(2), 376-403.
Hatunoğlu, Z., Demir, S. (2014), The Effect of Cost Management ın Busıness Decision-Makıng Process: A Research ın the Textıle
Sector ın Kahramanmaras. Tokyo: 3rd International Symposium on
Accounting and Finance Isaf. p397-414.
İTKİB. (2017), Avrupa Birliği İthalatında Türkiye’ nin Yeri. İTKİB Hazır Giyim ve Konfeksiyon Şubesi.
Kaylıdere, K., Kargın, S. (2004), Çimento ve tekstil sektörlerinde etkinlik çalışması ve veri zarflama analizi. Dokuz Eylul University Journal of Graduate School of Social Sciences, 6(1), 196-219.
Koçoğlu, D., Sarıtaş, E. (2016), İhracat pazarlama faaliyetlerinde pazarlama karması adaptasyonu ve denizli tekstil sektöründe bir araştırma. Pamukkale University Journal Of Social Sciences Institute, 25(1), 124-134.
mevcut durum değerlendirmesi. Çankırı Karatekin University Journal of the Faculty of Economics and Administrative Sciences, 4(1), 299-324.
Öndes, T., Tosunoglu, B. (2015), TR90 bölgesinde faaliyet gösteren ısletmelerin üretim maliyetlerinin rekabet gücü üzerindeki etkisi/ ımpact of production costs of enterprises operating in tr90 region on competitiveness. The Journal of Accounting and Finance, 68, 1-16. Özçalık, M. (2013), Türk tekstil ve hazır giyim sektörlerinin gümrük
birliği sonrası AB- 15 ülkeleri karşısındaki rekabet gücü. Celal Bayar University Journal of Social Sciences, 11(1), 205-223..
Özer, O.O. (2014), Determınants of Turkey’s textıles exportatıon: The gravıtatıon model approach. Journal of Textile and Apparel, 24(3), 252-258.
Özlem, K., Oduncu, A. (2016), Türk tekstil sektörünün uluslararası rekabet gücü değerlendirmesi. Academic Sight International Refereed Online Journal of Social Sciences, 54, 418-428.
Öztürk, O., Girginer, N. (2015), Türk tekstil ve hazır giyim firmalarının ihracat etkinliği: Veri zarflama analizi (VZA) ve analitik hiyerarşi süreci (AHS) kullanımıyla bir inceleme. Tekstil ve Konfeksiyon, 25(1), 10-23.
Şahin, D. (2015), Türkiye ve çin in tekstil ve hazır giyim sektöründe rekabet gücünün analizi. Academic Sight International Refereed Online Journal of Social Sciences, 47, 155-171.
Şahin, D., Şahbudak, E. (2016), Makine ve ulaştırma araçları sektöründe rekabet gücünün analizi: Türkiye, çin ve hindistan örneği. Journal
Of International Social Research, 9(45), 865-876.
Şişman, M., Bağcı, E. (2015), Türkiye tekstil ve hazır giyim sektöründe ithalat bağımlılığı. Marmara University Journal of Economic and Administrative Sciences, 36(1), 29-53.
Utkulu, U., İmer, H. (2009), Türk tekstil ve konfeksiyon sektörünün avrupa birliği tekstil ve konfeksiyon sektörü karşısındaki rekabet gücünün alt sektörler düzeyinde ölçülmesi. Competition Journal, 36, 3-43.
Uzunoğlu, H. (2008), Türk Hazır Giyim ve Tekstil Sektörünün 2008 Yılı Rekabet Durumu (II). İZTO, AR and GE Bulletin. p23-27. World Trade Statistical Review. (2017), Available from: https://www.
wto.org/english/res_e/statis_e/wts2017_e/wts17_toc_e.htm. [Last accessed on 2018 May 02].
WTO, Annual Report. (2016), Available from: https://www.wto.org/ english/res_e/booksp_e/anrep_e/anrep16_e.pdf. [Last accessed on 2017 Oct 08].
Yerman, E. (2016), Tekstil ve Hammaddeleri Sektörü İhracat Rakamları Değerlendirmesi. Mediterranean Exporters’ Association. Available from: http://www.akib.org.tr/files/downloads/arastirmaraporlari/ tekstil/tekstil_sektor_raporu-ocak-mart.pdf [Last accessed on 2017 Jan 16].